TL;DR: Market cycles in the BSE and NSE represent predictable patterns of price movement (uptrend, downtrend, sideways) driven by investor sentiment and economic factors, allowing traders to strategically time their entries and exits for potential profit.
Key Stats at a Glance:
- Nifty 50’s average annual volatility: ~15-20%
- BSE Sensex historical average annual return (long-term): ~14%
- Typical duration of a bull market phase: 3-10 years
- Typical duration of a bear market phase: 1-3 years
- Number of listed companies on NSE (as of early 2024): Over 2,000
What are Market Cycles in the Indian Stock Market?
Market cycles in the BSE and NSE refer to the recurring, though not perfectly timed, patterns of expansion and contraction in stock prices, broadly categorised into four phases: accumulation, markup, distribution, and markdown.
The Indian stock market, comprising the Bombay Stock Exchange (BSE) and the National Stock Exchange (NSE), doesn’t move in a straight line. Instead, it exhibits cyclical behaviour, mirroring the broader economic environment and shifts in investor psychology. These cycles are fundamental to understanding price action and developing effective trading strategies. Recognising these phases helps traders and investors align their actions with the prevailing market sentiment, potentially enhancing profitability and mitigating risk. For instance, understanding that a ‘markup’ phase is characterised by rising prices and strong buying interest can inform decisions to enter long positions.
These cycles are influenced by a myriad of factors, including economic indicators (GDP growth, inflation, interest rates), corporate earnings, geopolitical events, and changes in investor sentiment. While the exact timing and duration of each cycle are unpredictable, their existence is a well-established phenomenon in financial markets worldwide, including India.
How do Market Cycles Affect Trading and Investment Strategies?
Market cycles dictate the optimal trading and investment strategies by indicating whether to focus on buying opportunities during uptrends, defensive positioning during downtrends, or careful selection during sideways consolidation.
A trader who ignores market cycles might find themselves buying at the peak of an uptrend or selling at the bottom of a downtrend, leading to significant losses. Conversely, an investor who understands these cycles can adapt their approach. During an ‘accumulation’ phase, prices are consolidating, and smart money might be quietly buying; a cautious investor might wait for confirmation. In a ‘markup’ phase, a trend-following strategy is often effective, entering trades in the direction of the established uptrend. The ‘distribution’ phase sees smart money exiting positions as prices become overvalued, and a trader might consider taking profits or looking for shorting opportunities. Finally, during a ‘markdown’ phase, a defensive posture or short-selling strategy might be employed.
The Four Phases of a Market Cycle
Understanding the distinct characteristics of each phase is key to navigating market cycles effectively.
1. Accumulation Phase
This is typically a sideways period following a downtrend, where prices trade within a range. Smart money, such as institutional investors, begin to quietly buy assets at relatively low prices, anticipating a future rise. Retail investor sentiment is often negative or indifferent, creating a buying opportunity for those who recognise the signs.
2. Markup Phase
Often referred to as the bull market, this phase is characterised by a sustained uptrend. Prices move higher, breaking through previous resistance levels. Investor confidence grows, and public participation increases, often leading to parabolic price action towards the end of this phase. This is when most traders and investors experience significant gains.
3. Distribution Phase
Similar to accumulation, this is a sideways period, but it occurs after a significant uptrend. Prices consolidate, and smart money begins to sell their holdings at elevated prices to less informed buyers. Investor sentiment is often overly optimistic or euphoric. This phase sets the stage for a potential price decline.
4. Markdown Phase
This is the bear market phase, characterised by a sustained downtrend. Prices fall, breaking through support levels. Investor confidence erodes, leading to panic selling and capitulation. This phase can be painful for long-term investors but can present opportunities for short-sellers or contrarian buyers looking for the next accumulation phase.
How to Identify Market Cycles on BSE and NSE?
Identifying market cycles involves analysing price action, volume, investor sentiment, and macroeconomic data using various technical and fundamental tools.
Traders and investors can employ several methods to discern which phase of the market cycle is currently active on the BSE and NSE. While no single indicator is foolproof, a combination of tools provides a more reliable picture. Observing price patterns on charts, such as higher highs and higher lows (uptrend) or lower highs and lower lows (downtrend), is fundamental. Volume analysis can confirm the strength of a trend; increasing volume on up-moves suggests accumulation or markup, while increasing volume on down-moves can indicate distribution or markdown. Gauging investor sentiment through news, social media, and surveys can also provide clues. Additionally, tracking key economic indicators released by bodies like the Reserve Bank of India (RBI) helps in understanding the broader economic backdrop influencing the cycles.
How to Apply Market Cycle Analysis in Trading:
- Observe Price Action: Look for trends (higher highs/lows for uptrend, lower highs/lows for downtrend) or consolidation patterns (ranges).
- Analyse Volume: Confirm trends with volume; rising volume on up-moves suggests strength, while rising volume on down-moves can signal distribution.
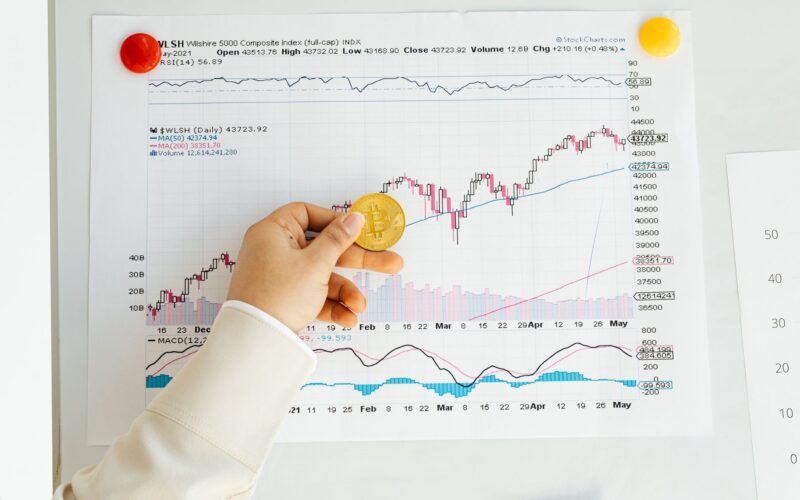
- Use Technical Indicators: Employ moving averages (e.g., 50-day and 200-day) to identify trend direction and potential trend changes. Oscillators like RSI or MACD can help identify overbought/oversold conditions within phases.
- Monitor Investor Sentiment: Follow financial news, social media chatter, and investor surveys to gauge fear and greed.
- Consider Macroeconomic Factors: Stay updated on economic data (inflation, interest rates, GDP) from sources like the RBI and government reports.
- Identify Support and Resistance: These levels become crucial during sideways (accumulation/distribution) phases and can act as targets or reversal points.
- Look for Confirmation: Don’t rely on a single indicator; seek confluence from multiple tools before making trading decisions.
- Adapt Your Strategy: Align your trading approach with the identified cycle phase – trend-following in markup, range-trading in accumulation/distribution, or defensive/shorting in markdown.

What Tools Can Help Identify Market Cycles?
Several tools and indicators, available on platforms like TradingView, can aid in identifying market cycles on the BSE and NSE.
While price action itself is the primary source of information, technical indicators can help confirm and clarify the phase of a market cycle. Moving Averages (MAs), particularly the 50-day and 200-day Simple Moving Averages (SMAs), are widely used. When the price is above both MAs, and the 50-day MA is above the 200-day MA, it generally indicates an uptrend (markup phase). The opposite suggests a downtrend (markdown phase). The Relative Strength Index (RSI) can help identify overbought (above 70) or oversold (below 30) conditions, which often occur near the end of markup or markdown phases, signalling potential distribution or accumulation. The MACD (Moving Average Convergence Divergence) can also signal trend strength and potential reversals. Chart patterns like Head and Shoulders (top reversal) or Inverse Head and Shoulders (bottom reversal) are classic indicators of distribution and accumulation, respectively.
The Role of Candlestick Patterns
Specific candlestick patterns can provide granular insights into the sentiment at the end of each phase, helping traders pinpoint potential turning points.
Candlestick charts offer a visual representation of price movement within a specific period, showing the open, high, low, and close. Certain patterns formed at the end of a trend can signal a potential reversal. For example, a ‘Doji’ or a ‘Hammer’ appearing after a prolonged downtrend might suggest accumulation is underway. Conversely, patterns like a ‘Shooting Star’ or ‘Evening Star’ after a prolonged uptrend could indicate distribution and a potential markdown phase beginning. Understanding these patterns, alongside volume, can provide crucial short-term signals.
Utilising Volume Analysis
Volume is the bedrock of confirming price movements and identifying the conviction behind market phases.
High volume accompanying a price move indicates strong participation and conviction. In an accumulation phase, you might see erratic price movements but gradually increasing volume as institutions build positions. During the markup phase, rising prices should ideally be supported by increasing volume. If prices continue to rise on declining volume, it can be a warning sign of weakening momentum. Distribution might be confirmed by sharp price declines on very high volume, indicating a rush to sell. A downtrend (markdown) often sees strong selling pressure, meaning price declines should occur on heavy volume.
Sentiment Indicators
Gauging the mood of the market can offer a contrarian perspective on cycle phases.
Investor sentiment often reaches extremes at the turning points of market cycles. Euphoria and extreme bullishness typically prevail at the end of a markup phase, while widespread fear and pessimism characterise the bottom of a markdown phase. Sentiment indicators, whether through surveys (like the AAII Sentiment Survey, though not Indian-specific, the principle applies) or analysing the put-call ratio on NSE derivatives, can help identify these extremes. When most participants are extremely bullish, it often signals a good time to be cautious or consider taking profits (approaching distribution). When fear is rampant, it may signal a potential buying opportunity (approaching accumulation).
How to Profit from Market Cycles in Indian Equities?
Profiting from market cycles involves aligning trading strategies with the prevailing phase, focusing on trend-following in markup, range-bound strategies in accumulation/distribution, and cautious approaches in markdown.
The key to profiting is not to predict the exact top or bottom but to participate in the dominant trend of each cycle phase. During the markup phase, employing trend-following strategies using tools like the Trend Traders Tool or simply moving averages can capture significant gains. In the accumulation and distribution phases, which are often sideways, range-trading strategies or waiting for clear breakouts become more effective. For traders who are adept, short-selling during the markdown phase can be profitable, but it carries higher risk and requires strict risk management. For long-term investors, the accumulation and markdown phases offer opportunities to buy quality assets at discounted prices, anticipating future growth.
Adapting to Volatility
Market cycles are inherently linked to volatility; understanding this relationship is key to risk management.
Volatility tends to increase significantly during the transition periods between market cycles, particularly during the distribution and markdown phases, as uncertainty and fear grip investors. While a trending market (markup) might exhibit smoother upward price movements, the sharp declines characteristic of a markdown phase can be swift and severe. Traders must adapt their position sizing and stop-loss strategies according to the prevailing volatility. Higher volatility warrants smaller position sizes and potentially wider stop-losses (though still tight on a percentage basis) to avoid being shaken out by normal price fluctuations.
Frequently Asked Questions
What is the most profitable market cycle phase?
The markup phase (bull market) is typically the most profitable for most investors as prices trend upwards, leading to broad gains across many sectors.
Can market cycles predict exact tops and bottoms?
No, market cycles describe general patterns but cannot precisely predict the exact timing or magnitude of market tops and bottoms.
Are market cycles the same for all asset classes?
While the concept of cycles applies broadly, their duration, amplitude, and drivers can differ significantly between asset classes like stocks, bonds, commodities, and real estate.
How often do market cycles occur?
Market cycles are not fixed; their duration varies. Bull markets can last several years, while bear markets can range from months to a few years, influenced by numerous economic and global factors.
Is it better to trade or invest during market cycles?
Trading is often more suited to shorter-term cycle phases (e.g., capturing trends in markup or range-bound moves in accumulation/distribution), while long-term investing is often best done by accumulating assets during markdown or accumulation phases for future growth.
Key Takeaways
- Market cycles on BSE and NSE are recurring patterns of price movement (accumulation, markup, distribution, markdown).
- Understanding these cycles helps traders and investors align strategies with prevailing market sentiment and economic conditions.
- Technical tools like moving averages, RSI, MACD, volume analysis, and chart patterns aid in identifying the current cycle phase.
- Investor sentiment plays a crucial role, often reaching extremes at cycle turning points.
- Adapting trading strategies – trend-following in markup, range-trading in sideways phases, and cautious approaches in markdown – is key to profitability.
- Volatility often increases during transitions between cycles, requiring adjustments in risk management.
- Long-term investors can benefit by acquiring assets during accumulation or markdown phases.
Trading in securities is subject to market risks. Read all related documents carefully before investing. Investments in the securities market are subject to market risks. Please read all the related documents carefully before investing.




 Finovatives