TL;DR: Gap trading in Indian markets capitalizes on price gaps between trading sessions, offering potential profit by identifying gaps (up or down) and predicting continuation or reversal. Key strategies involve analysing gap types and using technical indicators to confirm trade setups.
Key Stats at a Glance:
- Nifty 50 has experienced an average of 10-15 significant price gaps per year.
- Certain sectors on NSE, like IT and Pharma, historically show higher gap frequency.
- Average daily trading volume on NSE crosses ₹1 Lakh Crore.
- Over 4,000 stocks are listed across NSE and BSE combined.
- The cost of a basic TradingView indicator subscription can be recovered quickly with successful gap trades.
What is a Price Gap in Trading?
A price gap occurs when a stock’s opening price is substantially higher (gap up) or lower (gap down) than its previous day’s closing price, with no trading activity in between. These gaps often signal strong market sentiment or significant news impacting the stock overnight, creating potential trading opportunities.
Why Do Price Gaps Occur in Indian Markets?
Price gaps in Indian markets like the NSE and BSE are primarily driven by significant overnight news, corporate announcements, or global market events that drastically alter a stock’s perceived value before the market opens. Factors include earnings reports, regulatory changes announced by SEBI, geopolitical developments, or major economic data releases affecting investor sentiment.
Types of Price Gaps
There are several types of price gaps traders look for: common gaps, breakaway gaps, runaway gaps, and exhaustion gaps. Common gaps are the least significant and often fill quickly. Breakaway gaps signal the start of a new trend, while runaway gaps occur within an established trend, indicating strong momentum. Exhaustion gaps appear at the end of a trend and suggest a reversal is imminent.
Common Gaps
Common gaps are not usually associated with significant news and can occur within a trading range. They often get filled within a few trading sessions and are generally considered less reliable for trading purposes.
Breakaway Gaps
These gaps signal a potential breakout from a consolidation or trend pattern. They occur when the price moves decisively beyond a support or resistance level, often accompanied by increased trading volume, suggesting the start of a new, strong trend.
Runaway Gaps
Also known as measuring gaps, these occur in the middle of a strong price trend. They indicate strong conviction from buyers (in an uptrend) or sellers (in a downtrend) and suggest the trend is likely to continue.
Exhaustion Gaps
These gaps appear at the end of a prolonged trend and signal that the momentum is waning. They are often characterized by high volume as latecomers jump in, but the subsequent price action typically leads to a reversal and filling of the gap.
How to Identify and Trade Price Gaps?
Identifying and trading price gaps requires careful observation of price action, volume, and the use of technical analysis tools. The goal is to determine whether a gap is likely to be filled (reversal) or if it will lead to a continuation of the existing trend. Understanding the context of the gap, such as its location on the chart and the volume accompanying it, is crucial.
Utilizing Volume Analysis
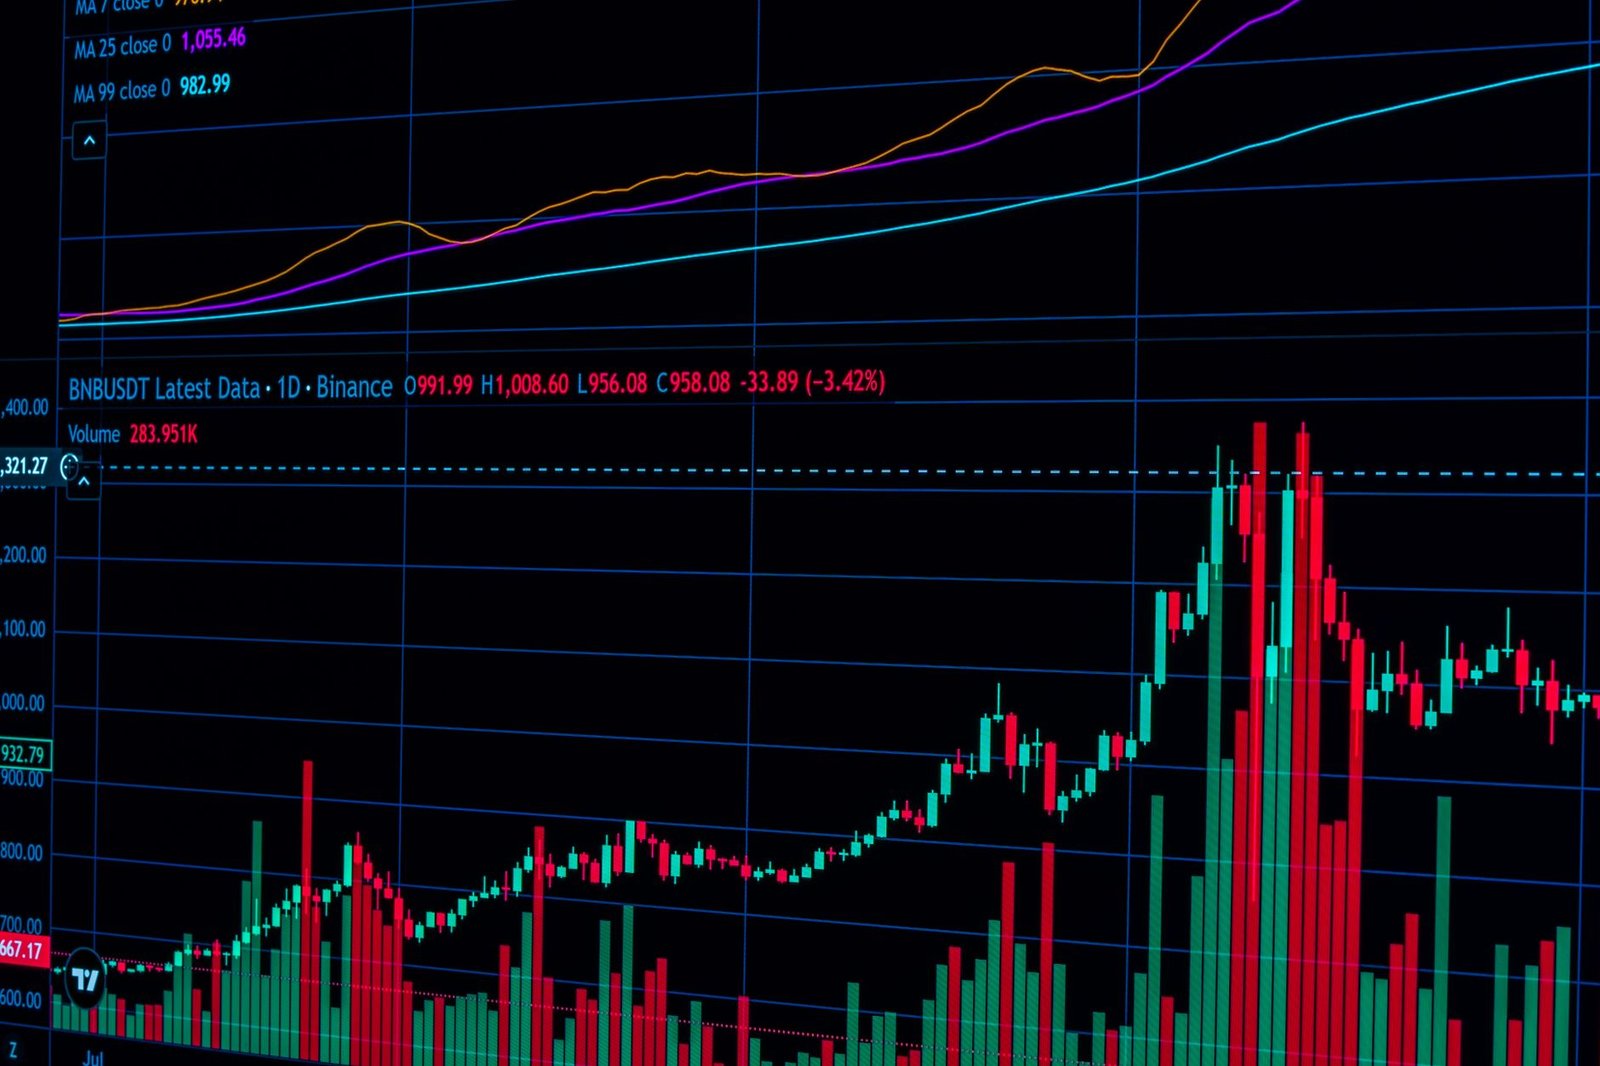
Volume is a critical confirmation tool for gap trading. A gap accompanied by unusually high volume suggests stronger conviction behind the price move, making continuation trades more probable. Conversely, a gap on low volume might indicate less conviction and a higher chance of the gap being filled.
Using Support and Resistance Levels
Price gaps can interact with established support and resistance levels. A gap that breaks through a significant resistance level (gap up) can signal a bullish continuation, while a gap below a support level (gap down) can indicate a bearish trend is starting. Traders often look for gaps that occur at or near these key levels.
Incorporating Moving Averages and Indicators
Technical indicators like Moving Averages, RSI, or MACD can help confirm the strength or weakness indicated by a price gap. For instance, a gap up near a resistance level might be less convincing if the stock is also below its key moving averages, suggesting a potential reversal.
How to Implement a Basic Gap Trading Strategy
- Scan for Gaps: Regularly scan the NSE and BSE markets at the opening bell for stocks exhibiting significant price gaps (typically 1% or more).
- Analyse Gap Type & Volume: Determine the type of gap (breakaway, runaway, exhaustion) and assess the volume accompanying the gap. High volume supports continuation.
- Check Support/Resistance: Identify relevant support and resistance levels near the gap. A gap beyond these levels can be a strong signal.
- Look for Confirmation: Use indicators like MACD or RSI to confirm the momentum suggested by the gap and volume.
- Enter the Trade: For a gap-up continuation, consider a long entry after the price consolidates slightly above the gap. For a gap-down continuation, consider a short entry after consolidation below the gap.
- Set Stop-Loss: Place a stop-loss below the low of the gap candle (for long trades) or above the high of the gap candle (for short trades) to manage risk.
- Define Profit Targets: Set profit targets based on previous resistance/support levels or by projecting the move based on the gap’s momentum. Consider partial profit booking.
- Monitor and Exit: Continuously monitor the trade and exit based on your profit targets or if the stop-loss is hit. Look for signs of the gap filling as a potential exit signal if the trade moves against you.

Gap and Go Strategy
The ‘Gap and Go’ strategy is a popular approach for trading gaps, particularly in volatile markets. It involves identifying a strong opening gap (usually a gap up) in a stock that shows potential for immediate upward momentum. Traders enter the trade very early, expecting the price to continue moving in the direction of the gap without significant retracement.
Entry and Exit for Gap and Go
Entry is typically made shortly after the market open, once the initial price action confirms the gap’s strength. The stop-loss is placed tightly, often just below the low of the opening few minutes or the gap’s low. Profit targets are usually set aggressively, aiming for a quick gain as the momentum carries the stock higher.
Gap Filling Strategy
The Gap Filling strategy operates on the principle that most price gaps eventually get filled. This means the price will move back to cover the area of the gap. Traders employing this strategy look for signs that a gap is likely to be filled, often entering a trade in the opposite direction of the gap (i.e., selling a gap up, buying a gap down) once confirmation signals appear.
When to Trade Gap Fills
This strategy is often more successful with common gaps or exhaustion gaps, which are more prone to filling. Traders look for price action that shows a loss of momentum in the direction of the gap, and subsequent price movement back towards the previous day’s closing price. Confirmation might come from reversal candlestick patterns or weakening volume.
Trading Gaps in Different Market Conditions
The effectiveness of gap trading strategies can vary depending on overall market conditions. In strongly trending markets, continuation gaps are more likely to occur and succeed. In choppy or range-bound markets, gaps might be less reliable and more prone to filling quickly. It’s essential for Indian traders to adapt their approach based on the prevailing market sentiment and volatility observed on exchanges like NSE and BSE.
Bullish Gaps
Bullish gaps (gap ups) can signal strong buying interest. A gap up occurring after a period of accumulation or at a breakout point is often a strong bullish signal, suggesting potential for further upside. Traders might look for opportunities to go long, especially if the gap is accompanied by high volume.
Bearish Gaps
Bearish gaps (gap downs) indicate strong selling pressure. A gap down from a resistance level or after negative news can signal the start of a downtrend. Traders might consider short-selling opportunities, looking for confirmation through volume and technical indicators.
Risks and Considerations in Gap Trading
While gap trading can be profitable, it carries significant risks. Gaps can reverse sharply, leading to rapid losses if not managed properly with strict stop-losses. False gaps, where the price quickly fills the gap and continues in the opposite direction, are also common. Understanding the psychology behind gaps and the impact of news events is crucial for success.
Frequently Asked Questions
What is the most common type of gap in Indian stock trading?
Common gaps are frequently observed but are often less predictable. Breakaway and Runaway gaps, while less frequent, tend to offer more reliable trading signals for trend continuation.
Should I always trade a gap in the direction it opens?
No, not always. While continuation strategies exist (like Gap and Go), many traders focus on gap filling, betting that the price will return to the previous day’s close. Analysis of volume and context is key.
How much volume is considered significant for gap confirmation?
Significant volume is typically much higher than the average daily volume. A common benchmark is 1.5 to 2 times the average daily volume, indicating strong conviction behind the price move.
When is the best time to enter a gap trade?
The best entry often occurs after the initial momentum settles slightly. Waiting for a small consolidation or pullback in the direction of the gap, with confirmation from indicators, can provide a better risk-reward entry point.
Can gap trading be done on options?
Yes, gap trading principles can be applied to options by observing the price action of the underlying asset. However, options trading involves additional complexities like time decay and volatility, making it riskier.
What is the role of SEBI regulations in gap trading?
SEBI regulations aim to ensure market integrity. While they don’t directly dictate gap trading strategies, they influence market behaviour through rules on disclosures, insider trading, and circuit breakers, which can create or affect price gaps.
Key Takeaways
- Price gaps in Indian markets are caused by overnight news, earnings, or global events impacting stock prices significantly.
- Understanding gap types (common, breakaway, runaway, exhaustion) is crucial for strategy selection.
- Volume analysis is vital; high volume accompanying a gap suggests stronger trend continuation potential.
- Support and resistance levels provide context for gap trades, indicating potential reversal or breakout points.
- Strategies like ‘Gap and Go’ aim for quick profits on strong momentum, while ‘Gap Filling’ bets on price retracement.
- Strict risk management, including stop-losses, is paramount due to the inherent volatility and potential for rapid reversals in gap trading.
Trading in securities is subject to market risks. Please read all related documents carefully before investing. Finovatives.com does not provide investment advice. Consult your SEBI-registered advisor before making any investment decisions.






 Finovatives