TL;DR: Moving average crossover strategies involve using two or more moving averages on a price chart to generate buy or sell signals when shorter-term averages cross over longer-term ones, helping Indian traders identify trend changes and potential profitable entry/exit points on NSE and BSE.
Key Stats at a Glance:
- Nifty 50 Index comprises 50 large-cap Indian stocks listed on the NSE.
- NSE daily trading volume often exceeds ₹50,000 crore.
- BSE Sensex has a history spanning over 35 years.
- Common moving average periods used by Indian traders: 10, 20, 50, 100, and 200 days.
- Over 7,000+ listed companies on Indian stock exchanges (NSE & BSE combined).
What is a Moving Average Crossover Strategy?
A moving average crossover strategy is a technical analysis technique where traders use the intersection of two or more moving averages (MAs) of different lengths to signal potential buying or selling opportunities in the stock market.
Understanding Moving Averages
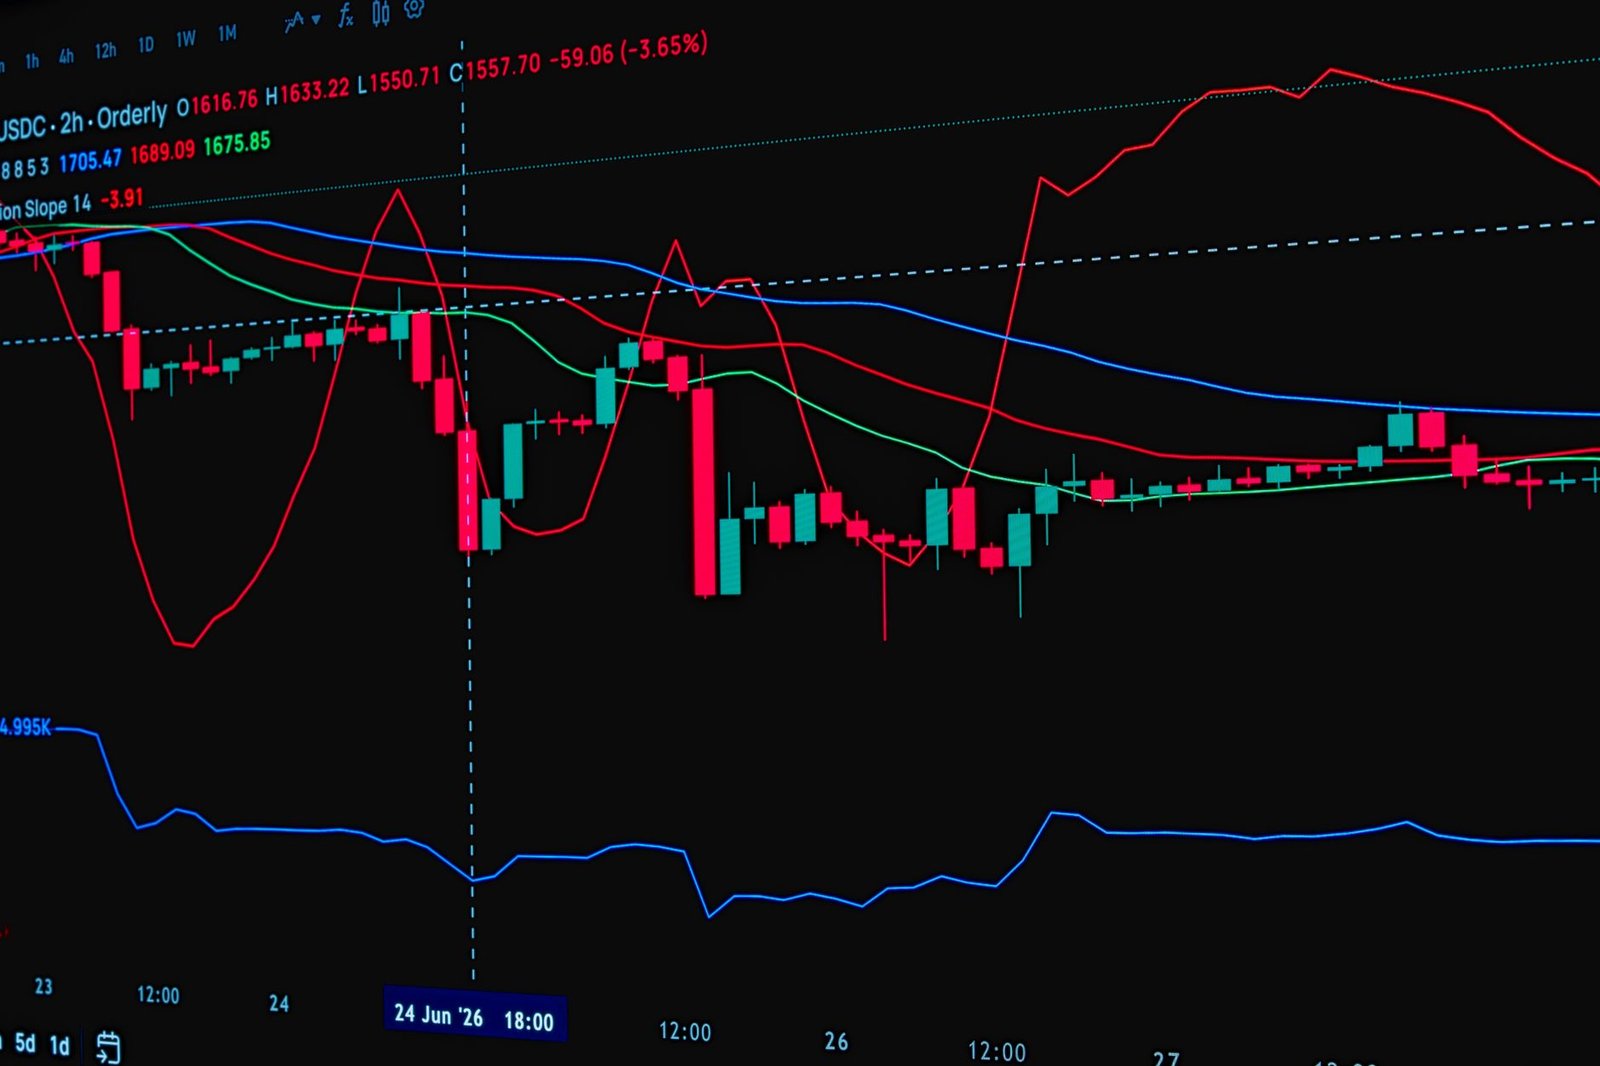
Moving averages smooth out price data by creating a constantly updated average price over a specific period. They help identify the direction of a trend and can act as support or resistance levels. The most common types used in Indian stock trading are the Simple Moving Average (SMA) and the Exponential Moving Average (EMA). SMAs give equal weight to all prices in the period, while EMAs give more weight to recent prices, making them more responsive to current price action.
The Power of Crossovers
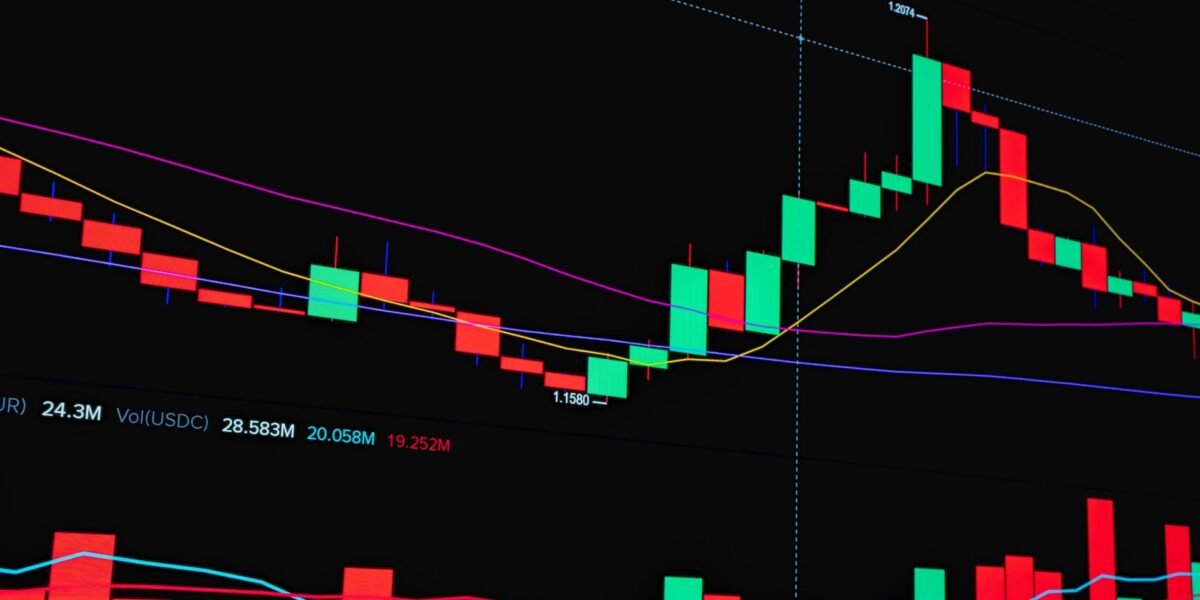
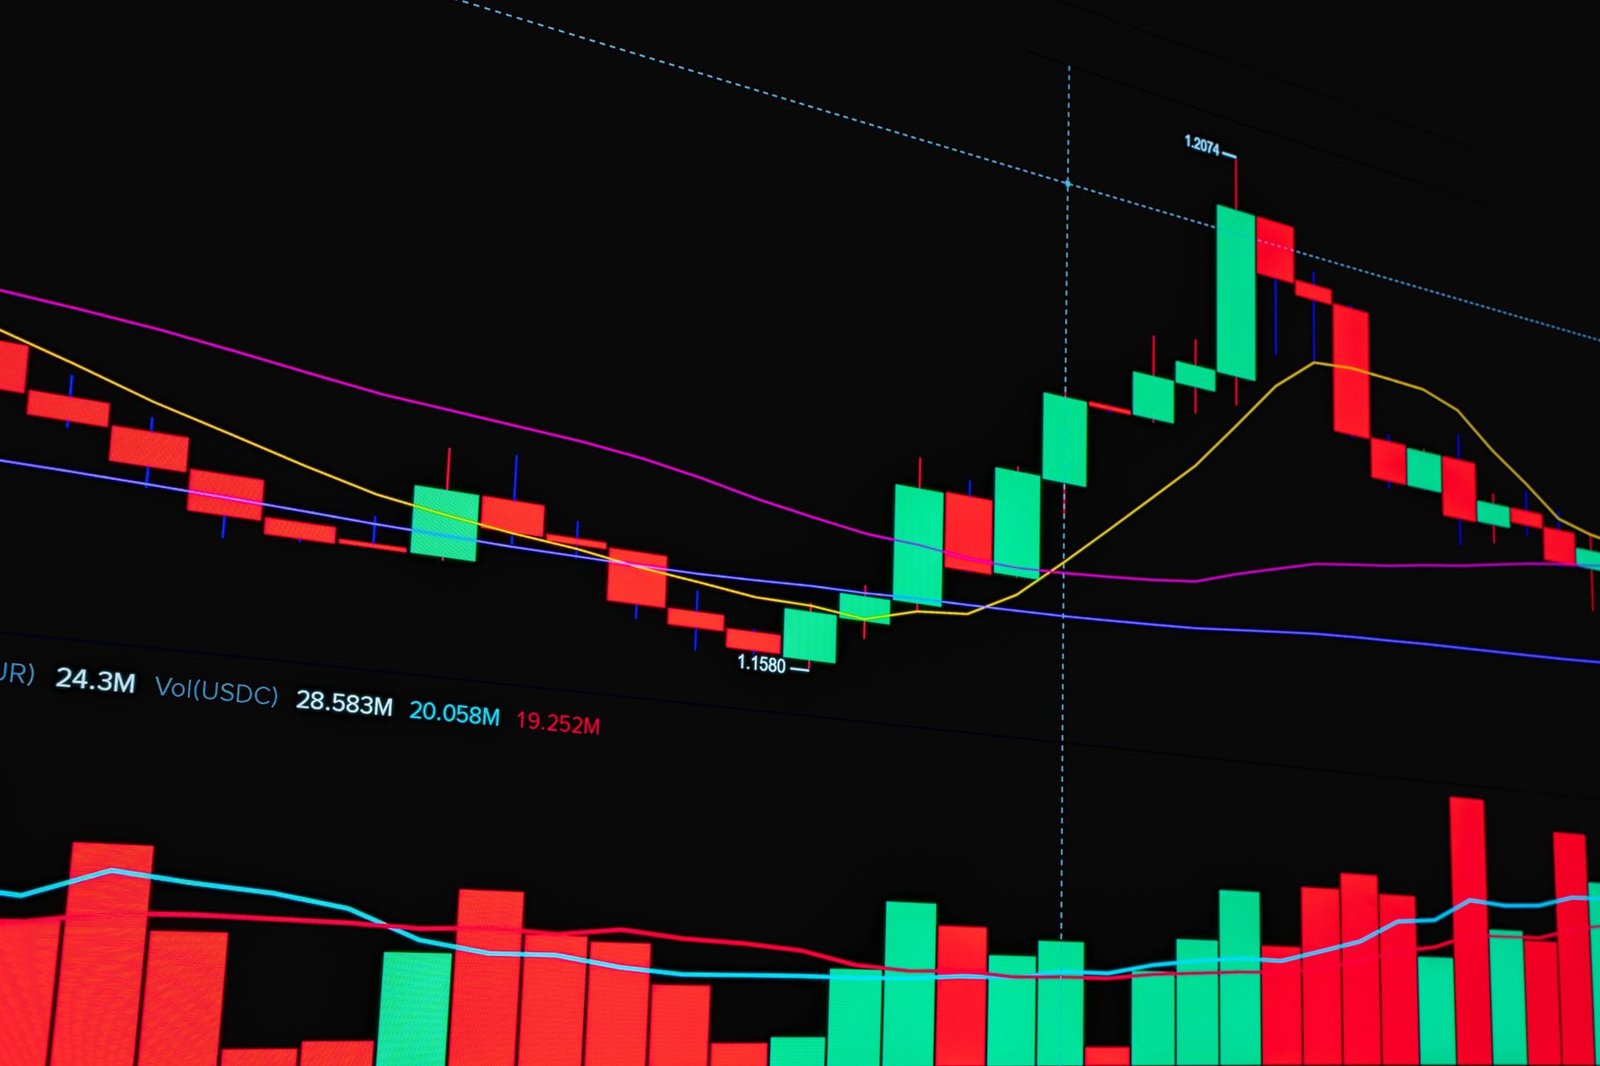
Crossovers occur when a shorter-term MA crosses above or below a longer-term MA. These crossovers are interpreted as signals: a shorter MA crossing above a longer MA suggests an upward trend is beginning (a potential buy signal), while a shorter MA crossing below a longer MA suggests a downward trend is starting (a potential sell signal).
Key Moving Average Combinations
Traders often experiment with different MA periods to find what works best for their trading style and the specific stock or index they are analysing. Popular combinations on NSE and BSE include:
- Short-term Crossovers: Often use 5, 10, or 20-day MAs. These are more sensitive to price changes and can generate more frequent signals, but also more false signals. Ideal for short-term traders.
- Medium-term Crossovers: Commonly use 20, 50, or 100-day MAs. These balance responsiveness with trend confirmation, suitable for swing traders.
- Long-term Crossovers: Frequently employ 50, 100, and 200-day MAs. The 50-day MA crossing the 200-day MA is a widely watched signal (a ‘golden cross’ for buy, ‘death cross’ for sell) and is often considered a strong indicator of a significant trend shift.
How Do Moving Average Crossovers Work for Indian Stocks?
Moving average crossovers work by filtering out short-term price noise and highlighting the underlying trend direction, providing traders with actionable signals for entering or exiting positions in Indian stocks.
Identifying Trend Direction
When a shorter-term MA rises above a longer-term MA, it implies that recent prices are, on average, higher than prices over the longer term. This suggests increasing buying pressure and a potential start of an uptrend. Conversely, when a shorter-term MA falls below a longer-term MA, it indicates that recent prices are, on average, lower than over the longer term, suggesting selling pressure and a potential downtrend.
Generating Buy Signals
A common buy signal is generated when a faster-moving average crosses above a slower-moving average. For instance, if the 50-day SMA crosses above the 200-day SMA, many traders consider this a strong bullish signal, indicating that the stock may be entering a significant upward trend. Shorter-term traders might use the 20-day MA crossing above the 50-day MA as an earlier, though potentially less reliable, buy signal.
Generating Sell Signals
The inverse logic applies to sell signals. When a faster MA crosses below a slower MA, it suggests a potential downtrend. A classic bearish signal occurs when the 50-day SMA crosses below the 200-day SMA (a death cross). Shorter-term traders might look for the 20-day MA crossing below the 50-day MA as an indication to exit a long position or consider a short sale.
Confirmation and Filtering
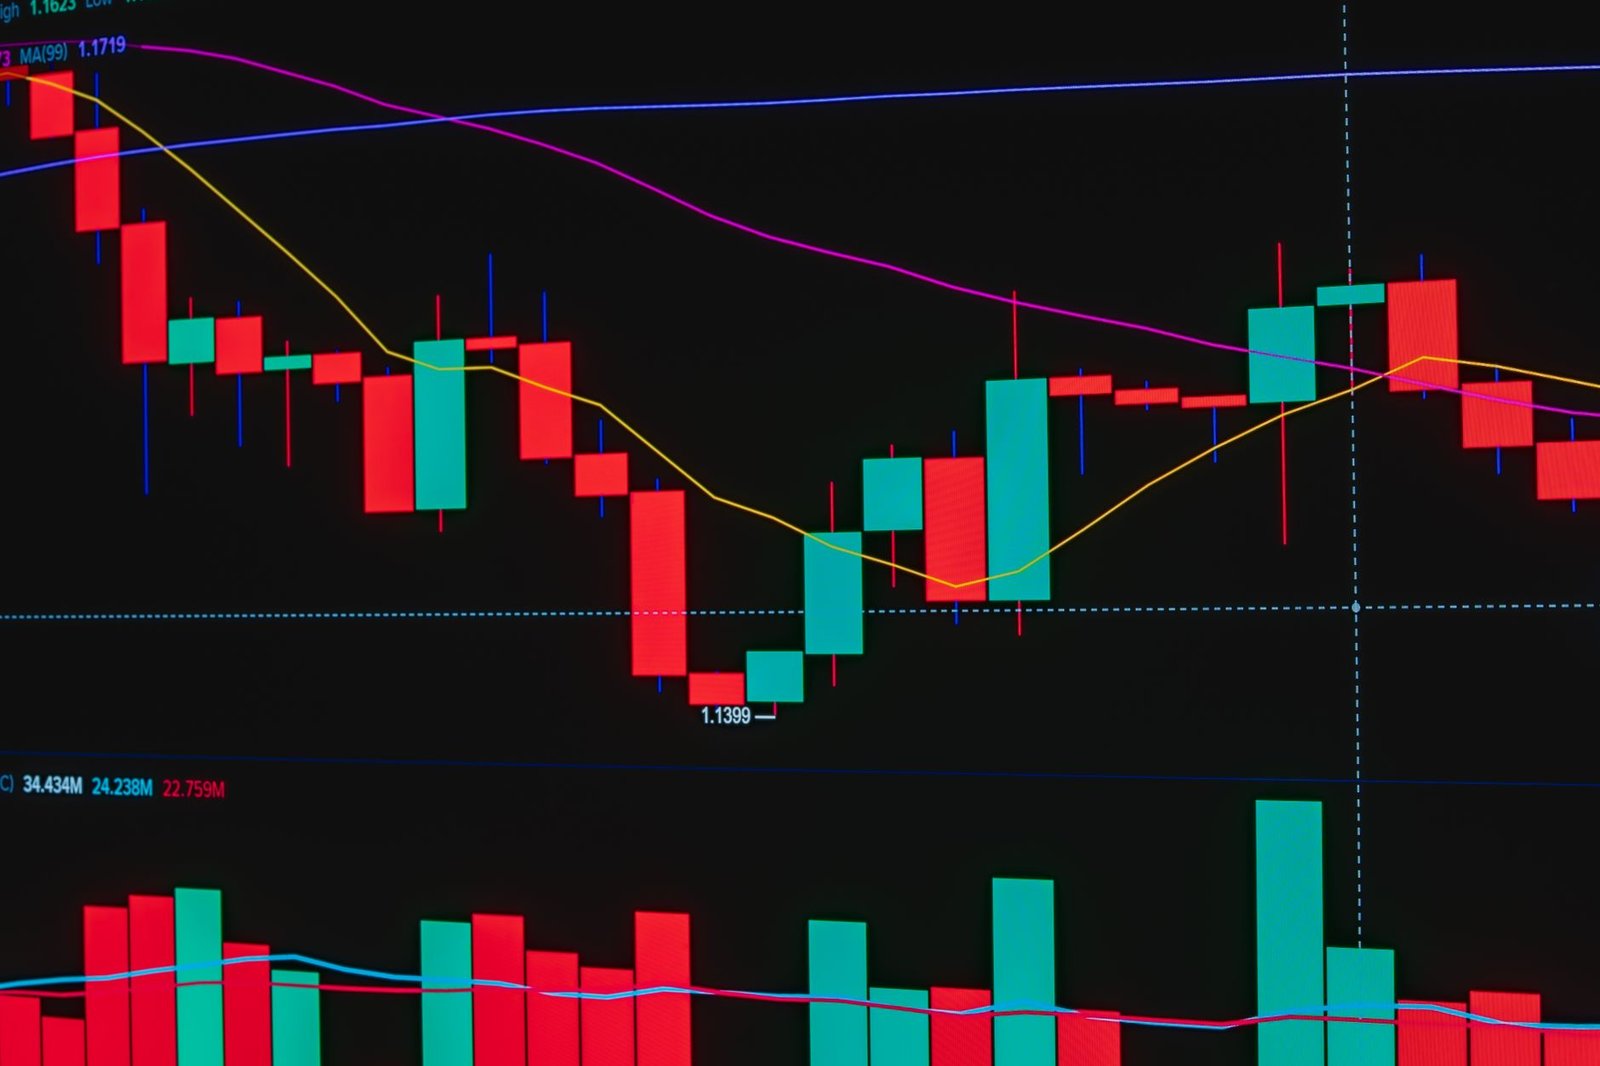
While crossovers are powerful, they are not infallible. It’s crucial to use them in conjunction with other technical indicators or chart patterns for confirmation. For example, confirming a buy signal with a breakout above a resistance level or an RSI moving out of oversold territory can increase the probability of success. Relying solely on a single crossover can lead to premature entries or exits.
Popular Moving Average Crossover Strategies
Several popular strategies leverage moving average crossovers, each suited to different trading styles and market conditions on NSE and BSE.
The Golden Cross and Death Cross
This strategy relies on the intersection of the 50-day and 200-day MAs. A Golden Cross occurs when the 50-day MA crosses above the 200-day MA, signalling a long-term bullish trend. A Death Cross occurs when the 50-day MA crosses below the 200-day MA, signalling a long-term bearish trend. These signals are considered significant but often occur after a substantial price move has already begun.
The 20/50 Crossover Strategy
This is a more frequently observed crossover, often used by swing traders. When the 20-day MA crosses above the 50-day MA, it’s seen as a bullish signal for a shorter to medium-term uptrend. When the 20-day MA crosses below the 50-day MA, it’s a bearish signal for a potential downtrend. This strategy offers earlier signals than the 50/200 crossover but can be prone to more whipsaws in sideways markets.
Triple Moving Average Strategy
This advanced strategy uses three MAs – typically a short-term, a medium-term, and a long-term MA (e.g., 10-day, 50-day, 200-day). A buy signal is generated when the shortest MA crosses above the medium MA, AND the medium MA is already above the longest MA. This helps to filter out weaker signals. A sell signal is generated when the shortest MA crosses below the medium MA, AND the medium MA is already below the longest MA.
Using EMAs vs. SMAs
Choosing between Exponential Moving Averages (EMAs) and Simple Moving Averages (SMAs) impacts the sensitivity of your signals. EMAs react faster to recent price changes, making them useful for capturing quicker moves. SMAs provide a smoother line and are less susceptible to short-term noise, making them better for identifying longer-term trends. Many traders use a combination, perhaps an EMA for entry signals and an SMA for trend confirmation.
How to Implement Moving Average Crossover Strategies
Successfully implementing moving average crossover strategies requires a systematic approach, from selecting the right indicators to managing risk.
- Choose Your Trading Platform: Select a reliable charting platform that offers various technical indicators, including SMAs and EMAs. Finovatives.com provides advanced TradingView indicators for Indian markets.
- Select Moving Average Periods: Decide on the lengths of the MAs you will use based on your trading style and the asset’s volatility. Common starting points are 20/50 for swing trading or 50/200 for longer-term trends.
- Identify Crossover Signals: Monitor your charts for instances where the shorter-term MA crosses the longer-term MA. A bullish crossover occurs when the shorter MA moves above the longer MA; a bearish crossover is when it moves below.
- Seek Confirmation: Do not trade solely on a crossover signal. Look for confirmation from other indicators (like RSI, MACD) or chart patterns (like support/resistance breaks, trendline bounces).
- Define Entry and Exit Points: Plan your entry price just after the confirmed crossover. Set a stop-loss order below a recent low (for buys) or above a recent high (for sells) to manage risk. Define your profit targets based on support/resistance levels or a risk-reward ratio.
- Manage Risk: Determine the appropriate position size based on your stop-loss level and your overall risk tolerance (e.g., risking no more than 1-2% of your capital per trade).
- Backtest and Review: Before trading with real money, backtest your chosen strategy on historical data for Indian stocks. Regularly review your trades to identify what worked and what didn’t, and adjust your strategy accordingly. Consider trying a free trial of our tools to practice.
Choosing the Right Timeframe
The effectiveness of any moving average strategy heavily depends on the timeframe you are analysing. Shorter timeframes (e.g., 15-minute, 1-hour charts) are suitable for day traders seeking quick profits, but they generate more frequent and often less reliable signals. Longer timeframes (e.g., daily, weekly charts) are better for swing and position traders, as they filter out noise and highlight more significant trends. For Indian stocks, daily charts are a popular choice for analysing medium to long-term trends.
Integrating with Other Indicators
To enhance the accuracy of moving average crossover signals, traders often combine them with other technical indicators. The Relative Strength Index (RSI) can help identify overbought or oversold conditions, adding context to crossover signals. The Moving Average Convergence Divergence (MACD) indicator, which itself is based on moving averages, can provide additional trend and momentum confirmation. Volume analysis is also critical; a crossover accompanied by increasing volume typically lends more credibility to the signal.
Risks and Limitations of Crossover Strategies
While powerful, moving average crossover strategies are not foolproof and come with inherent risks that Indian traders must understand.
Whipsaws in Sideways Markets
The most significant drawback of moving average crossovers is their tendency to generate false signals, known as ‘whipsaws’, in non-trending or sideways markets. When prices are consolidating, the shorter-term and longer-term MAs can cross back and forth frequently, leading to multiple losing trades if a strict trading rule isn’t followed.
Lagging Nature of Indicators
Moving averages are lagging indicators, meaning they are based on past price data. Consequently, crossover signals often occur after a significant portion of the price move has already happened. This means traders might miss the initial part of a trend or enter trades at less optimal prices.
Over-Optimization and Curve Fitting
Traders can sometimes fall into the trap of over-optimizing their MA periods to fit past data perfectly. This ‘curve fitting’ can lead to a strategy that performed well historically but fails in future live trading because market conditions have changed.
Dependence on Specific Stocks/Indices
A particular set of MA periods that works well for one stock or index might not perform as effectively for another due to differences in volatility, trading volume, and market behaviour. Continuous monitoring and adaptation are necessary.
Frequently Asked Questions
What is the best moving average crossover strategy for Indian stocks?
There isn’t a single ‘best’ strategy. The 50/200 crossover is good for long-term trends, while the 20/50 is popular for swing trading. The ideal choice depends on your trading style, risk tolerance, and the specific stock or timeframe.
When should I buy based on a moving average crossover?
A buy signal is typically generated when a shorter-term moving average crosses above a longer-term moving average, especially if confirmed by other indicators or chart patterns suggesting an uptrend.
When should I sell based on a moving average crossover?
A sell signal is usually generated when a shorter-term moving average crosses below a longer-term moving average. This suggests a potential downtrend or a weakening of an existing uptrend.
Can moving average crossovers predict future prices?
No, moving average crossovers are based on past price data and are lagging indicators. They help identify potential trends and signals but do not guarantee future price movements.
How can I avoid false signals (whipsaws)?
To avoid whipsaws, use crossovers in conjunction with other indicators like RSI or MACD for confirmation. Trading only in clearly trending markets and avoiding choppy, sideways conditions can also help reduce false signals.
What are the most common MA periods used in India?
The most common periods for moving averages in India include 10, 20, 50, 100, and 200 days. Shorter periods like 10 or 20 are used for short-term signals, while 50 and 200 are used for longer-term trend identification.
Key Takeaways
- Moving average crossovers provide clear buy/sell signals by showing when short-term trends intersect long-term trends.
- The 50-day and 200-day MA crossover (Golden Cross/Death Cross) signals significant long-term trend shifts.
- The 20-day and 50-day MA crossover offers more frequent signals suitable for swing trading but can be prone to whipsaws.
- EMAs are more responsive to recent price action than SMAs.
- Always confirm crossover signals with other technical indicators and manage risk diligently.
- Sideways markets are the biggest challenge for crossover strategies, often leading to false signals.
- Backtesting and continuous review are crucial for refining any moving average strategy.
Disclaimer: Trading in the Indian stock market involves significant risk and can lead to losses. All information provided is for educational purposes only and does not constitute financial advice. Consult with a qualified financial advisor before making any investment decisions.





 Finovatives