TL;DR: Effective swing trading strategies for NSE stocks involve identifying trending markets, using technical indicators like Moving Averages and MACD for entry/exit signals, managing risk with stop-losses, and holding positions for days to weeks to capture medium-term price swings.
Key Stats at a Glance:
- NSE average daily turnover: Over ₹1.1 lakh crore (as of recent data)
- Nifty 50 1-year volatility: Approximately 10-15% (varies significantly)
- Typical swing trade holding period: 3 days to 3 weeks
- Average success rate for well-executed swing trades: 50-70%
- Key NSE swing trading sessions: Morning (9:15 AM – 11:00 AM IST), Afternoon (1:30 PM – 3:30 PM IST)
What is Swing Trading in the Indian Stock Market?
Swing trading is a strategy focused on capturing a portion of a price move (a “swing”) that is expected to last for a few days to several weeks. Traders using this approach aim to profit from market fluctuations by identifying short-to-medium term trends, avoiding the constant monitoring required for day trading and the longer commitment of position trading.
The Indian stock market, with its dynamic price action across NSE and BSE, presents numerous opportunities for swing traders. Understanding the nuances of market cycles, news events, and technical patterns is crucial for success. Unlike day trading, where profits are sought from minute price changes within a single day, swing trading allows for greater flexibility and a less demanding schedule, making it accessible to many Indian retail traders who might have other professional commitments.
The Psychology of Swing Trading
Swing trading demands a balanced psychological approach. Traders must develop patience to wait for the right setups, discipline to adhere to their trading plan and stop-loss orders, and the ability to manage emotions like fear and greed when facing significant price movements. Overcoming the urge to exit a profitable trade too early or hold onto a losing one for too long is paramount. The Indian market’s inherent volatility can test even experienced traders, highlighting the need for robust risk management and a consistent trading psychology.
Distinguishing Swing Trading from Day Trading and Position Trading
Swing trading occupies a middle ground in terms of timeframe. Day trading involves opening and closing positions within the same trading day, aiming to profit from small price changes and avoiding overnight risk. Position trading, conversely, focuses on long-term trends that can last for months or even years, often utilizing fundamental analysis alongside technicals. Swing trading, with its typical holding period of days to weeks, allows traders to capture more significant price swings than day traders but requires less capital commitment and patience than position trading.
How Do You Identify a Good Swing Trade Setup?
Identifying a good swing trade setup involves analysing price action, chart patterns, and key technical indicators to spot potential short-to-medium term trends. The goal is to enter a trade when a trend is likely to continue for at least a few days, and exit before the trend reverses.
Utilising Support and Resistance Levels
Support and resistance levels are fundamental to swing trading. Support is a price level where a downtrend is expected to pause due to a rise in demand, while resistance is a price level where an uptrend is expected to pause due to a rise in supply. Swing traders often look to buy near strong support levels anticipating an upward bounce and sell or short near strong resistance levels anticipating a downward move. Breakouts above resistance or below support can also signal the start of a new swing.
Recognising Chart Patterns
Certain chart patterns are particularly useful for swing traders as they often precede significant price movements. These include continuation patterns like flags, pennants, and symmetrical triangles, which suggest the existing trend is likely to resume, and reversal patterns like head and shoulders, double tops, and double bottoms, which signal a potential trend change. Identifying these patterns on daily or 4-hour charts can provide high-probability entry points.
Employing Technical Indicators for Confirmation
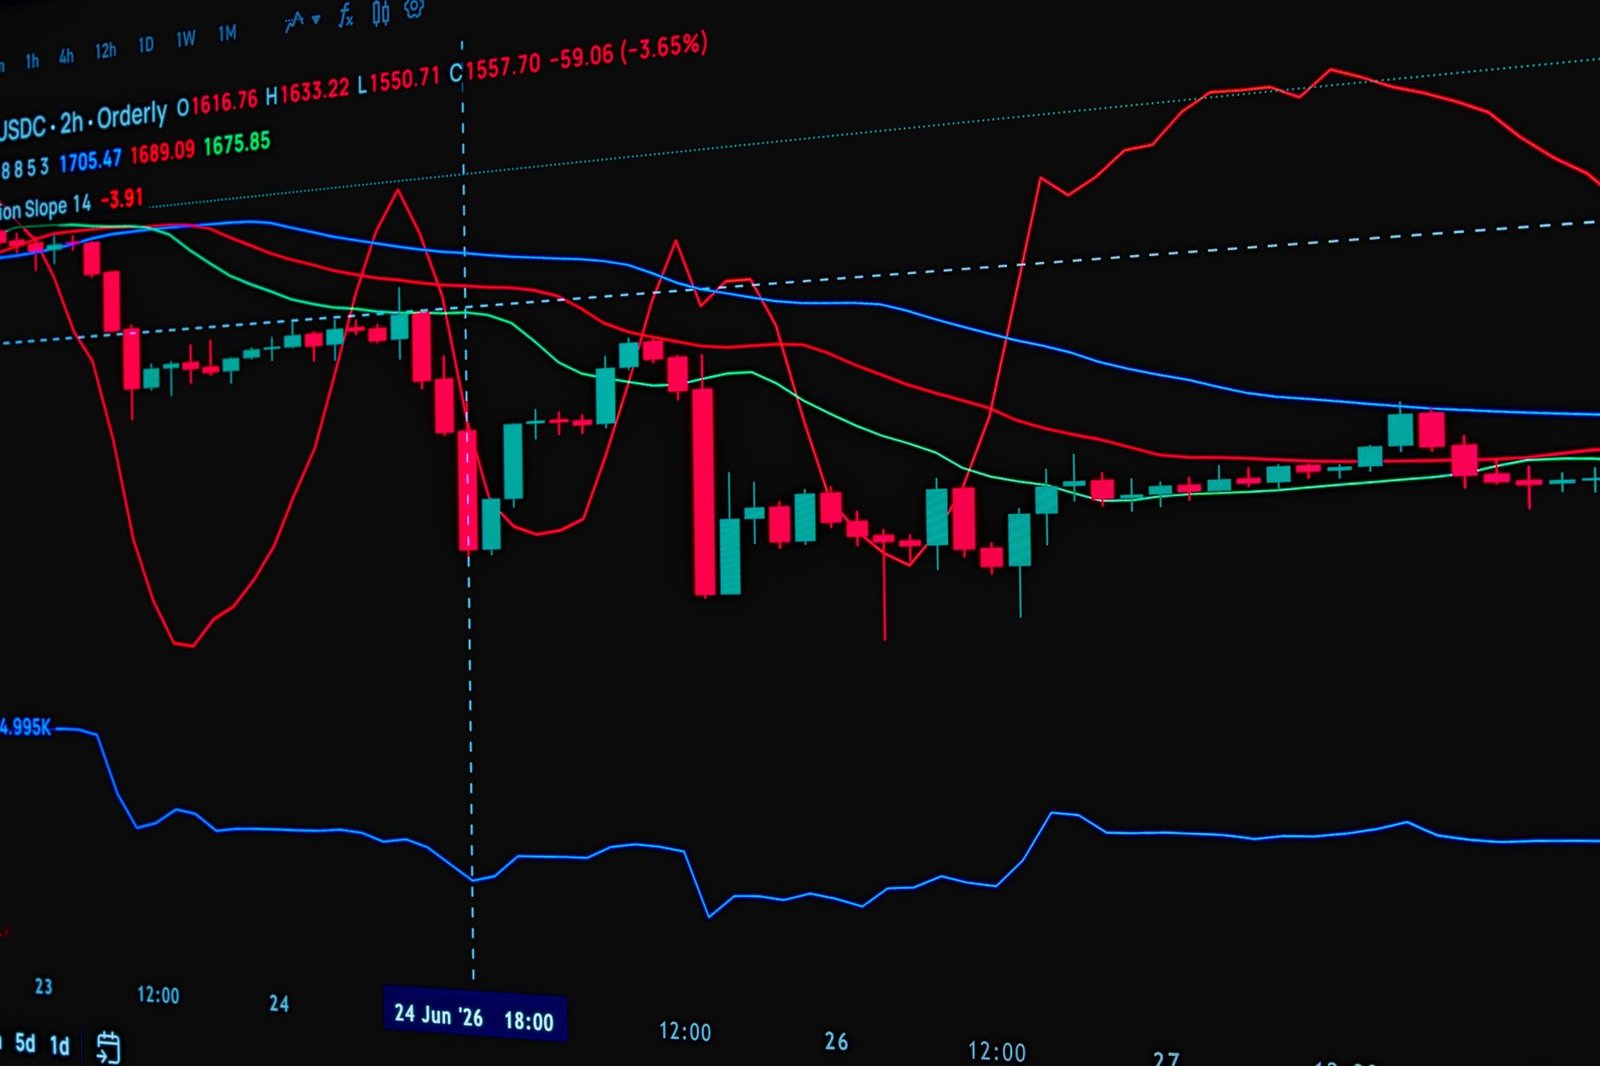
While chart patterns and price action provide the foundation, technical indicators offer further confirmation. Moving Averages (like the 50-day and 200-day MA) can help identify the trend direction and potential support/resistance zones. Oscillators like the Relative Strength Index (RSI) and Stochastic Oscillator can signal overbought or oversold conditions, indicating potential turning points. The Moving Average Convergence Divergence (MACD) is useful for identifying momentum shifts and potential trend reversals. For instance, a bullish crossover on the MACD below the zero line in an uptrending stock can be a strong buy signal for a swing trader.
Example: Moving Average Crossover Strategy
A common strategy involves using two Moving Averages, such as the 20-period and 50-period EMAs on a daily chart. A buy signal is generated when the shorter-term EMA (20) crosses above the longer-term EMA (50), and a sell signal occurs when the 20-EMA crosses below the 50-EMA. This strategy works best in trending markets and often requires additional confirmation from other indicators or price action.
Volume Analysis
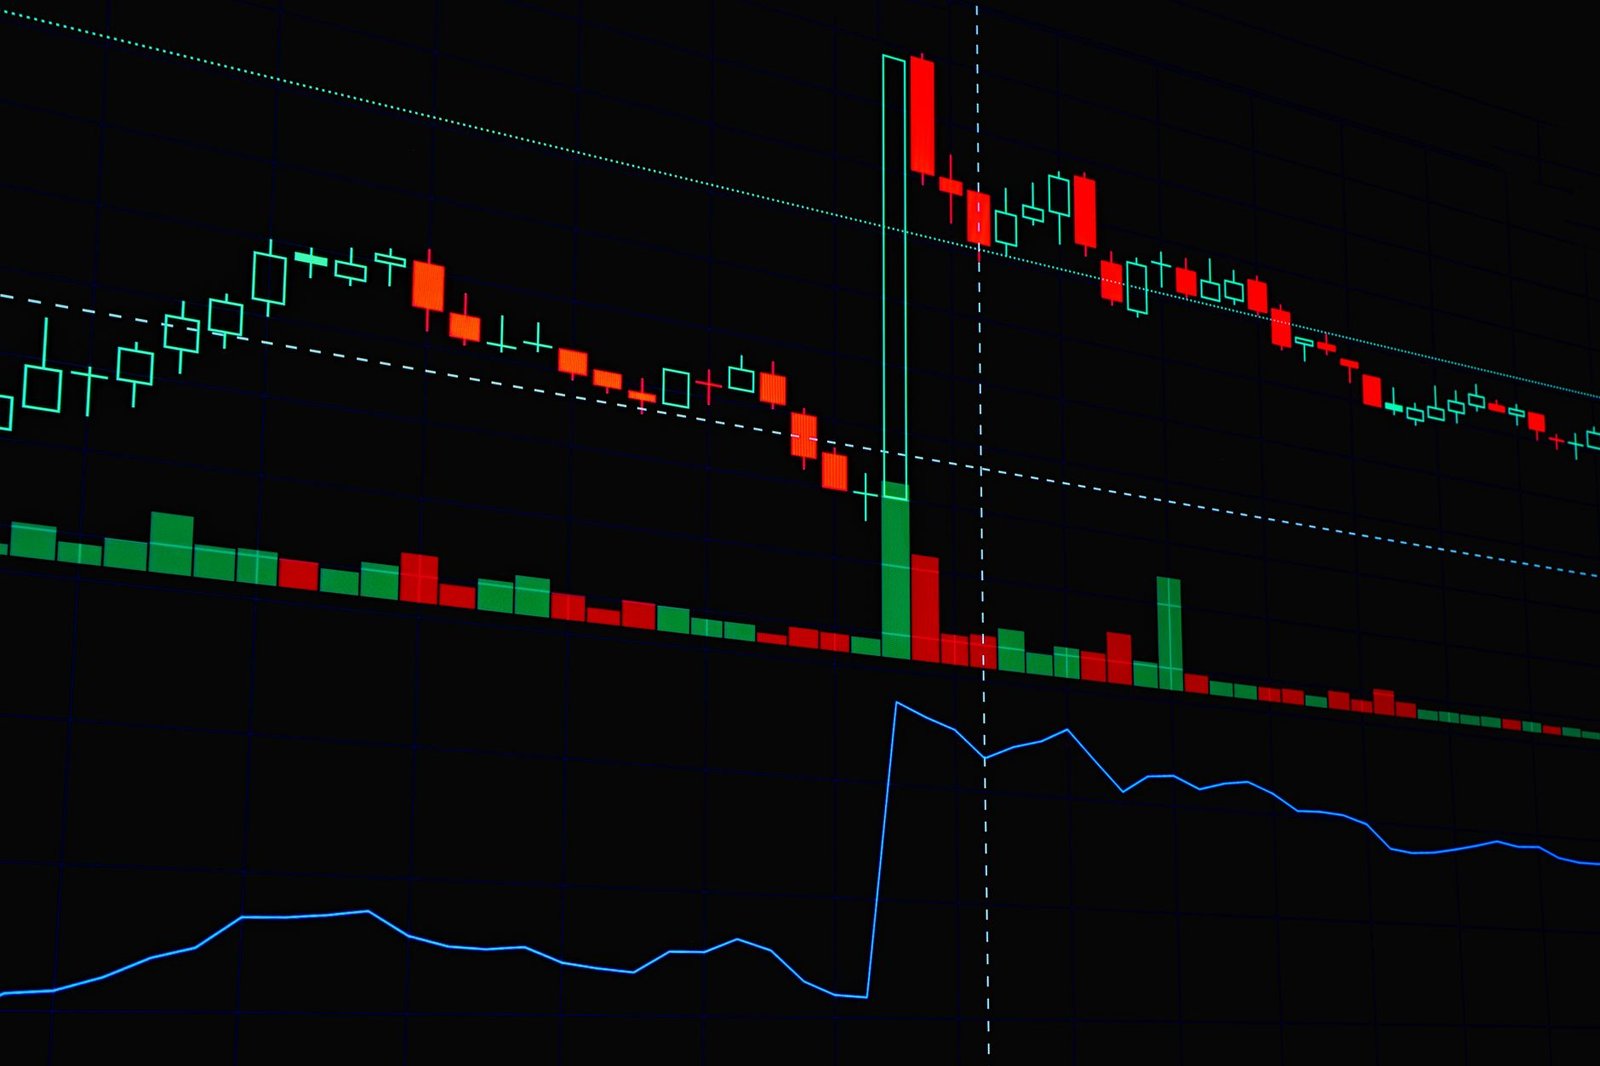
Volume analysis is critical for confirming the strength of a price move. A price breakout or trend continuation accompanied by high trading volume suggests strong conviction behind the move, increasing the probability of success for a swing trade. Conversely, a move on low volume may be less reliable and could indicate a false breakout or an impending reversal.
Popular Swing Trading Strategies for NSE
Several well-defined swing trading strategies can be effectively applied to NSE stocks, leveraging their price action and volatility. These strategies often combine different technical tools to pinpoint optimal entry and exit points.
1. Moving Average Crossover Strategy
This strategy uses two or more moving averages (e.g., 20-day EMA and 50-day EMA) to generate buy and sell signals. A buy signal occurs when the shorter-term MA crosses above the longer-term MA, indicating upward momentum. A sell signal occurs when the shorter-term MA crosses below the longer-term MA, suggesting downward momentum. It’s crucial to use this in conjunction with trend identification; buy signals are more reliable in an uptrend, and sell signals in a downtrend.
2. MACD Crossover Strategy
The Moving Average Convergence Divergence (MACD) is a momentum indicator that reflects the relationship between two exponential moving averages. A bullish signal is generated when the MACD line crosses above the signal line, particularly when both are below the zero line or moving up from negative territory. A bearish signal occurs when the MACD line crosses below the signal line. Divergence between the MACD and price action can also signal potential trend reversals, offering valuable insights for swing traders.
3. RSI Overbought/Oversold Strategy
The Relative Strength Index (RSI) measures the magnitude of recent price changes to evaluate overbought or oversold conditions. For swing trading, traders look for an RSI reading above 70 to indicate overbought conditions (potential for a price pullback or reversal downwards) and below 30 for oversold conditions (potential for a price bounce or reversal upwards). Entries are often taken on confirmation from price action or other indicators, as RSI alone can remain in overbought/oversold territory for extended periods in strong trends.
4. Breakout Trading Strategy
This strategy involves entering a trade when the price breaks out of a defined range, such as a consolidation pattern (e.g., a rectangle or triangle) or a significant support/resistance level. A bullish breakout occurs when the price moves decisively above resistance, and a bearish breakout occurs when it moves decisively below support. High volume accompanying the breakout adds significant confirmation. Traders often enter on the breakout candle or a subsequent retest of the broken level.
5. Trend Following with Support and Resistance
This is a robust strategy that combines trend identification with key price levels. Traders first identify the prevailing trend (uptrend or downtrend) using tools like trendlines or moving averages. In an uptrend, they look to buy when the price pulls back to a key support level or a rising moving average. In a downtrend, they look to sell or short when the price rallies to a key resistance level or a falling moving average. This approach aims to enter trades in the direction of the dominant trend at favourable price points.
How to Implement a Swing Trading Plan for NSE Stocks
A well-structured swing trading plan is essential for consistent profitability and risk management in the volatile NSE market. It provides a roadmap for decision-making and helps prevent impulsive trades.
- Define Your Trading Capital: Determine the amount of capital you are willing to allocate specifically for swing trading. Never risk more than you can afford to lose.
- Choose Your Market & Stocks: Select NSE stocks that exhibit good liquidity and volatility suitable for swing trading. Focus on specific sectors or indices like Nifty 50 or Nifty Bank components.
- Select Your Strategy: Choose one or two swing trading strategies that align with your risk tolerance and market view. Practice them thoroughly, perhaps using a TradingView indicator setup.
- Set Entry Criteria: Clearly define the specific technical conditions (e.g., moving average crossover, pattern breakout with volume) that will trigger an entry into a trade.
- Determine Exit Criteria (Profit Targets): Establish realistic profit targets based on previous resistance levels, chart patterns, or a fixed risk-reward ratio (e.g., 1:2 or 1:3).
- Implement Strict Stop-Loss Orders: This is non-negotiable. Define your maximum acceptable loss per trade, typically placed below a support level for long positions or above a resistance level for short positions.
- Manage Open Positions: Monitor your trades without over-trading. Consider trailing your stop-loss as the trade moves in your favour to lock in profits.
- Review and Refine: Regularly analyse your trading performance. Keep a trading journal to identify what worked, what didn’t, and make necessary adjustments to your strategy and plan.

Managing Risk in Swing Trading
Risk management is paramount for survival and success in swing trading. Without it, even the best strategies can lead to significant losses. For Indian traders, understanding the specific risks associated with the NSE market is crucial.
The Importance of Stop-Loss Orders
A stop-loss order is an instruction to your broker to automatically close a losing trade at a specific price level. For swing traders, this is the primary tool for limiting potential losses on any single trade. It prevents emotional decision-making during sharp price movements and ensures that a trade doesn’t result in a loss exceeding the trader’s predetermined limit. Typically, a stop-loss is placed just below a key support level for a long trade or just above a key resistance level for a short trade.
Position Sizing Techniques
Position sizing determines how much capital to allocate to a single trade. It’s not about risking a fixed amount of money per trade but rather risking a fixed percentage of your trading capital. A common rule is to risk no more than 1-2% of your total trading account on any single trade. This ensures that a few losing trades do not wipe out a significant portion of your capital. Calculating position size based on your stop-loss distance and your risk percentage is a key aspect of sound risk management.
Diversification (Within Swing Trading)
While swing trading often focuses on individual stock opportunities, some level of diversification can be beneficial. This might involve trading a basket of non-correlated stocks or focusing on different sectors to avoid being overly exposed to a single market event. However, excessive diversification can dilute focus and make it harder to manage trades effectively. The key is to maintain concentration on high-conviction setups while mitigating sector-specific or stock-specific risks.
Understanding Market Volatility and News Impact
The NSE experiences periods of high and low volatility. Major economic news, corporate earnings announcements, and geopolitical events can cause rapid and unpredictable price swings. Swing traders must be aware of these potential catalysts and may choose to reduce their exposure or avoid trading around significant news events. Understanding the impact of such events is a crucial aspect of risk management, particularly for strategies reliant on technical patterns.
Frequently Asked Questions
What is the best time frame for swing trading NSE stocks?
The most common time frames for swing trading NSE stocks are the daily (1D) and 4-hour (4H) charts, allowing capture of price swings lasting several days to a couple of weeks.
Which technical indicators are most useful for swing trading?
Key indicators include Moving Averages (MA), MACD, RSI, Stochastic Oscillator, and Bollinger Bands. Volume analysis is also critical for confirming trade setups.
How much capital is typically needed for swing trading in India?
While there’s no minimum, realistically, traders need enough capital to meet margin requirements and absorb potential losses. Starting with ₹25,000-₹50,000 allows for basic position sizing and diversification.
Can swing trading be done with a small capital?
Yes, with disciplined risk management and careful position sizing, even small capital can be used. Focusing on low-priced, liquid stocks and risking a very small percentage per trade is key.
What is the biggest mistake new swing traders make?
The most common mistakes include inadequate risk management (no stop-losses, over-leveraging), emotional trading, lack of a defined strategy, and chasing profits without a plan.
Is swing trading profitable in sideways markets?
Swing trading generally performs best in trending markets. While some strategies can adapt to range-bound markets (e.g., buying at support and selling at resistance), overall profitability may be lower compared to trending conditions.
Key Takeaways
- Swing trading aims to profit from medium-term price movements (days to weeks) in NSE stocks.
- Effective strategies rely on identifying trends, using technical analysis for entry/exit, and managing risk.
- Key tools include Moving Averages, MACD, RSI, support/resistance levels, and chart patterns.
- A strict trading plan with defined entry/exit rules and stop-loss orders is essential.
- Proper position sizing and risk management are crucial for capital preservation.
- Discipline and emotional control are vital for consistent success in swing trading.
Investing in the stock market involves inherent risks, and past performance is not indicative of future results. Always conduct thorough research and consider consulting a SEBI-registered investment advisor before making any investment decisions.






 Finovatives