

TL;DR: Analyzing the Indian stock market like a pro involves a dual approach of fundamental analysis (company health, economics) and technical analysis (price charts, patterns), coupled with understanding market sentiment and macro trends for informed investment decisions.
Key Stats at a Glance:
- Nifty 50 index comprises 50 of the largest Indian companies by market capitalisation.
- BSE Sensex has 30 constituent stocks, representing the benchmark Indian equity market.
- India’s equity market saw a significant surge in retail investor participation post-2020.
- Average daily trading volume on NSE and BSE combined exceeds ₹80,000 crore.
- Over 5,000 companies are listed across the NSE and BSE main boards.
What is Fundamental Analysis for the Indian Market?
Fundamental analysis for the Indian market involves evaluating a company’s intrinsic value by examining its financial health, management quality, industry position, and broader economic conditions relevant to India.
Understanding Financial Statements
Delving into a company’s financial statements is the bedrock of fundamental analysis. Key documents include the balance sheet, income statement, and cash flow statement. For Indian companies, paying close attention to quarterly results announced to the exchanges (NSE/BSE) is crucial. Look for consistent revenue growth, healthy profit margins, manageable debt levels (debt-to-equity ratio), and positive cash flow from operations. For instance, a rising net profit margin over several quarters indicates improving efficiency and pricing power, a strong positive sign.
Economic Indicators and Their Impact
The Indian economy’s performance significantly influences stock market movements. Key indicators to monitor include Gross Domestic Product (GDP) growth rate, inflation (Consumer Price Index – CPI), interest rates set by the Reserve Bank of India (RBI), and industrial production. A robust GDP growth signals economic expansion, typically boosting corporate earnings and investor confidence. Conversely, high inflation or rising interest rates can dampen market sentiment and increase borrowing costs for companies. For example, an RBI repo rate hike often leads to a cautious market as borrowing becomes more expensive for businesses and consumers.
Industry and Sector Analysis
Understanding the specific industry and sector a company operates in is vital. India’s diverse economy features sectors like IT, pharmaceuticals, banking, manufacturing, and commodities. Analyze the growth prospects, competitive landscape, regulatory environment, and technological disruptions affecting each sector. For example, government initiatives like ‘Make in India’ can significantly boost manufacturing and industrial sectors.
Valuation Metrics
After assessing a company’s financial health and prospects, valuation metrics help determine if its stock is fairly priced. Common metrics include the Price-to-Earnings (P/E) ratio, Price-to-Book (P/B) ratio, and Dividend Yield. Comparing a company’s P/E ratio to its industry average and historical levels provides context. A P/E ratio significantly higher than its peers might suggest overvaluation, assuming similar growth prospects. Conversely, a lower P/E could indicate an undervalued gem or underlying problems.
What is Technical Analysis and How is it Used in India?
Technical analysis is a trading discipline employed to evaluate securities by analyzing statistics generated by market activity, such as past prices and volume, to forecast future price movements.
Chart Patterns and Trends
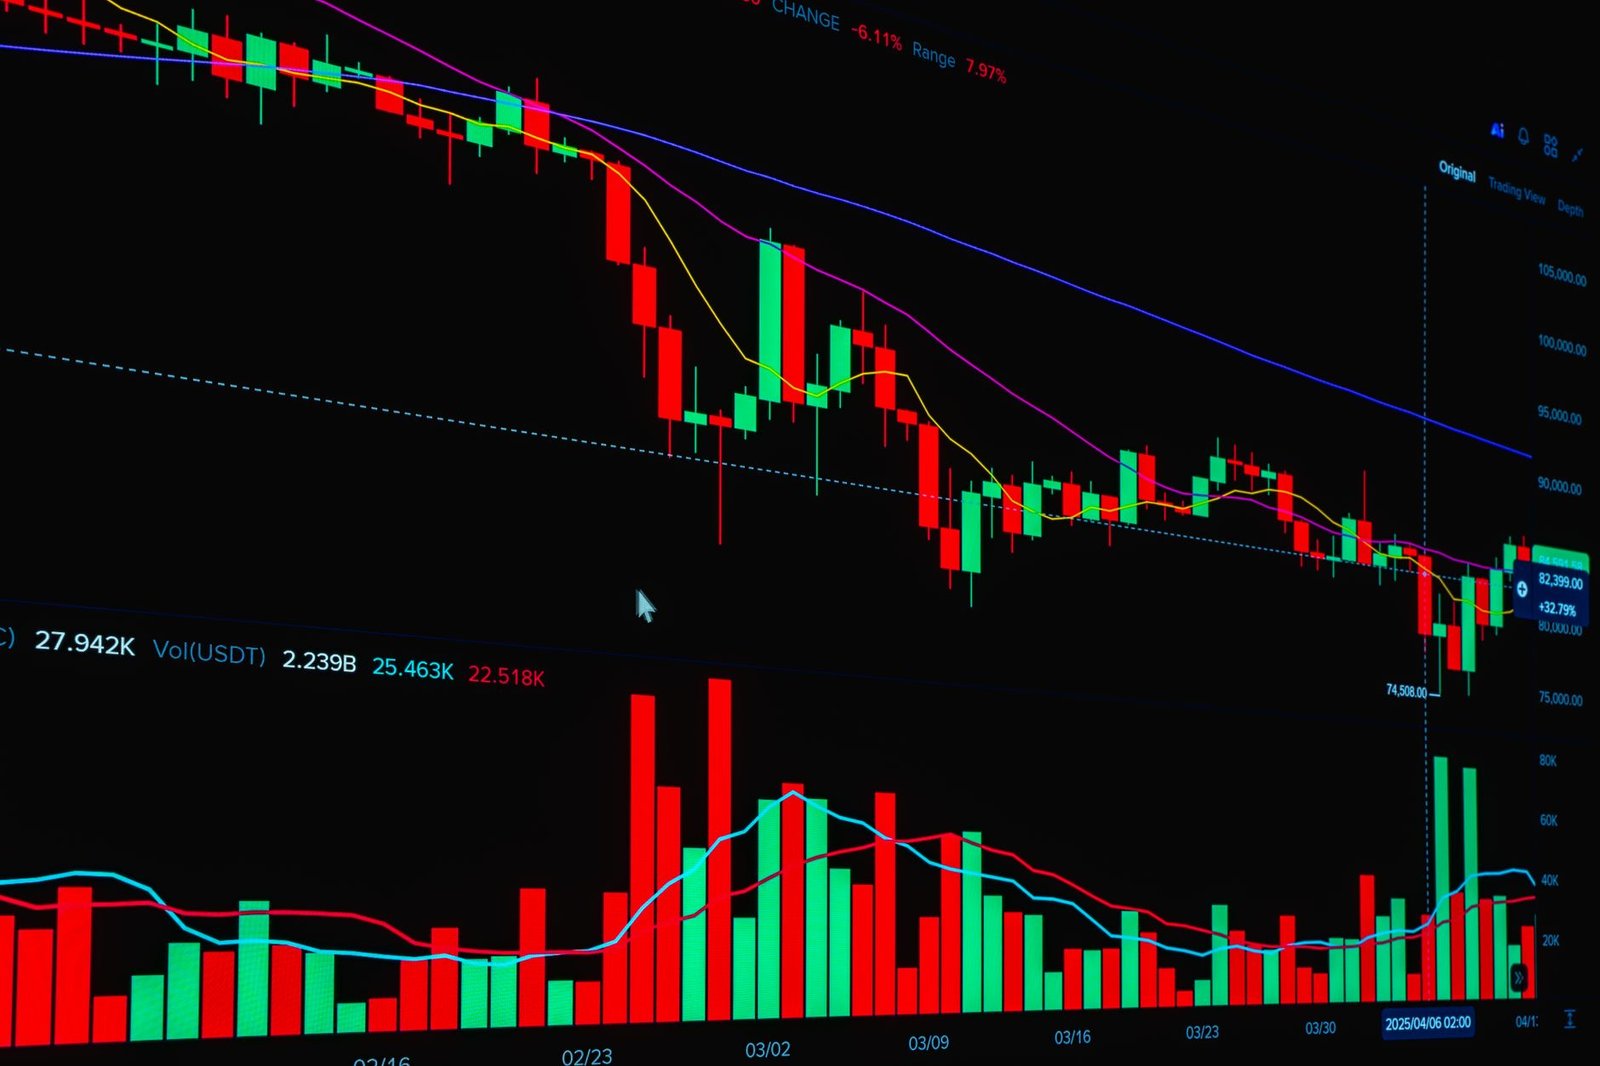
Technical analysts use price charts to identify patterns that historically precede predictable price movements. Common chart patterns include Head and Shoulders (often a reversal pattern), Double Tops/Bottoms (reversal), and Triangles (continuation or reversal). Identifying the prevailing trend – uptrend, downtrend, or sideways – is fundamental. Trading with the trend is a core principle; for example, buying during an uptrend when prices pull back to support levels.

Technical Indicators
Various technical indicators provide insights into market momentum, volatility, and trend strength. Moving Averages (Simple and Exponential) help smooth out price data to create a single lagging indicator, showing the average price over a given period. The Relative Strength Index (RSI) is a momentum oscillator that measures the speed and change of price movements, often used to identify overbought or oversold conditions. MACD (Moving Average Convergence Divergence) is another popular indicator that shows the relationship between two moving averages of a security’s prices.
Volume Analysis
Trading volume, the number of shares traded during a specific period, is a critical component of technical analysis. High volume accompanying a price move validates the strength of that move. For instance, a sharp price increase on significantly higher than average volume suggests strong buying interest and a potentially sustainable move. Conversely, a price rise on low volume might be viewed with skepticism.
Support and Resistance Levels
Support levels are price points where a downtrend can be expected to pause due to a balance of supply and demand. Resistance levels are price points where an uptrend can be expected to pause due to a lack of demand. These levels are often identified by previous price highs and lows. Breaking through a resistance level can signal a further upward move, while breaking below support can indicate further declines.
How to Develop a Trading Strategy for the Indian Markets?
Developing a robust trading strategy for the Indian markets requires defining your objectives, risk tolerance, and chosen analytical methods, then backtesting and refining your approach.
- Define Your Goals and Time Horizon: Are you looking for short-term trading profits or long-term wealth creation? This dictates your strategy (e.g., day trading vs. positional trading vs. investing).
- Choose Your Analytical Approach: Decide whether to focus on fundamental analysis, technical analysis, or a combination of both. For Indian markets, understanding macroeconomics is also key.
- Select Your Instruments: Will you trade stocks, derivatives (futures and options), ETFs, or mutual funds? Each has unique characteristics and risk profiles.
- Develop Entry and Exit Rules: Define precise conditions for entering a trade (e.g., Nifty crosses 20-day moving average with RSI above 60) and exiting (e.g., target profit reached, stop-loss triggered). Consider using a TradingView indicator for real-time signals.
- Determine Position Sizing and Risk Management: Decide how much capital to allocate to each trade and set strict stop-loss levels to limit potential losses. A common rule is risking no more than 1-2% of your trading capital per trade.
- Backtest Your Strategy: Test your rules on historical data to see how they would have performed. Tools like the Trend Traders Tool can aid in this.
- Paper Trade and Refine: Practice your strategy in a simulated environment (paper trading) before risking real money. Adjust your rules based on simulated performance.
- Execute and Review: Implement your strategy with real capital, meticulously record your trades, and periodically review your performance to make necessary adjustments.

What Factors Influence the Indian Stock Market Sentiment?
Indian stock market sentiment is influenced by a complex interplay of domestic economic news, global events, corporate performance, and investor psychology.
Domestic Economic Factors
Government policies, fiscal budgets, inflation data, interest rate decisions by the RBI, and the performance of key sectors (like agriculture and manufacturing) significantly impact sentiment. Positive economic reforms or a stable inflation outlook generally boost investor confidence.
Global Economic and Political Events
International developments, such as global economic slowdowns, geopolitical tensions, commodity price fluctuations (especially crude oil, a major import for India), and major elections in developed economies, can create ripples in the Indian market. For instance, rising global crude oil prices can increase India’s import bill and negatively affect its current account deficit, impacting sentiment.
Corporate Earnings and News
The financial results of major Indian companies and significant corporate announcements (mergers, acquisitions, new product launches) directly affect investor perception. Strong earnings season often lifts market sentiment, while disappointing results can trigger sell-offs.
Investor Psychology and FII/DII Activity
Fear and greed play a substantial role. Investor sentiment can also be gauged by the activity of Foreign Institutional Investors (FIIs) and Domestic Institutional Investors (DIIs). Heavy buying by DIIs can signal confidence, while large selling by FIIs might indicate caution.
Frequently Asked Questions
How often should I review my stock analysis?
For active traders, daily or weekly reviews are common. Long-term investors might review their portfolios quarterly or annually, focusing on fundamental changes rather than short-term price fluctuations.
What is the difference between Nifty and Sensex?
Nifty 50 is managed by the National Stock Exchange (NSE) and comprises 50 large-cap stocks. The BSE Sensex, managed by the Bombay Stock Exchange (BSE), includes 30 large-cap stocks. Both are benchmark indices for the Indian equity market.
Is technical analysis sufficient for Indian stock market success?
While technical analysis can be powerful for timing entries and exits, relying solely on it may be risky. Combining it with fundamental analysis provides a more comprehensive view of a stock’s potential and value.
How important are macro-economic factors for Indian stocks?
Extremely important. India’s economic growth, inflation, interest rates, and government policies have a profound impact on corporate profitability and investor sentiment, influencing the overall direction of the stock market.
What is the role of SEBI in the Indian stock market?
The Securities and Exchange Board of India (SEBI) is the primary regulator. It protects investor interests, promotes market development, and ensures fair and transparent trading practices across exchanges like NSE and BSE.
Can a beginner succeed in the Indian stock market?
Yes, beginners can succeed by starting with thorough research, focusing on fundamental analysis, understanding market basics, managing risk diligently, and potentially starting with diversified investments like mutual funds.
Key Takeaways
- A robust analysis of the Indian stock market combines fundamental (company value, economy) and technical (price action, volume) approaches.
- Monitoring key economic indicators like GDP, inflation, and RBI policies is crucial for understanding market direction.
- Technical tools like chart patterns, indicators (RSI, MACD), and volume analysis help in timing trades and identifying trends.
- Developing a trading strategy with clear entry/exit rules and strict risk management is essential for consistent profitability.
- Market sentiment is influenced by domestic news, global events, corporate earnings, and institutional investor activity.
- Continuous learning, backtesting, and disciplined execution are hallmarks of successful traders and investors in India.
Investing in the stock market involves risks, including the potential loss of principal. Past performance is not indicative of future results.





 Finovatives