Mastering the Indian Stock Market: A Professional’s Approach
The Indian stock market, encompassing the vibrant exchanges of the National Stock Exchange (NSE) and the Bombay Stock Exchange (BSE), presents a dynamic landscape for traders and investors alike. To navigate this terrain effectively and consistently generate profitable outcomes, adopting a professional analytical approach is paramount. This guide delves into the core principles and practical methodologies that distinguish seasoned market participants from novices.
Understanding the Foundational Pillars of Market Analysis
Professional analysis isn’t a singular technique but a synthesis of various disciplines. At its core, it involves understanding what drives market movements and how to interpret the signals these movements generate. We will explore both fundamental and technical analysis, highlighting their interplay and how to leverage them for informed decision-making within the Indian context.
1. Fundamental Analysis: The Bedrock of Value Investing
Fundamental analysis is the process of evaluating a security’s intrinsic value by examining related economic, financial, and other qualitative and quantitative factors. For the Indian market, this means looking beyond just the company’s stock price to understand its underlying business health and future potential. Key aspects include:
- Economic Indicators: Monitoring macroeconomic factors such as GDP growth, inflation rates (CPI, WPI), interest rate policies by the Reserve Bank of India (RBI), and government fiscal policies. A growing economy generally supports a bullish stock market, while rising inflation or interest rates can dampen investor sentiment. For instance, changes in the repo rate announced by the RBI directly impact borrowing costs for companies and liquidity in the market.
- Industry Analysis: Understanding the specific sector a company operates in. Is the industry growing, mature, or declining? Factors like regulatory changes (e.g., SEBI’s new guidelines for mutual funds), technological disruptions, and competitive landscape play a crucial role. Analyzing sectors like IT, pharmaceuticals, or banking requires a distinct approach due to their unique drivers.
- Company-Specific Metrics: This involves a deep dive into a company’s financial statements. Key metrics include:
- Revenue and Profit Growth: Consistent year-on-year growth in top-line and bottom-line figures is a positive sign.
- Profitability Ratios: Such as Net Profit Margin, Operating Profit Margin, and Return on Equity (ROE), which indicate how efficiently a company generates profits. An ROE above 15-20% is often considered healthy for Indian companies.
- Debt-to-Equity Ratio: A measure of financial leverage. High debt can be risky, especially in a rising interest rate environment.
- Cash Flow Analysis: Ensuring the company generates sufficient cash from its operations to fund its activities and growth.
- Management Quality and Corporate Governance: Evaluating the competence and integrity of a company’s management team, as well as its adherence to ethical business practices. This is particularly important in India, where corporate governance standards are continuously evolving under SEBI’s watch.
By dissecting these components, investors can identify fundamentally strong companies trading at attractive valuations, often overlooked by the broader market. Think of a company like Reliance Industries; its diversified business model across petrochemicals, retail, and telecom requires a multifaceted fundamental analysis.
2. Technical Analysis: Decoding Market Psychology and Trends
While fundamental analysis tells you *what* to buy, technical analysis helps you determine *when* to buy or sell. It’s based on the premise that market prices reflect all available information and that prices move in trends. Technical analysts use charts and statistical indicators to forecast future price movements. Essential tools for Indian traders include:
- Chart Patterns: Identifying formations like Head and Shoulders, Double Tops/Bottoms, Triangles, and Flags, which can signal potential trend reversals or continuations. For example, a bullish flag pattern on the daily chart of Infosys might suggest a short-term pause before the uptrend resumes.
- Candlestick Patterns: Specific Japanese candlestick formations (e.g., Doji, Hammer, Engulfing patterns) provide insights into market sentiment at specific price points. A bullish engulfing pattern on the Nifty 50 index chart could indicate buying pressure overcoming selling pressure.
- Technical Indicators: These are mathematical calculations based on price and/or volume data. Popular indicators used in India include:
- Moving Averages (MA): Simple Moving Average (SMA) and Exponential Moving Average (EMA) help identify trends and potential support/resistance levels. A common strategy is the golden cross (50-day MA crossing above 200-day MA) or death cross.
- Relative Strength Index (RSI): A momentum oscillator that measures the speed and change of price movements, helping to identify overbought or oversold conditions. An RSI above 70 typically signals overbought, and below 30 signals oversold.
- MACD (Moving Average Convergence Divergence): A trend-following momentum indicator that shows the relationship between two moving averages of a security’s price. Crossovers and divergence can signal potential trend changes.
- Volume Analysis: High trading volume accompanying a price move often confirms the strength of that move. A breakout on high volume is generally considered more reliable than one on low volume.
- Support and Resistance Levels: These are price zones where a stock or index historically has found it difficult to move past (resistance) or fall below (support). Identifying these levels is crucial for setting entry, exit, and stop-loss points.
3. Intermarket Analysis: The Broader Context
Professional traders don’t analyze stocks in isolation. They consider how different markets influence each other. This includes:
- Currency Movements: The Indian Rupee (INR) exchange rate against major currencies like the USD impacts companies with significant import/export exposure. A weakening Rupee can benefit IT and pharmaceutical exporters but hurt importers.
- Commodity Prices: For India, the prices of crude oil and gold are particularly significant. High crude oil prices impact inflation and the current account deficit, while gold often acts as a safe-haven asset.
- Global Market Trends: The performance of major global indices like the S&P 500, Dow Jones, or FTSE can influence sentiment in the Indian market, especially during periods of global economic uncertainty.
Integrating Fundamental and Technical Analysis
The most successful traders and investors blend both fundamental and technical analysis. Fundamental analysis identifies the ‘what’ – which companies are fundamentally sound. Technical analysis refines the ‘when’ – providing optimal entry and exit points based on price action and market sentiment.
The Synergy in Practice
Imagine you identify a fundamentally strong mid-cap company in the renewable energy sector, a sector poised for growth in India. You’ve analyzed its robust balance sheet and positive future outlook. Now, using technical analysis, you wait for the stock price to consolidate near a key support level, perhaps after a minor pullback, and look for a bullish candlestick pattern on increased volume to signal the optimal entry point. This combined approach minimizes risk and maximizes the probability of a successful trade.
Risk Management: The Unsung Hero of Trading
No amount of analysis can guarantee profits if risk isn’t managed effectively. Professional traders prioritize capital preservation above all else. This involves:
- Position Sizing: Determining how much capital to allocate to a single trade based on your risk tolerance and the volatility of the asset. A common rule is to risk no more than 1-2% of your total trading capital on any single trade.
- Stop-Loss Orders: Pre-defined exit points set to limit potential losses. If the market moves against your position beyond a certain point, the stop-loss order automatically closes the trade. This is non-negotiable for professional traders.
- Diversification: Spreading investments across different asset classes (stocks, bonds, gold) and within different sectors of the stock market to reduce the impact of a single poor-performing investment.
- Risk-Reward Ratio: Ensuring that the potential profit from a trade is significantly higher than the potential loss. A common target is a risk-reward ratio of 1:2 or 1:3, meaning for every rupee risked, you aim to make two or three rupees.

Adapting to Market Volatility
The Indian stock market, like any emerging market, can be subject to high volatility. Professional traders are not afraid of volatility; they understand it and incorporate it into their risk management strategies. This might mean using wider stop-losses during periods of high uncertainty or focusing on shorter-term trades with clear exit strategies.
Leveraging Data and Tools for Analysis
In today’s digital age, a plethora of tools and data sources are available to assist in market analysis. Professionals utilize these resources strategically:
- Financial Portals and News: Websites like Moneycontrol, Economic Times Markets, and Livemint provide real-time news, stock quotes, financial data, and expert analysis relevant to the Indian market. Staying updated with SEBI announcements, corporate results, and economic news is vital.
- Trading Platforms: Most brokerage platforms in India (e.g., Zerodha Kite, Upstox Pro, ICICI Direct) offer advanced charting tools, real-time data feeds, and integrated technical indicators.
- Screeners: Stock screeners (available on most financial portals and trading platforms) allow traders to filter stocks based on specific fundamental or technical criteria. For example, filtering for companies with an ROE > 20% and a Debt-to-Equity ratio < 0.5.
- Economic Calendars: These track upcoming economic events and data releases (e.g., inflation data, RBI monetary policy meetings) that can impact market sentiment.
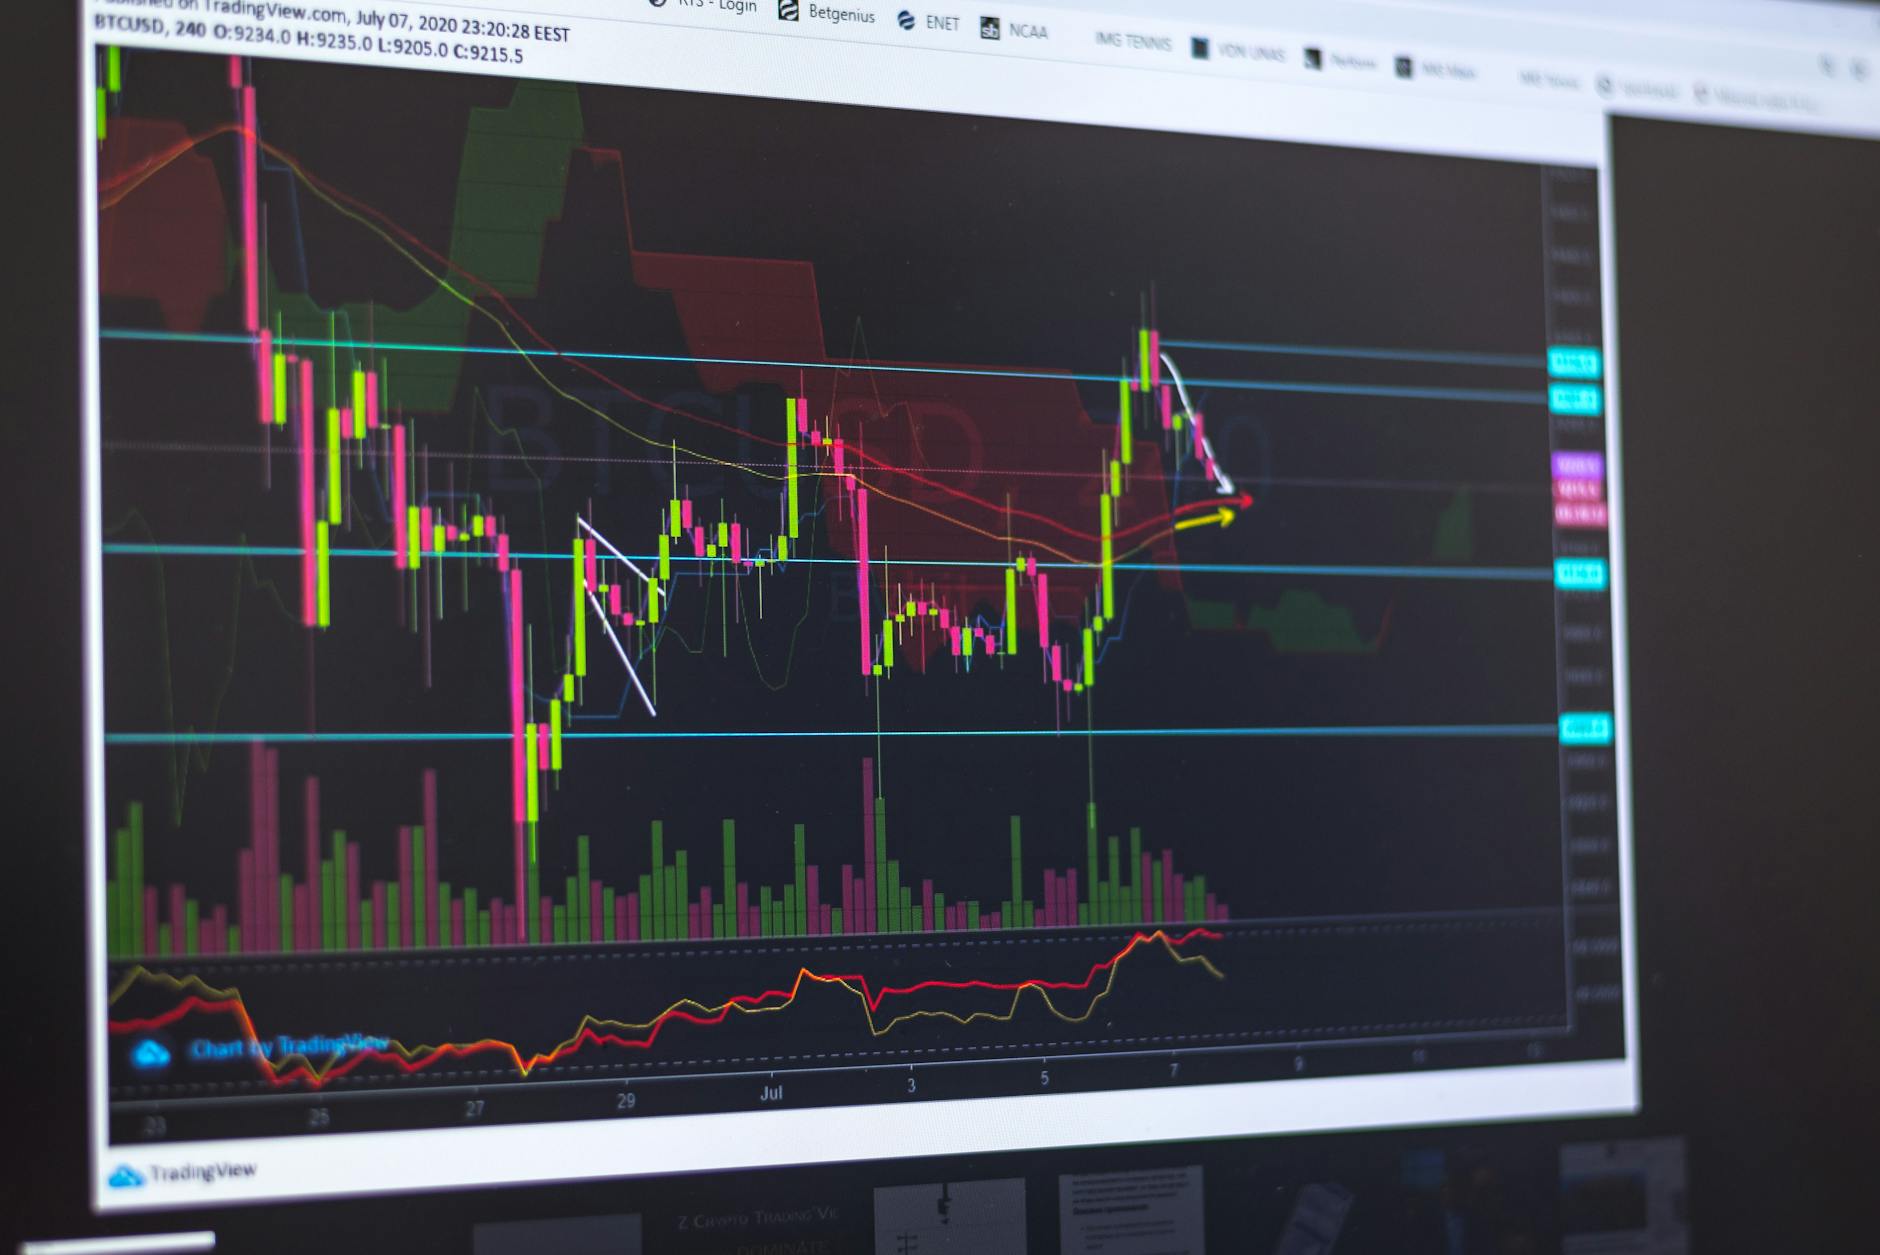
The Role of TradingView in Indian Markets
Platforms like TradingView have become indispensable for many Indian traders. They offer sophisticated charting capabilities, a vast array of indicators, social networking features for idea sharing, and the ability to backtest strategies. Tools like custom indicators, available through Finovatives.com, can further enhance analysis by providing unique insights tailored to specific trading styles and market conditions in India.
Developing a Trading Plan and Discipline
Perhaps the most critical element differentiating professional traders is their unwavering discipline and adherence to a well-defined trading plan. This plan should encompass:
- Trading Objectives: Clearly defined goals, whether short-term (e.g., daily profit targets) or long-term (e.g., wealth creation).
- Entry and Exit Criteria: Specific conditions that must be met before entering a trade and predetermined exit points (both for profit and loss).
- Risk Management Rules: As discussed earlier, these are non-negotiable.
- Market Conditions: Understanding when to trade actively and when to stay on the sidelines based on market volatility and trend.
Continuous Learning and Adaptation
The stock market is constantly evolving. Professional analysts and traders commit to continuous learning, staying updated with market trends, new analytical techniques, and economic developments. Adapting strategies based on changing market dynamics is key to long-term success. For instance, during a liquidity crunch, a strategy focusing on fundamentally strong, low-debt companies might be more appropriate than one chasing high-growth but highly leveraged businesses.
Key Takeaways
- A robust analysis of the Indian stock market requires a blend of fundamental and technical approaches.
- Fundamental analysis assesses a company’s intrinsic value, considering economic, industry, and company-specific factors.
- Technical analysis helps identify optimal entry and exit points by studying price action, patterns, and indicators.
- Intermarket analysis provides crucial context by examining currency, commodity, and global market influences.
- Rigorous risk management, including position sizing and stop-losses, is paramount for capital preservation.
- Leverage digital tools and data sources effectively for informed decision-making.
- Discipline, a well-defined trading plan, and continuous learning are hallmarks of professional traders.
Disclaimer: Investing in the stock market involves significant risks, including the potential loss of principal. This article is for educational and informational purposes only and should not be construed as financial advice. Always conduct your own thorough research and consult with a qualified financial advisor before making any investment decisions. Past performance is not indicative of future results.
Frequently Asked Questions
What are the key Indian stock exchanges for analysis, and how do they differ?
The primary Indian stock exchanges are the National Stock Exchange (NSE) and the Bombay Stock Exchange (BSE). While both list a vast array of companies, the NSE often has higher trading volumes, particularly in derivatives, and is known for its electronic trading platform. Analyzing data from both is crucial for a comprehensive market view.
How do RBI policies, like repo rate changes, affect Indian stock market investments?
The Reserve Bank of India's (RBI) repo rate directly influences borrowing costs. A higher repo rate increases loan costs for companies and consumers, potentially reducing corporate profits and consumer spending, which can negatively impact stock prices on the NSE and BSE. Lower rates generally stimulate the market.
What are crucial financial metrics for analyzing Indian companies listed on NSE/BSE?
For Indian stocks, focus on Revenue Growth, Net Profit Margin, and Return on Equity (ROE). A healthy ROE above 15-20% often indicates efficient operations. Also, monitor the Debt-to-Equity ratio for financial risk and Cash Flow from Operations to ensure sustainability.
How can I use fundamental and technical analysis together for the Indian market?
Fundamental analysis helps identify undervalued stocks on NSE/BSE based on intrinsic value. Technical analysis then helps time entry and exit points by studying price charts and patterns. Combining them allows you to find strong companies at opportune moments, maximizing potential gains.
What specific economic indicators should Indian stock market traders monitor?
Indian traders must track GDP growth, inflation rates (CPI/WPI), and the RBI's monetary policy (especially repo/reverse repo rates). Government fiscal policies and foreign institutional investor (FII) flows also significantly impact the NSE and BSE, influencing market sentiment and stock movements.