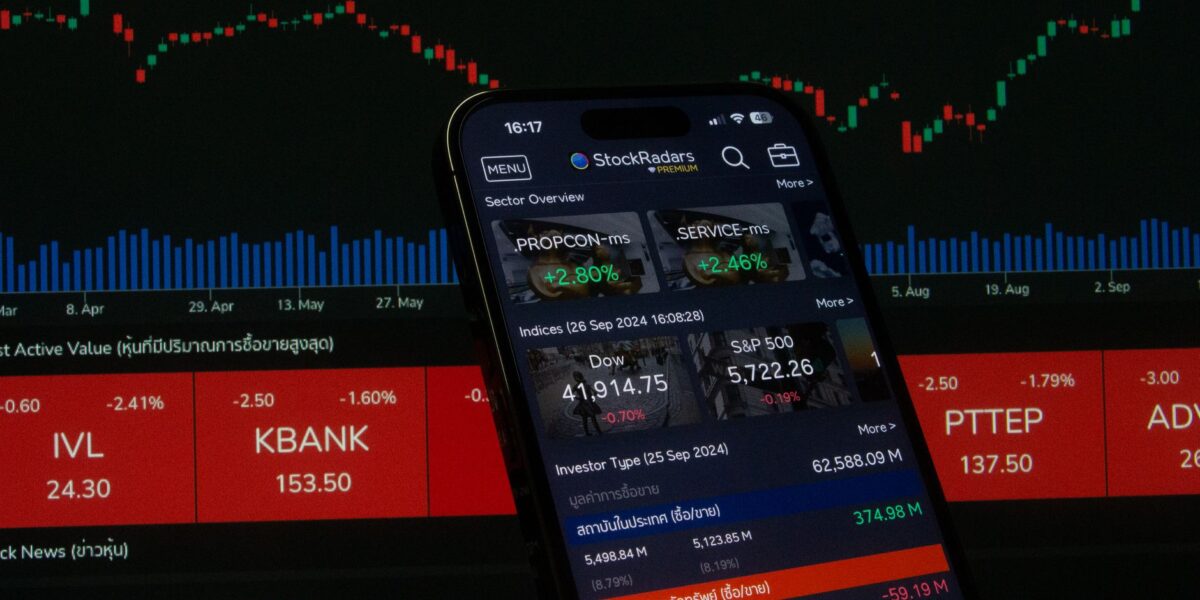
TL;DR: Identifying multibagger stocks in India involves rigorous research into companies with sustainable competitive advantages, robust earnings growth, prudent financial management, and a favourable market outlook, often supported by technical indicators signalling an upward trend.
Key Stats at a Glance:
- Nifty 50’s average annual return over the last decade: ~12%
- Number of listed companies on NSE: Over 2,000
- Average debt-to-equity ratio for top-performing Indian companies: Below 1.0
- Market Capitalisation of BSE Sensex at the start of 2024: ₹300+ Lakh Crore
- Typical holding period for multibagger investors: 5+ years
What is a Multibagger Stock?
A multibagger stock is an equity share that returns more than 100% (i.e., more than double its value) over a period, with the term ‘multi-bagger’ originating from cricket, signifying hitting boundaries multiple times. In the Indian stock market context, these are stocks that have the potential to grow significantly in value, delivering returns of several hundred or even thousand percent over time.
The allure of multibagger stocks lies in their potential for exponential wealth creation, far surpassing traditional investment avenues. Identifying such gems before they make their substantial move is the holy grail for many retail investors. It requires a systematic approach, combining deep dives into company fundamentals with an understanding of market dynamics and investor sentiment. While no strategy guarantees success, a data-driven methodology significantly increases the probability of unearthing these high-potential stocks.

How to Identify Potential Multibagger Stocks?
Identifying potential multibagger stocks in India requires a meticulous examination of both fundamental and technical parameters, coupled with an understanding of the broader economic and industry landscape. It’s about finding companies that are not just growing, but are poised for exponential expansion due to a confluence of favourable factors.
The journey begins with a deep dive into a company’s financial health and growth trajectory. This involves analysing historical performance, understanding the business model, assessing the management quality, and evaluating the competitive moat. Furthermore, monitoring market trends, sector-specific tailwinds, and even global economic shifts can provide crucial clues. For investors looking for advanced tools, custom TradingView indicators can often highlight unusual volume or price action that precedes significant moves.
Key Fundamental Criteria:
- Consistent Earnings Growth: Look for companies that have demonstrated a sustained track record of increasing their profits year-on-year, ideally at a rate higher than their revenue growth, indicating improving operating margins. A CAGR (Compound Annual Growth Rate) of over 15-20% in PAT (Profit After Tax) for at least 5 years is a strong indicator.
- Strong Return Ratios: Evaluate metrics like Return on Equity (ROE) and Return on Capital Employed (ROCE). Consistently high ROE (above 15-20%) and ROCE (above 18-20%) suggest efficient utilisation of shareholder funds and capital, respectively.
- Low Debt Levels: Companies with manageable debt, indicated by a Debt-to-Equity ratio below 1.0 (and ideally below 0.5 for smaller companies), are financially more resilient and less susceptible to economic downturns.
- Scalable Business Model & Competitive Moat: The company should possess a business model that can scale significantly without a proportionate increase in costs. A strong competitive advantage (e.g., brand loyalty, patents, network effects, cost leadership) is crucial for sustained profitability and market dominance.
- Visionary Management: Assess the quality and integrity of the management team. Look for transparency, a clear long-term vision, and a history of sound decision-making. Their ability to navigate challenges and capitalise on opportunities is paramount.
- Industry Tailwinds: Investigate sectors that are experiencing structural growth due to government policies, technological advancements, or changing consumer preferences. For instance, sectors like renewable energy, digital transformation, or specialty chemicals in India have shown significant promise.
While fundamental analysis forms the bedrock, technical analysis can help in timing the entry and exit points, identifying stocks that are showing early signs of a breakout from consolidation patterns.
The Role of Technical Analysis in Multibagger Hunting
While fundamentals drive long-term value, technical analysis can be instrumental in pinpointing the optimal entry points for potential multibagger stocks, helping investors avoid buying into a temporary dip or a prolonged bear phase.
Technical analysis uses historical price and volume data to forecast future price movements. For multibagger candidates, traders often look for specific chart patterns and indicator signals that suggest accumulation and the potential for a significant upward trend. This complements the fundamental screening by adding a layer of price action confirmation, which is vital in the volatile Indian stock market.
[IMAGE_PLACE_2]
Chart Patterns to Watch For
Certain chart patterns are widely recognised as precursors to significant price increases. These include:
- Cup and Handle: A bullish continuation pattern indicating a potential upward breakout after a period of consolidation.
- Ascending Triangles: Suggests that buying pressure is gradually increasing, leading to a potential upward trend.
- Bullish Flags and Pennants: Short-term continuation patterns that form after a sharp price increase (the flagpole), indicating a pause before the next leg up.
- Wedges (Falling): A pattern where price movements become increasingly confined within two converging trendlines, often preceding a bullish reversal.
Key Technical Indicators for Confirmation
While chart patterns provide visual cues, technical indicators offer quantitative confirmation:
- Moving Averages (MAs): Crossovers of short-term MAs above long-term MAs (e.g., 50-day MA crossing above 200-day MA – the ‘Golden Cross’) are considered bullish signals.
- Volume Analysis: A sharp increase in trading volume accompanying a price breakout confirms strong buying interest and the conviction behind the move. Spikes in volume during consolidation phases can indicate accumulation by informed investors.
- Relative Strength Index (RSI): While often used to identify overbought/oversold conditions, an RSI moving out of oversold territory (below 30) and trending upwards can signal emerging strength. Divergences between price and RSI can also be predictive.
- MACD (Moving Average Convergence Divergence): A bullish crossover where the MACD line crosses above the signal line, especially when occurring below the zero line, can indicate strengthening positive momentum.
Many sophisticated investors leverage custom TradingView indicators that combine multiple signals, offering a more nuanced view. A free trial of such tools can be an excellent way to explore their utility.
Financial Health Checks: Beyond the Surface
Deep financial analysis is non-negotiable when hunting for multibaggers. It’s about understanding the ‘why’ behind the numbers and ensuring the company’s growth is sustainable and not built on shaky foundations.
Beyond basic ratios, investors must scrutinise the quality of earnings, cash flow generation, and balance sheet strength. A company might show impressive profit growth, but if it’s not translating into actual cash in the bank, or if it’s accumulating unsustainable debt, the outlook can be grim. Understanding the nuances of financial statements, as mandated by SEBI regulations, is critical for long-term investment success.
Analysing Earnings Quality
High-quality earnings are typically those that are backed by strong operating cash flows. Investors should compare net profit with cash flow from operations. A significant and persistent divergence can be a red flag, potentially indicating aggressive accounting practices.
Cash Flow Generation
Positive and growing operating cash flow is a sign of a healthy business. Free cash flow (cash flow from operations minus capital expenditures) indicates the cash available for debt repayment, dividends, or reinvestment. A company consistently generating strong free cash flow is often financially robust.
Balance Sheet Strength
A strong balance sheet is characterised by low leverage and ample liquidity. Examine the company’s current ratio (current assets/current liabilities) and quick ratio (excluding inventory) to assess short-term solvency. A healthy proportion of equity to debt ensures financial stability.
Management Discussion & Analysis (MD&A)
This section in annual reports provides management’s perspective on the company’s performance, risks, and future outlook. It’s a valuable source for understanding the strategic direction and potential challenges. Reading between the lines here can reveal crucial insights.
Understanding Market Sentiment and Economic Cycles
Even the best companies can underperform in a weak market or a contracting economy. Therefore, understanding the broader macroeconomic environment and market sentiment is crucial for identifying opportune moments to invest in potential multibaggers.
Factors such as interest rate trends, inflation, government policies, and geopolitical events significantly influence stock market performance. Identifying sectors or companies that are resilient to economic downturns or are poised to benefit from specific economic cycles can provide a significant edge.
Sectoral Analysis
Focus on sectors with favourable long-term growth prospects. India’s demographic dividend, increasing disposable incomes, and government initiatives in areas like infrastructure, manufacturing (Make in India), and digital services create fertile ground for growth. Analyse which specific industries within these sectors are likely to benefit most.
Economic Cycles
Different sectors perform differently during various economic phases (expansion, peak, contraction, trough). For example, consumer discretionary stocks might thrive during economic booms, while defensive sectors like FMCG or pharmaceuticals may hold up better during downturns. Understanding these cycles helps in timing investments.
Market Sentiment Indicators
While subjective, indicators like investor surveys, put-call ratios, and the VIX (Volatility Index) can offer insights into prevailing market sentiment. Extreme pessimism can sometimes present buying opportunities, while excessive optimism might signal a market top.
[IMAGE_PLACE_3]
How to Construct Your Multibagger Watchlist
Building a watchlist of potential multibagger stocks is an ongoing process that requires discipline and a clear set of criteria. This list serves as a starting point for deeper research and eventual investment.
The ideal watchlist comprises companies that meet your initial screening criteria but may not yet be fully recognised by the broader market. Regularly reviewing and refining this list ensures you stay informed about promising opportunities.
How to Build and Maintain Your Multibagger Watchlist:
- Define Your Investment Criteria: Based on the fundamental and technical factors discussed, set clear quantitative and qualitative parameters (e.g., minimum revenue growth, maximum debt-to-equity, positive cash flow, specific technical patterns).
- Initial Screening: Use stock screeners (available on financial portals or broker platforms) to filter the universe of Indian stocks (from NSE and BSE) based on your defined criteria. Start with a broad universe and narrow it down.
- Fundamental Deep Dive: For the shortlisted companies, conduct thorough fundamental research. Analyse their annual reports, quarterly results, investor presentations, and management commentary. Understand their competitive landscape and future growth drivers.
- Technical Analysis Overlay: Apply technical analysis to the fundamentally strong candidates. Look for stocks that are showing signs of bottoming out, consolidating, or breaking out from key resistance levels, ideally with increasing volume. Utilize tools like TradingView indicators for enhanced analysis.
- Risk Assessment: Evaluate the risks associated with each stock, including business risks, financial risks, and market risks. Diversification across sectors and market capitalisation is crucial.
- Monitor Regularly: Continuously track the performance and news flow of companies on your watchlist. Re-evaluate their fundamentals and technicals periodically (e.g., quarterly).
- Be Patient: Multibagger returns typically materialise over several years. Avoid impulsive decisions and allow your investments the time to grow.
- Consider Professional Advice: If you are unsure, consult a SEBI-registered investment advisor to validate your research and strategy.
Frequently Asked Questions
What is the average return of a multibagger stock?
There is no fixed ‘average’ return as multibagger performance is highly variable. However, the term implies returns significantly exceeding 100%, often ranging from 500% to several thousand percent over a period of 5-10 years or more.
Are multibagger stocks risky?
Yes, identifying and investing in potential multibaggers carries higher risk. Many small or mid-cap companies that show high growth potential may also face significant challenges, leading to potential capital loss.
How often should I check my multibagger watchlist?
It’s advisable to review your watchlist at least quarterly, coinciding with company earnings announcements. However, keeping abreast of significant news or market events affecting these stocks is also important.
Can technology and AI help in finding multibaggers?
Yes, advanced analytical tools, AI-driven screeners, and custom TradingView indicators can help process vast amounts of data to identify potential multibaggers based on complex patterns and criteria, complementing traditional research methods.
What is a reasonable timeframe to expect multibagger returns?
Multibagger returns are typically a long-term phenomenon, often requiring holding periods of 5 to 10 years or even longer. Quick, high returns are usually speculative and not characteristic of true multibaggers.
Should I invest all my capital in potential multibagger stocks?
No, it is highly inadvisable to invest your entire capital. Diversification across different asset classes and within the stock market itself is crucial for risk management. Only allocate capital you can afford to lose.
[IMAGE_PLACE_4]
Key Takeaways
- Multibagger stocks offer the potential for exponential wealth creation but come with inherent risks.
- A combination of strong fundamentals (consistent growth, low debt, high returns) and confirming technical signals is key.
- Thorough financial analysis, including earnings quality and cash flow, is crucial for identifying sustainable growth.
- Understanding economic cycles and sector-specific tailwinds can provide a strategic advantage.
- Building and regularly monitoring a dedicated watchlist using defined criteria increases the chances of success.
- Patience and a long-term investment horizon are essential for realising multibagger returns.
- Utilise resources like SEBI guidelines, NSE/BSE data, and advanced tools like TradingView indicators to aid your research.
Investing in the stock market involves risk, including the potential loss of principal. This information is for educational purposes only and does not constitute investment advice.






 Finovatives