TL;DR: Fibonacci Retracement uses key ratios (23.6%, 38.2%, 50%, 61.8%, 78.6%) derived from the Fibonacci sequence to predict potential support and resistance levels in Indian stock charts, helping traders identify opportune entry and exit points.
Key Stats at a Glance:
- Nifty 50’s average intraday volatility: ~0.75%
- BSE Sensex historical P/E ratio range: 15-25
- Indian equity market capitalization: Over ₹300 Lakh Crore (as of early 2024)
- SEBI mandates a minimum trading margin of 50% for derivatives.
- Fibonacci sequence: Starts with 0, 1, and each subsequent number is the sum of the two preceding ones (e.g., 0, 1, 1, 2, 3, 5, 8, 13…).
What is Fibonacci Retracement?
Fibonacci Retracement is a technical analysis drawing tool that marks potential support and resistance levels on a price chart by identifying specific percentages of a prior price move. These percentages are based on the mathematical Fibonacci sequence and are widely used by traders in the Indian stock market to anticipate where a price might reverse after a significant trend.
Developed from the work of Leonardo Fibonacci, the sequence reveals a unique relationship between numbers that appears surprisingly often in nature and, as many traders have observed, in financial markets. The core idea is that after a substantial price move (up or down), prices tend to retrace a predictable portion of that move before continuing in the original direction. These retracement levels act as potential turning points.
The most commonly used Fibonacci retracement levels are 23.6%, 38.2%, 50%, 61.8%, and 78.6%. While not all are direct Fibonacci ratios (50% and 78.6% are approximations), they are considered significant by traders. The 61.8% level, often called the ‘golden ratio’, is particularly watched. Traders use these levels to set stop-loss orders, identify potential profit targets, and find entry points when a pullback or rally seems to be exhausted.
How do Fibonacci Retracement Levels Work in Indian Markets?
Fibonacci retracement levels work by identifying potential support and resistance zones based on the mathematical ratios derived from the Fibonacci sequence applied to a significant price swing (from a swing low to a swing high, or vice versa). Traders in India’s NSE and BSE markets use these levels to predict where a pullback or rally might pause or reverse, offering strategic trading opportunities.
The application is straightforward: a trader identifies a significant price movement – a strong uptrend or downtrend. They then apply the Fibonacci retracement tool to this price swing. The tool automatically draws horizontal lines across the chart at the key Fibonacci percentages (23.6%, 38.2%, 50%, 61.8%, 78.6%) between the high and low points of the selected move. These lines represent potential areas where the price might find support (during a downtrend retracement) or resistance (during an uptrend retracement).
For example, if a stock like Reliance Industries made a strong move from ₹2,500 to ₹3,000, a trader would draw the Fibonacci retracement tool from ₹2,500 (low) to ₹3,000 (high). The tool would then plot lines at levels like 38.2% of the ₹500 move (which is ₹191), indicating a potential support around ₹3,000 – ₹191 = ₹2,809. Similarly, the 61.8% retracement level would suggest another potential support.
The Significance of Key Fibonacci Ratios
The magic behind Fibonacci retracement lies in the specific ratios. These aren’t arbitrary percentages; they emerge from the inherent mathematical properties of the Fibonacci sequence. When you divide any number in the sequence (after the first few) by the next number, you get a value approaching 0.618. Conversely, dividing a number by the previous one approaches 1.618 (the inverse of 0.618). Dividing a number by the number two places before it approaches 0.382, and so on. These ratios (0.618, 0.382, 0.236, 0.786) are believed to represent natural proportions and, by extension, areas of potential equilibrium or reversal in market prices.
The 61.8% level is often considered the most significant, sometimes referred to as the ‘golden ratio’ or ‘golden mean’. Many believe that markets, like natural phenomena, tend to gravitate towards this proportion. The 38.2% and 23.6% levels represent shallower retracements, indicating stronger underlying trends. The 50% level, while not a pure Fibonacci ratio, is crucial because it signifies the halfway point of a move, and psychologically, price often reacts strongly at the midpoint. The 78.6% level represents a deeper retracement, approaching the start of the original move.
Fibonacci Extension Levels
Beyond retracements, traders also use Fibonacci extension levels. While retracement levels project potential support/resistance within a prior move, extension levels project how far a price might move *beyond* the previous high (in an uptrend) or *below* the previous low (in a downtrend). The most common extension levels are 127.2%, 161.8%, 261.8%, and 423.6%. These are often used to set profit targets. For instance, if a stock breaks above a prior high, a trader might use the 161.8% extension level of the preceding swing as a target for their profits.
How to Use Fibonacci Retracement in Your Trading Strategy
Incorporating Fibonacci Retracement into your trading requires a systematic approach. Here’s a step-by-step guide for Indian traders aiming to leverage these levels for better decision-making:
- Identify a Significant Price Swing: Look for a clear, impulsive price move on your chart – either a strong uptrend from a low to a high, or a strong downtrend from a high to a low. The clearer the trend, the more reliable the subsequent retracement levels are likely to be.
- Select the Correct Fibonacci Tool: Most charting platforms, including TradingView, offer a dedicated Fibonacci Retracement tool. Ensure you’re using this specific tool.
- Apply the Tool Correctly: Click on the starting point of the identified price swing (e.g., the swing low in an uptrend) and drag your cursor to the ending point (e.g., the swing high). Release the click. The tool will automatically draw the horizontal retracement lines on your chart.
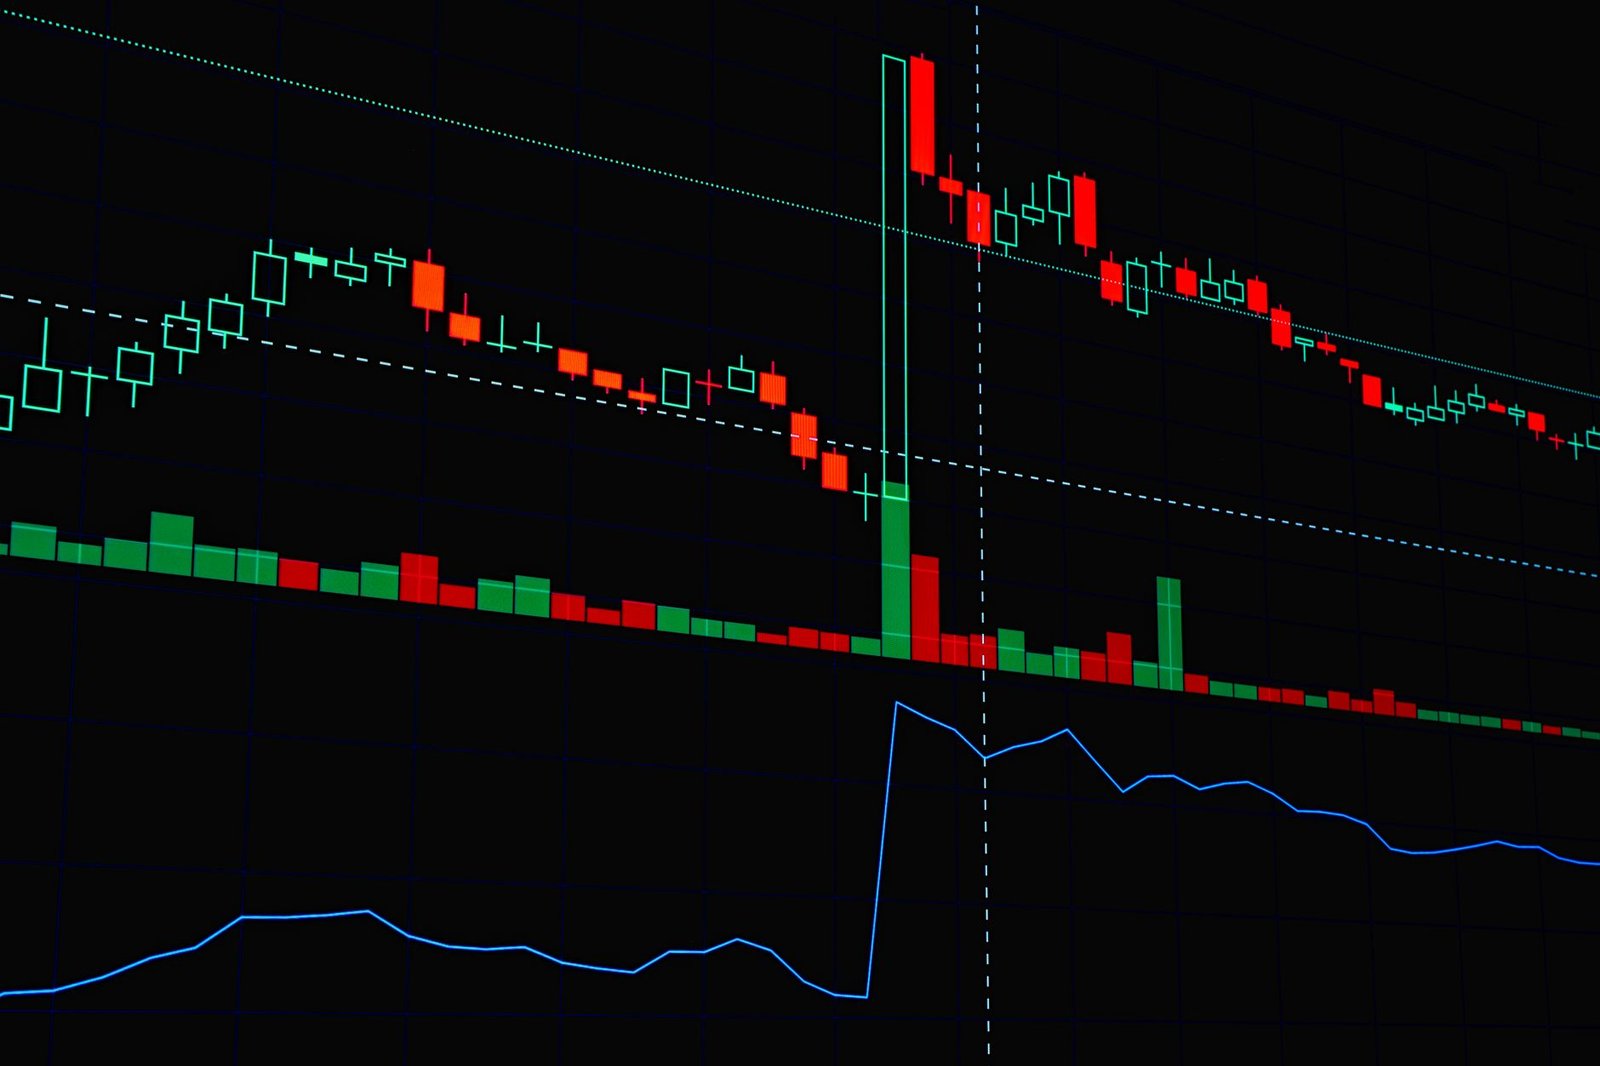
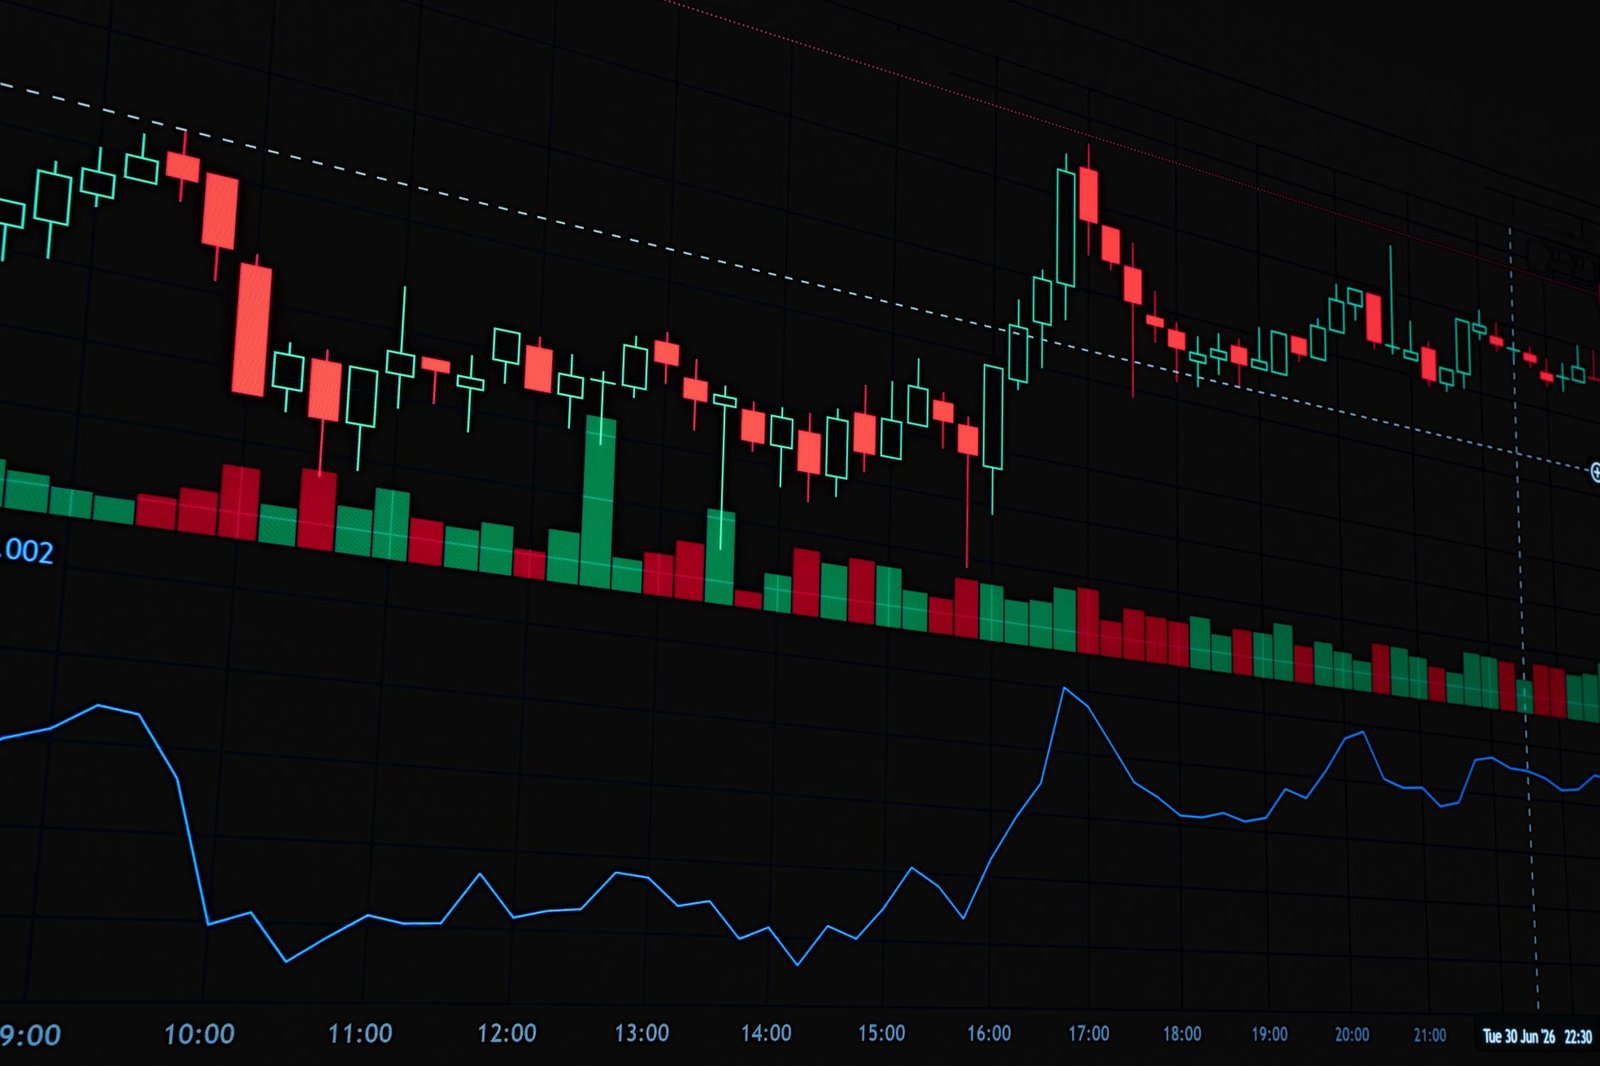
- Observe Price Action at Retracement Levels: Watch how the price reacts as it approaches these drawn levels. Look for confirmation signals like candlestick patterns (e.g., doji, hammer, engulfing patterns) or increased trading volume. A bounce off a Fibonacci support level or a rejection at a Fibonacci resistance level provides a strong trading signal.
- Look for Confluence: Fibonacci levels are more powerful when they coincide with other forms of support or resistance. This could include previous price highs/lows, trendlines, moving averages, or round numbers. When a Fibonacci level aligns with another technical indicator, it strengthens the potential for a price reaction. For example, if the 61.8% retracement level for Infosys aligns with its 200-day moving average, it signals a very strong potential support area.
- Set Entry, Stop-Loss, and Target Levels: Based on the price action and confluence, decide on your entry point (e.g., entering a long position after a bounce from the 38.2% level). Place your stop-loss just below the next significant Fibonacci level or below the swing low/high you identified. Use subsequent Fibonacci retracement or extension levels as potential profit targets.
- Backtest and Refine: Before trading live, backtest your Fibonacci strategy on historical data for Indian stocks. Use a paper trading account or a tool like our Trend Traders Tool to practice and refine your entry/exit rules without risking capital.
Advantages and Disadvantages of Fibonacci Retracement
Like any trading tool, Fibonacci Retracement has its strengths and weaknesses. Understanding these helps traders use it more effectively and realistically.
Advantages:
- Identifies Potential Turning Points: Its primary strength is highlighting probable areas where a price trend might pause or reverse, offering excellent entry and exit opportunities.
- Widely Applicable: It can be used across various timeframes (intraday to long-term) and asset classes, including stocks, commodities, and currencies, making it versatile for Indian traders.
- Objective Levels: Once a swing high and low are identified, the retracement levels are drawn objectively, reducing subjective interpretation compared to some other indicators.
- Complements Other Tools: It works exceptionally well when combined with other technical analysis tools like trendlines, moving averages, and candlestick patterns, providing confirmation.
- Psychological Significance: The levels often reflect psychological price points that traders tend to watch, reinforcing their effectiveness.
Disadvantages:
- Requires a Clear Trend: Fibonacci tools are most effective in trending markets. In sideways or choppy markets, the levels can be less reliable and may generate false signals.
- Subjectivity in Swing Selection: Identifying the correct swing high and low to draw the tool from can be subjective, leading to different levels being plotted by different traders.
- Not a Standalone System: It’s a tool, not a complete trading strategy. Relying solely on Fibonacci levels without considering other market factors or confirmation signals can be risky.
- Lagging Indicator: Like most technical tools, it is based on past price action and doesn’t predict future movements with certainty.
- Market Conditions Change: The effectiveness of certain levels can vary. What works for one stock or market condition might not work for another.
It’s crucial for Indian traders to remember that Fibonacci levels are not guaranteed price reversal points but rather areas of potential interest. Confirmation from other indicators and price action is always recommended.
Frequently Asked Questions
What is the most important Fibonacci retracement level?
The 61.8% level is often considered the most significant, known as the ‘golden ratio’. However, the 38.2% and 50% levels are also highly watched by traders for potential support and resistance.
Can Fibonacci Retracement be used for intraday trading in India?
Yes, Fibonacci Retracement can be effectively used for intraday trading by applying it to short-term price swings on hourly or even minute charts. Confirmation from other intraday indicators is advised.
What is the difference between Fibonacci Retracement and Extension?
Retracement levels project potential support/resistance within a prior price move, while extension levels project potential price targets *beyond* the previous high or low of a trend.
Do Fibonacci levels always work?
No trading tool is foolproof. Fibonacci levels indicate potential areas of support or resistance, but price reactions are not guaranteed. They are most effective when confirmed by other technical signals and in clearly trending markets.
How do I choose the correct swing high and low?
Choose the most recent, clear, and significant price peak (high) and trough (low) that represents a complete price move. The more pronounced the move, the more reliable the Fibonacci levels derived from it.
Is Fibonacci analysis suitable for beginners in the Indian stock market?
Yes, Fibonacci Retracement is relatively straightforward to apply and can be a valuable tool for beginners once they understand how to identify significant price swings and look for confirmation signals.
Key Takeaways
- Fibonacci Retracement uses ratios like 23.6%, 38.2%, 50%, 61.8%, and 78.6% to identify potential support and resistance levels.
- The 61.8% level, or ‘golden ratio’, is particularly significant.
- The tool is applied to significant price swings (low to high or high to low) to draw potential reversal zones.
- Confirmation from candlestick patterns, volume, and other indicators is crucial for reliable trading signals.
- Fibonacci Extension levels project potential price targets beyond previous highs or lows.
- It’s a powerful tool but works best in trending markets and should not be used in isolation.
- Understanding confluence – where Fibonacci levels align with other support/resistance – enhances its effectiveness.
Investment in securities markets is subject to market risks. Read all the related documents carefully before investing.





 Finovatives