TL;DR: Analyzing the Indian stock market like a pro involves a blend of technical and fundamental analysis, coupled with robust risk management and a deep understanding of market sentiment and economic factors influencing NSE and BSE.
Key Stats at a Glance:
- Nifty 50’s average annualised return (2014-2023): ~12%
- BSE Sensex’s market capitalisation: Over ₹300 lakh crore as of early 2024
- Number of listed companies on NSE: Over 2,000
- Average daily trading volume on Indian exchanges: Exceeds ₹10 lakh crore (across all asset classes)
- SEBI’s regulatory framework covers 98% of India’s securities market
What is Indian Stock Market Analysis?
Indian stock market analysis is the systematic process of evaluating securities and the broader market (NSE & BSE) to make informed investment and trading decisions. It involves studying various data points, including financial statements, economic trends, industry conditions, and market psychology.
How Can Retail Traders Analyze the Indian Stock Market Effectively?
Retail traders can effectively analyze the Indian stock market by combining technical analysis for short-to-medium term price movements with fundamental analysis for long-term value assessment, while strictly adhering to risk management principles.
Understanding Market Participants and Sentiment
The Indian stock market, comprising exchanges like the NSE and BSE, is influenced by a diverse range of participants, including domestic institutional investors (DIIs), foreign institutional investors (FIIs), mutual funds, high-net-worth individuals (HNIs), and retail investors. Understanding their actions and prevailing market sentiment is crucial. For instance, consistent buying by DIIs often signals confidence, potentially driving prices up, while large FII outflows can indicate caution or a shift in global risk appetite.
Market sentiment can be gauged through various indicators: news flow, analyst ratings, social media trends, and Fear & Greed Index readings. Positive sentiment often correlates with bullish market trends, while negative sentiment can precede corrections. Monitoring the Net Open Interest (NOPI) in derivatives markets also provides insights into institutional positioning and future expectations.
The Power of Technical Analysis
Technical analysis involves studying historical price charts and trading volumes to identify patterns and predict future price movements. It operates on the principle that market history tends to repeat itself and that all known information is already reflected in the price. For Indian traders, mastering key technical indicators is paramount.
Key Technical Indicators for Indian Markets
- Moving Averages (MAs): Simple Moving Average (SMA) and Exponential Moving Average (EMA) help identify trends and potential support/resistance levels. Crossovers, like the 50-day MA crossing above the 200-day MA (a ‘golden cross’), are often seen as bullish signals.
- Relative Strength Index (RSI): An oscillator measuring the speed and change of price movements. RSI values above 70 suggest an overbought condition, while values below 30 indicate an oversold condition.
- MACD (Moving Average Convergence Divergence): A trend-following momentum indicator that shows the relationship between two moving averages of a security’s price. Bullish crossovers and divergence can signal potential trend changes.
- Volume: High trading volume accompanying a price move adds conviction to the trend. A breakout on high volume is considered more significant than one on low volume.
- Support and Resistance Levels: These are price zones where buying pressure (support) or selling pressure (resistance) is expected to be strong enough to reverse or pause a price trend.
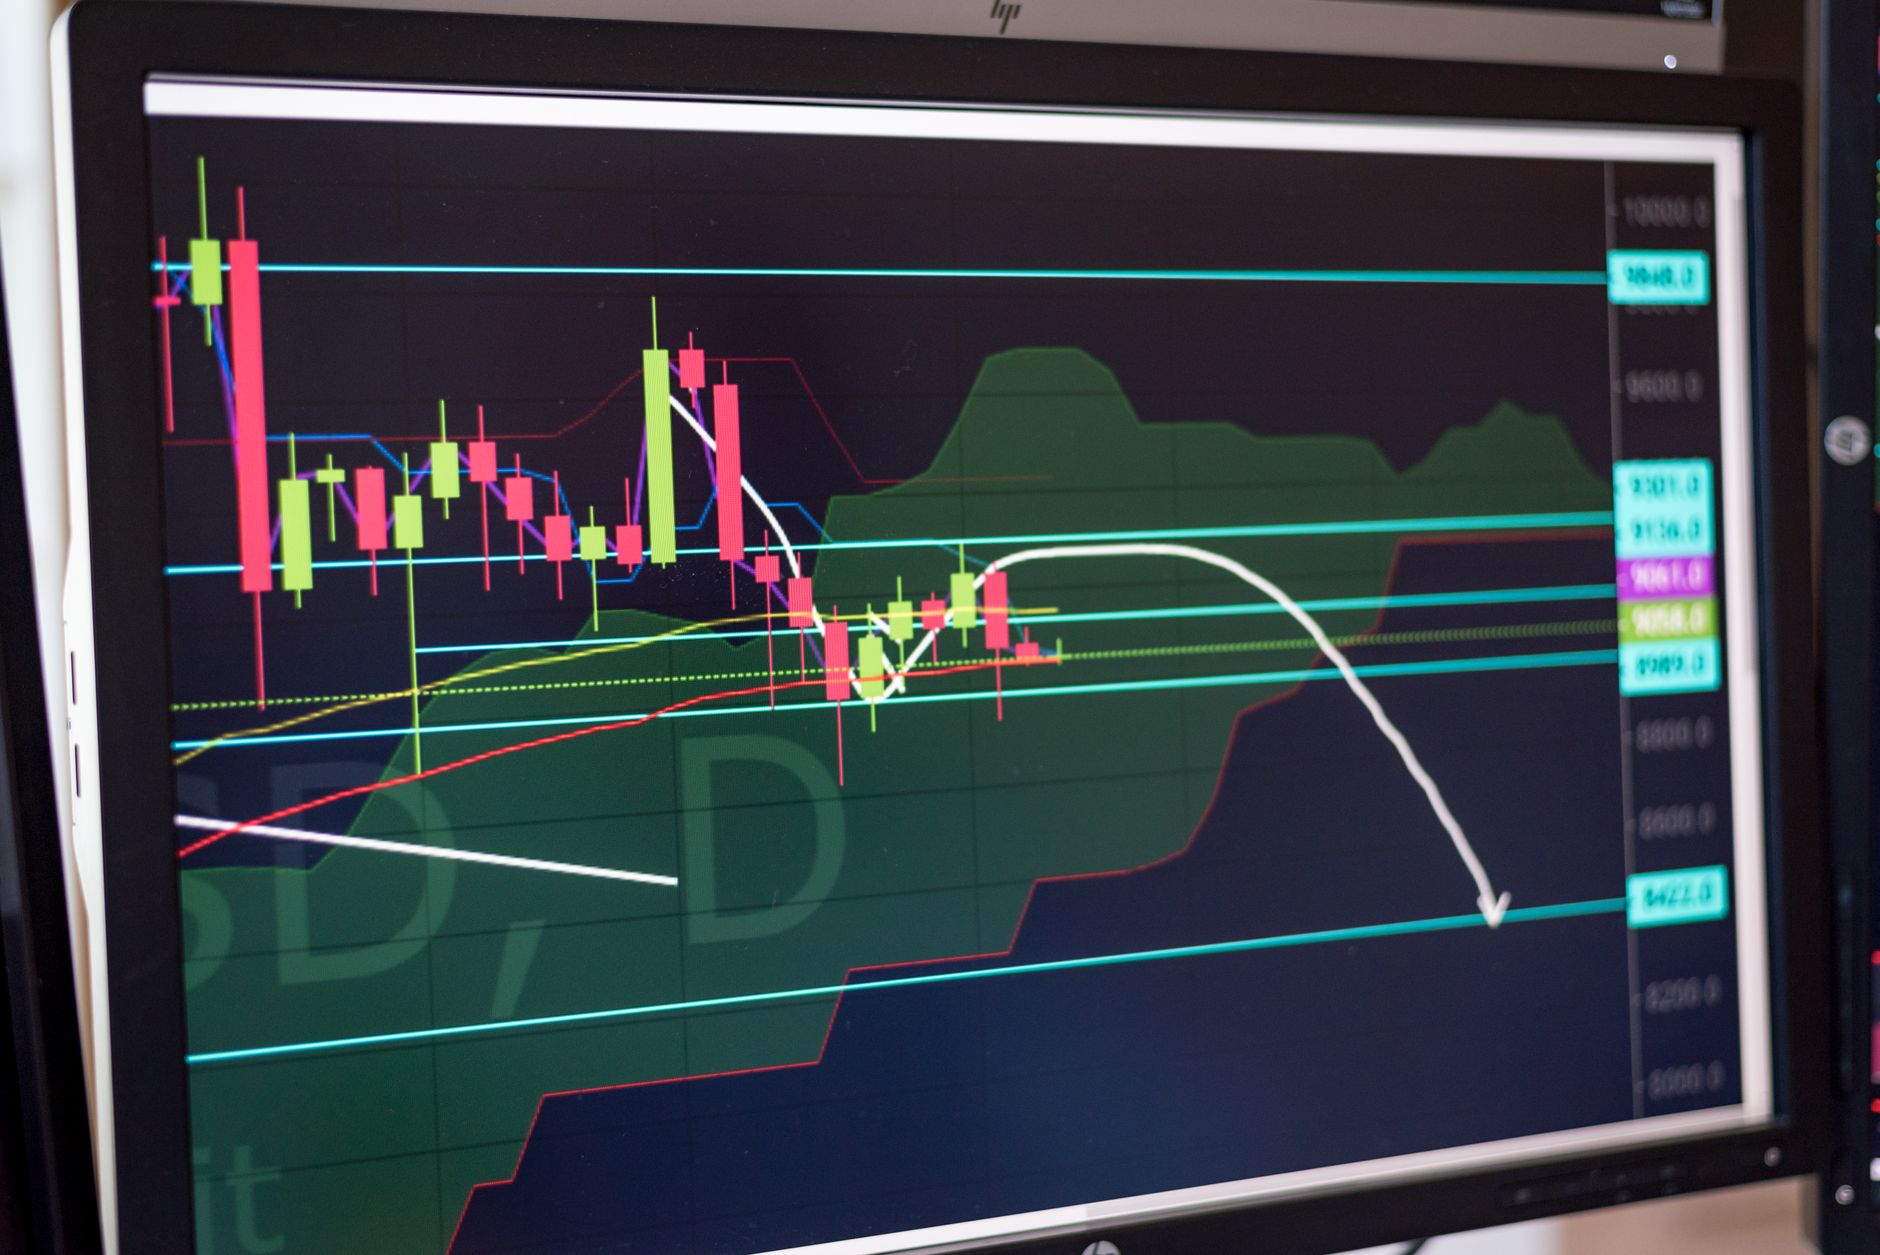
Finovatives.com offers a powerful TradingView indicator that consolidates many of these essential technical tools, helping traders identify high-probability setups on NSE and BSE stocks.
Harnessing Fundamental Analysis
Fundamental analysis focuses on evaluating a company’s intrinsic value by examining its financial health, management, competitive position, and the overall economic environment. This approach is vital for long-term investors seeking to identify undervalued stocks.
Key Aspects of Fundamental Analysis
- Financial Statements: Analyzing the Balance Sheet, Income Statement, and Cash Flow Statement to assess profitability, debt levels, and cash generation. Key ratios include Earnings Per Share (EPS), Price-to-Earnings (P/E) ratio, Debt-to-Equity (D/E) ratio, and Return on Equity (ROE).
- Economic Indicators: Monitoring macroeconomic factors like GDP growth, inflation rates (CPI), interest rates set by the RBI, and government policies, as these significantly impact overall market performance and specific sectors.
- Industry Analysis: Understanding the growth prospects, competitive landscape, and regulatory environment of the industry in which a company operates.
- Management Quality: Assessing the track record, integrity, and strategic vision of a company’s management team.
- Valuation Metrics: Comparing a company’s current stock price to its intrinsic value using methods like Discounted Cash Flow (DCF) analysis, P/E ratios relative to industry peers and historical averages, and Book Value.
The Crucial Role of Risk Management
Even the most sophisticated analysis is incomplete without robust risk management. Protecting capital is paramount in trading and investing. SEBI regulations also emphasize investor protection through various means.
Key Risk Management Techniques
- Stop-Loss Orders: Predetermined price points at which a losing trade is automatically closed to limit potential losses. Essential for every trade.
- Position Sizing: Determining the appropriate number of shares or contracts to trade based on risk tolerance and account size. A common rule is to risk no more than 1-2% of total capital on any single trade.
- Diversification: Spreading investments across different asset classes (equity, debt, gold), sectors, and geographies to reduce overall portfolio risk.
- Risk-Reward Ratio: Ensuring that the potential profit of a trade significantly outweighs the potential loss. A typical target is a ratio of 2:1 or higher.
- Emotional Discipline: Avoiding impulsive decisions driven by fear or greed. Sticking to a pre-defined trading plan is critical.
How to Develop a Trading Strategy for the Indian Market
Developing a successful trading strategy requires a structured approach, blending analytical tools with personal risk tolerance and market understanding.
- Define Your Goals & Time Horizon: Are you a day trader, swing trader, or long-term investor? Your objective dictates the type of analysis and strategy you’ll employ.
- Choose Your Analytical Tools: Decide whether to focus on technical analysis, fundamental analysis, or a combination. Select specific indicators or valuation methods you are comfortable with.
- Backtest Your Strategy: Use historical data to test how your chosen strategy would have performed in the past. This helps identify potential flaws and refine parameters. Consider using tools that offer backtesting capabilities.
- Incorporate Risk Management: Integrate stop-loss levels, position sizing rules, and profit targets into your strategy from the outset. Never trade without a plan to protect your capital.
- Develop Entry and Exit Rules: Clearly define the specific conditions under which you will enter a trade and the conditions under which you will exit, whether for profit or loss.
- Paper Trade (Simulate): Practice your strategy in a simulated environment using virtual money before committing real capital. This is crucial for gaining confidence and identifying practical issues. Finovatives.com offers a free trial for you to test your strategies.
- Review and Adapt: Regularly review your trading performance. Identify what worked, what didn’t, and make necessary adjustments to your strategy based on market conditions and your results.
Key Market Drivers in India
Several factors uniquely influence the Indian stock market. Understanding these drivers helps in making more accurate predictions and strategic decisions.
Monsoon and Agricultural Output
India’s economy is significantly linked to its agricultural sector. A good monsoon typically leads to better crop yields, boosting rural incomes and demand for consumer goods, positively impacting sectors like FMCG and automobiles. Conversely, a poor monsoon can dampen economic sentiment and impact inflation.
Government Policies and Reforms
Initiatives like ‘Make in India’, infrastructure development projects, and tax reforms announced by the government can create substantial opportunities for specific sectors. For instance, policies promoting renewable energy boost companies in that space. Monitoring upcoming budget announcements and policy changes is essential.
Global Economic Trends
As India integrates further into the global economy, international factors play a more significant role. Global interest rate changes, commodity price fluctuations (especially crude oil, a major import for India), and geopolitical events can impact FII flows and domestic market sentiment.
Corporate Earnings Season
Quarterly results announced by listed companies are a major catalyst for stock price movements. Strong earnings growth, improved profit margins, and positive future guidance often lead to stock price appreciation, while disappointments can trigger sharp sell-offs.
Inflation and Interest Rates
The Reserve Bank of India (RBI) manages monetary policy, primarily focusing on inflation control. High inflation often leads to interest rate hikes, making borrowing more expensive for companies and potentially slowing economic growth, which can be bearish for the stock market. Conversely, falling inflation might allow for rate cuts, stimulating growth.
Frequently Asked Questions
What is the most important aspect of stock market analysis?
While technical and fundamental analysis are crucial, effective risk management is arguably the most important aspect for long-term success, as it protects capital from significant losses.
Should I focus more on technical or fundamental analysis?
It depends on your trading style. Short-term traders often rely more on technical analysis, while long-term investors focus on fundamental analysis. A combination is often most effective.
How often should I review my portfolio?
For active traders, daily or weekly reviews are common. Long-term investors might review their portfolio quarterly or semi-annually, adjusting for significant market or company changes.
What is a good risk-reward ratio for a trade?
A risk-reward ratio of 1:2 or higher is generally considered good. This means your potential profit is at least twice your potential loss.
How do I start analyzing stocks on NSE and BSE?
Begin by understanding basic financial statements and key technical indicators. Utilize resources from NSE India, BSE India, and reputable financial websites, and consider using charting platforms like TradingView.
What is SEBI’s role in market analysis?
SEBI regulates the market to ensure fair practices and investor protection. While it doesn’t perform analysis itself, its regulations influence market behavior and provide a framework for transparent operations.
Key Takeaways
- Indian stock market analysis requires integrating technical indicators, fundamental valuation, and sentiment analysis.
- Risk management, including stop-losses and position sizing, is paramount for capital preservation.
- Government policies, global trends, and corporate earnings are significant drivers of the Indian market.
- A well-defined trading strategy, regularly reviewed and adapted, is essential for consistent performance.
- Understanding market participants (FIIs, DIIs) and their actions provides valuable insights.
- Utilizing tools like TradingView indicators can streamline the analysis process.
Disclaimer: Investing in the stock market involves inherent risks. Please consult with a qualified financial advisor before making any investment decisions.





 Finovatives