TL;DR: Fibonacci Retracement uses specific ratios derived from the Fibonacci sequence to predict where a price trend might pause or reverse, helping Indian traders identify potential support and resistance levels for better entry and exit strategies.
Key Stats at a Glance:
- Nifty 50 average daily trading volume: Over ₹10,000 Crores
- BSE Sensex market capitalization: Exceeds $4 Trillion (as of early 2024)
- Key Fibonacci retracement levels: 23.6%, 38.2%, 50%, 61.8%, 78.6%
- Indian stock market growth: Consistent double-digit returns in select periods over the last decade.
- SEBI mandates: Strict regulations ensuring fair trading practices on NSE and BSE.
What is Fibonacci Retracement?
Fibonacci Retracement is a technical analysis tool that draws horizontal lines at potential support and resistance levels based on the mathematical Fibonacci sequence, helping traders anticipate price corrections within a larger trend.
Fibonacci numbers, famously discovered by Leonardo Fibonacci, appear surprisingly often in nature and financial markets. The sequence starts with 0 and 1, and each subsequent number is the sum of the two preceding ones (0, 1, 1, 2, 3, 5, 8, 13, 21, 34…). Derived from this sequence are key ratios like 0.382, 0.500, and 0.618, which form the basis of the retracement tool. Indian traders use these ratios to identify potential levels where a stock’s price, after moving significantly in one direction, might pull back (retrace) before continuing its original trend or reversing. The most commonly used levels are 23.6%, 38.2%, 50%, 61.8%, and 78.6%. These levels aren’t magic numbers but rather areas where a significant number of traders might place orders, thus influencing price action due to increased buying or selling pressure.
How can Indian traders use Fibonacci Retracement?
Indian traders leverage Fibonacci Retracement to pinpoint potential support levels during an uptrend and resistance levels during a downtrend, guiding their entry, exit, and stop-loss placements.
The primary application for traders on the NSE and BSE is to identify potential turning points. In an uptrend, after a stock price has risen substantially, traders look for a pullback to a Fibonacci retracement level (e.g., 38.2% or 61.8%) as a potential buying opportunity. Conversely, in a downtrend, a rally towards a retracement level might signal a good point to initiate a short position or take profits on existing long positions. The 50% retracement level, while not a true Fibonacci ratio, is often watched closely as it represents a simple half-way retracement. The 61.8% level, often called the ‘Golden Ratio’, is particularly significant and frequently acts as a strong support or resistance. It’s crucial to remember that Fibonacci levels work best in conjunction with other technical indicators and chart patterns, not in isolation. For instance, a confluence of a Fibonacci level with a moving average or a trendline can strengthen its significance.
Identifying Support in an Uptrend
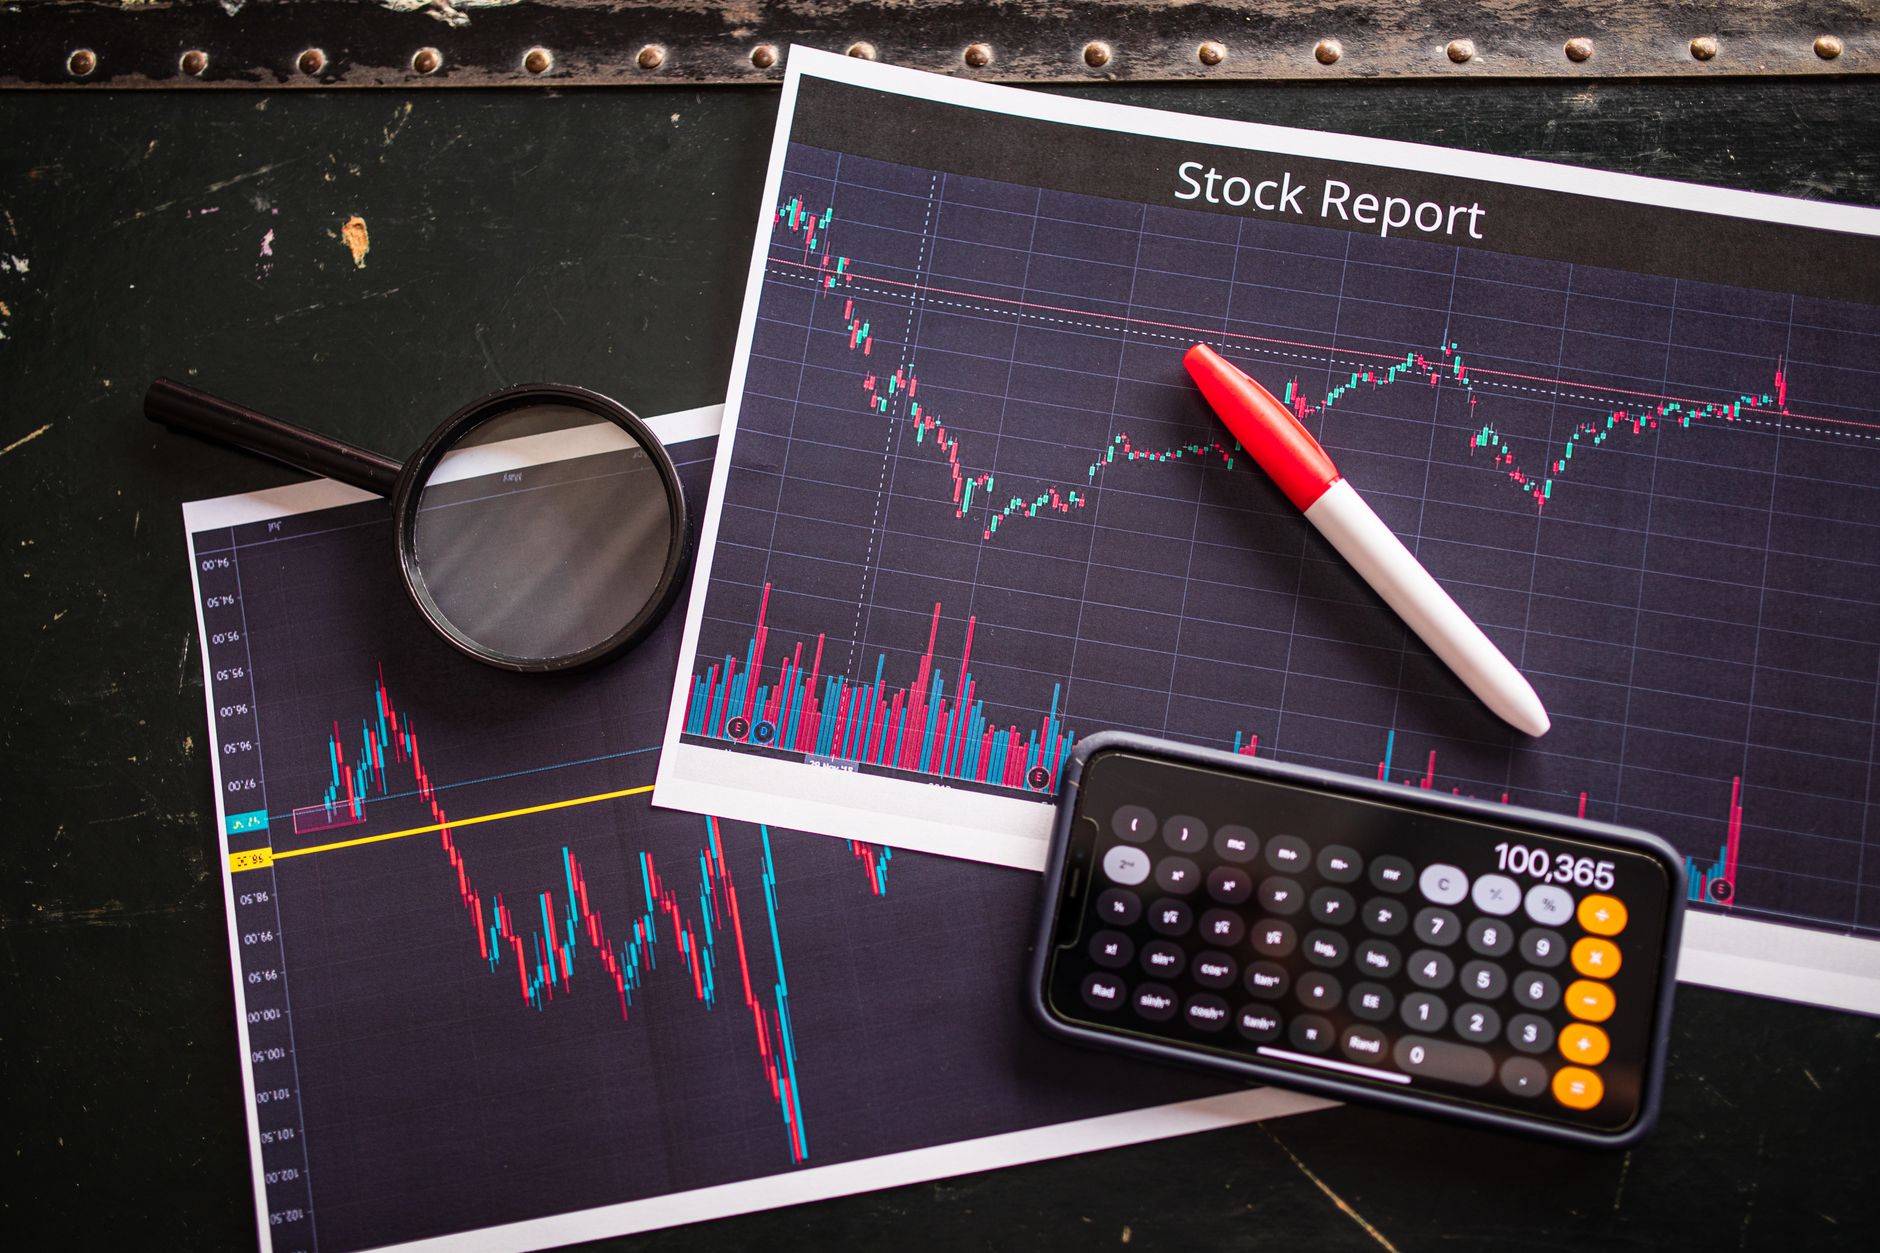
During a strong uptrend, traders identify a significant price swing from a low point (A) to a high point (B). They then apply the Fibonacci retracement tool to this swing. The horizontal lines generated at the key ratios (e.g., 38.2%, 50%, 61.8%) represent potential support levels where the price might consolidate or bounce before resuming the uptrend. A trader might look to enter a long position near one of these support levels, placing a stop-loss just below it.
Identifying Resistance in a Downtrend
Conversely, in a downtrend, traders identify a price swing from a high point (A) to a low point (B). The Fibonacci retracement levels drawn on this swing indicate potential resistance points where the price might stall or reverse downwards. A trader might consider initiating a short position or booking profits on a long position as the price approaches these resistance levels, placing a stop-loss just above them.
The Significance of the 61.8% (Golden Ratio)
The 61.8% retracement level holds particular importance in Fibonacci analysis. It’s derived from the Golden Ratio and often acts as a critical support in uptrends or resistance in downtrends. Many traders watch this level very closely, and its breach can signal a significant shift in market sentiment or the potential end of the current trend.
How to Apply Fibonacci Retracement on Trading Platforms
Applying Fibonacci Retracement on trading platforms like TradingView, Zerodha Kite, or Upstox Pro is straightforward and can significantly enhance your technical analysis for Indian equities and derivatives.
- Identify a Significant Price Swing: First, locate a clear and substantial price movement on your chart – either an uptrend from a trough to a peak, or a downtrend from a peak to a trough.
- Select the Fibonacci Retracement Tool: Find the Fibonacci Retracement tool in your trading platform’s drawing toolbar. It’s usually grouped with other drawing tools.
- Draw the Levels: Click on the starting point of your identified price swing (e.g., the low of an uptrend) and drag your cursor to the ending point (e.g., the high of the uptrend). Release the mouse button.
- Observe the Retracement Lines: The platform will automatically draw horizontal lines at the standard Fibonacci ratios (23.6%, 38.2%, 50%, 61.8%, 78.6%) between your start and end points.
- Interpret the Levels: Look for where the current price action is interacting with these levels. These are your potential support (in an uptrend pullback) or resistance (in a downtrend rally) zones.
- Add Confluence: Consider combining Fibonacci levels with other indicators like moving averages, RSI, or MACD, or with chart patterns (like support/resistance zones) to confirm potential trading signals.
- Set Stop-Loss and Targets: Use the Fibonacci levels to define logical stop-loss points (just below support in an uptrend, just above resistance in a downtrend) and potential price targets.
Fibonacci Extensions: Beyond Retracements
While retracements help identify pullback levels, Fibonacci extensions project potential price targets beyond the initial price swing, offering insights into how far a trend might extend.
Fibonacci extensions are calculated using ratios derived from the Fibonacci sequence, projecting levels beyond the initial price move. Common extension levels include 127.2%, 161.8%, and 261.8%. Traders use these levels to set profit targets. For example, after a strong uptrend and a subsequent retracement, if the price starts moving upwards again, traders might look to the 1.618 extension level as a potential target for taking profits. These extensions are drawn by identifying a three-point swing (e.g., low-high-low for an uptrend) and projecting future levels. Like retracements, extensions work best when confirmed by other technical analysis tools and market conditions. They provide an additional layer of analysis for setting more ambitious profit goals.

Limitations and Best Practices for Indian Traders
While powerful, Fibonacci tools are not infallible and require careful application alongside other analytical methods and risk management principles.
It’s crucial for Indian traders to understand that Fibonacci levels are not guaranteed reversal points; they are areas of probability. Market sentiment, news events, and broader economic factors can easily override these technical levels. Therefore, relying solely on Fibonacci retracements can be risky. Best practices include: always using Fibonacci tools on higher timeframes (daily, weekly) for more reliable signals; confirming Fibonacci levels with other indicators (e.g., moving averages, RSI divergence); practicing proper risk management by setting appropriate stop-losses; and understanding that the 50% level isn’t a Fibonacci ratio but is widely watched. Remember to backtest any strategy involving Fibonacci tools on historical data before implementing it with real capital on the NSE or BSE. Using a robust TradingView indicator can also help automate the drawing and analysis process.
Frequently Asked Questions
What are the main Fibonacci ratios used in trading?
The most commonly used Fibonacci retracement ratios are 23.6%, 38.2%, 50%, 61.8%, and 78.6%. The 61.8% level is often referred to as the Golden Ratio.
Can Fibonacci Retracement predict exact price points?
No, Fibonacci Retracement indicates potential support and resistance zones, not exact price points. It suggests areas where price might react, but confirmation from other indicators is advisable.
Is Fibonacci Retracement effective in volatile markets like crypto?
Yes, Fibonacci tools can be effective in volatile markets like cryptocurrencies, but their reliability might decrease. It’s crucial to use them with tighter stop-losses and in conjunction with other analysis methods.
When should I use Fibonacci Retracements versus Extensions?
Use Retracements to identify potential pullback levels within a trend. Use Extensions to project potential profit targets beyond the initial price move, anticipating how far a trend might continue.
How does the 50% retracement level differ from others?
The 50% level isn’t derived from the Fibonacci sequence itself but is widely watched because it represents a halfway retracement. Its significance is often enhanced by the fact that many traders pay close attention to it.
What are Fibonacci time zones?
Fibonacci time zones are another tool that uses Fibonacci numbers to predict potential turning points in time, rather than price. They are plotted vertically on a chart to identify periods where significant price changes might occur.
Key Takeaways
- Fibonacci Retracement uses key ratios (23.6%, 38.2%, 50%, 61.8%, 78.6%) to identify potential support and resistance levels.
- It helps Indian traders anticipate price pullbacks in trending markets for better entry and exit decisions.
- The 61.8% level (Golden Ratio) is particularly significant and often acts as a crucial turning point.
- Fibonacci Extensions are used to project potential price targets beyond the initial move.
- Always use Fibonacci tools in conjunction with other technical indicators and robust risk management.
- Practice and confirmation are key to effectively applying Fibonacci analysis in the Indian stock market.
Trading in the securities market is subject to market risks. Read all the related documents carefully before investing.





 Finovatives