TL;DR: Market breadth indicators measure the extent of participation in a market trend, helping traders identify potential reversals or confirm existing trends by analysing the number of advancing vs. declining stocks.
Key Stats at a Glance:
- The Advance-Decline Line (A-D Line) is one of the oldest breadth indicators, dating back to the 1920s.
- A reading above 70-80% on an Advance-Decline Ratio often suggests an overbought market.
- The McClellan Oscillator can signal extreme overbought conditions when it moves above +100.
- The New Highs-New Lows Index (NHNL) aims to capture the strength of new price momentum.
- Nifty 50 has seen significant participation from various sectors, reflecting broad market health at times.
What are Market Breadth Indicators?
Market breadth indicators offer a bird’s-eye view of the stock market’s underlying strength by analysing the number of stocks participating in a particular move, rather than just the price index itself.
In essence, they tell you if a rally is broad-based, involving many stocks, or narrow, driven by just a few heavyweights. Similarly, they can signal if a decline is widespread or concentrated. This distinction is vital for traders and investors looking to understand the true health and sustainability of market trends.
Think of it like this: if the Nifty 50 is making new highs, but only a handful of large-cap stocks are pushing it up while most other stocks are declining, that’s a sign of weakening breadth. This divergence can often precede a market correction. Conversely, a market where a large number of stocks are advancing alongside the index suggests robust underlying demand and a potentially sustainable uptrend.
Understanding market breadth is akin to understanding the collective pulse of the market. It complements price action analysis by providing context and helping to avoid being misled by index movements that don’t reflect the broader economic or investor sentiment.
How do Market Breadth Indicators Work?
Market breadth indicators function by comparing the number of stocks that have advanced (gone up in price) against those that have declined (gone down in price) over a specific period, or by looking at the cumulative difference between advancers and decliners.
The fundamental principle is that a healthy uptrend should see more stocks participating on the upside than on the downside, and a healthy downtrend should see more stocks participating on the downside. When the price index and the breadth indicators diverge, it signals a potential trend exhaustion or reversal.
For instance, if the Nifty 50 is rising, but the number of advancing stocks is consistently falling or is lower than the number of declining stocks, this divergence suggests that the rally is losing steam and might be vulnerable to a pullback. This is a classic bearish divergence.
Conversely, if the Nifty 50 is falling, but the number of declining stocks is decreasing while advancing stocks are increasing, this could signal that the selling pressure is abating and a potential bottom is forming. This is a classic bullish divergence.
Key Market Breadth Indicators
1. Advance-Decline Line (A-D Line)
The Advance-Decline Line is perhaps the most fundamental breadth indicator. It’s calculated by taking the difference between the number of advancing stocks and declining stocks each day and adding it to the previous day’s total. A rising A-D Line generally confirms an uptrend, while a falling line confirms a downtrend. Divergences between the A-D Line and the market index are closely watched for potential trend changes.
2. Advance-Decline Ratio (A-D Ratio)
The A-D Ratio is a simpler measure, calculated by dividing the number of advancing stocks by the number of declining stocks for a given period. A ratio above 1 indicates more advancers than decliners, and a ratio below 1 indicates more decliners. Extreme readings, such as a ratio consistently above 3:1 or below 1:3, can suggest overbought or oversold conditions respectively.
3. New Highs-New Lows Index (NHNL)
This indicator focuses on the momentum of new highs and new lows. It is typically calculated by dividing the number of stocks making new 52-week highs by the total number of stocks making either new highs or new lows. A rising NHNL index suggests strong bullish momentum, while a falling index indicates weakening momentum. Readings above 0.7 or 0.8 are often considered bullish, while readings below 0.2 or 0.3 are considered bearish.
4. McClellan Oscillator and Summation Index
Developed by Sherman and Marian McClellan, these indicators analyse the daily difference between advancing and declining issues. The Oscillator is a short-to-intermediate term indicator, while the Summation Index is a long-term indicator derived from the Oscillator. High positive readings on the Oscillator (e.g., above +70) or the Summation Index signal strong buying pressure, while significant negative readings signal strong selling pressure. Divergences are key signals for potential reversals.
5. Percentage of Stocks Above Moving Averages
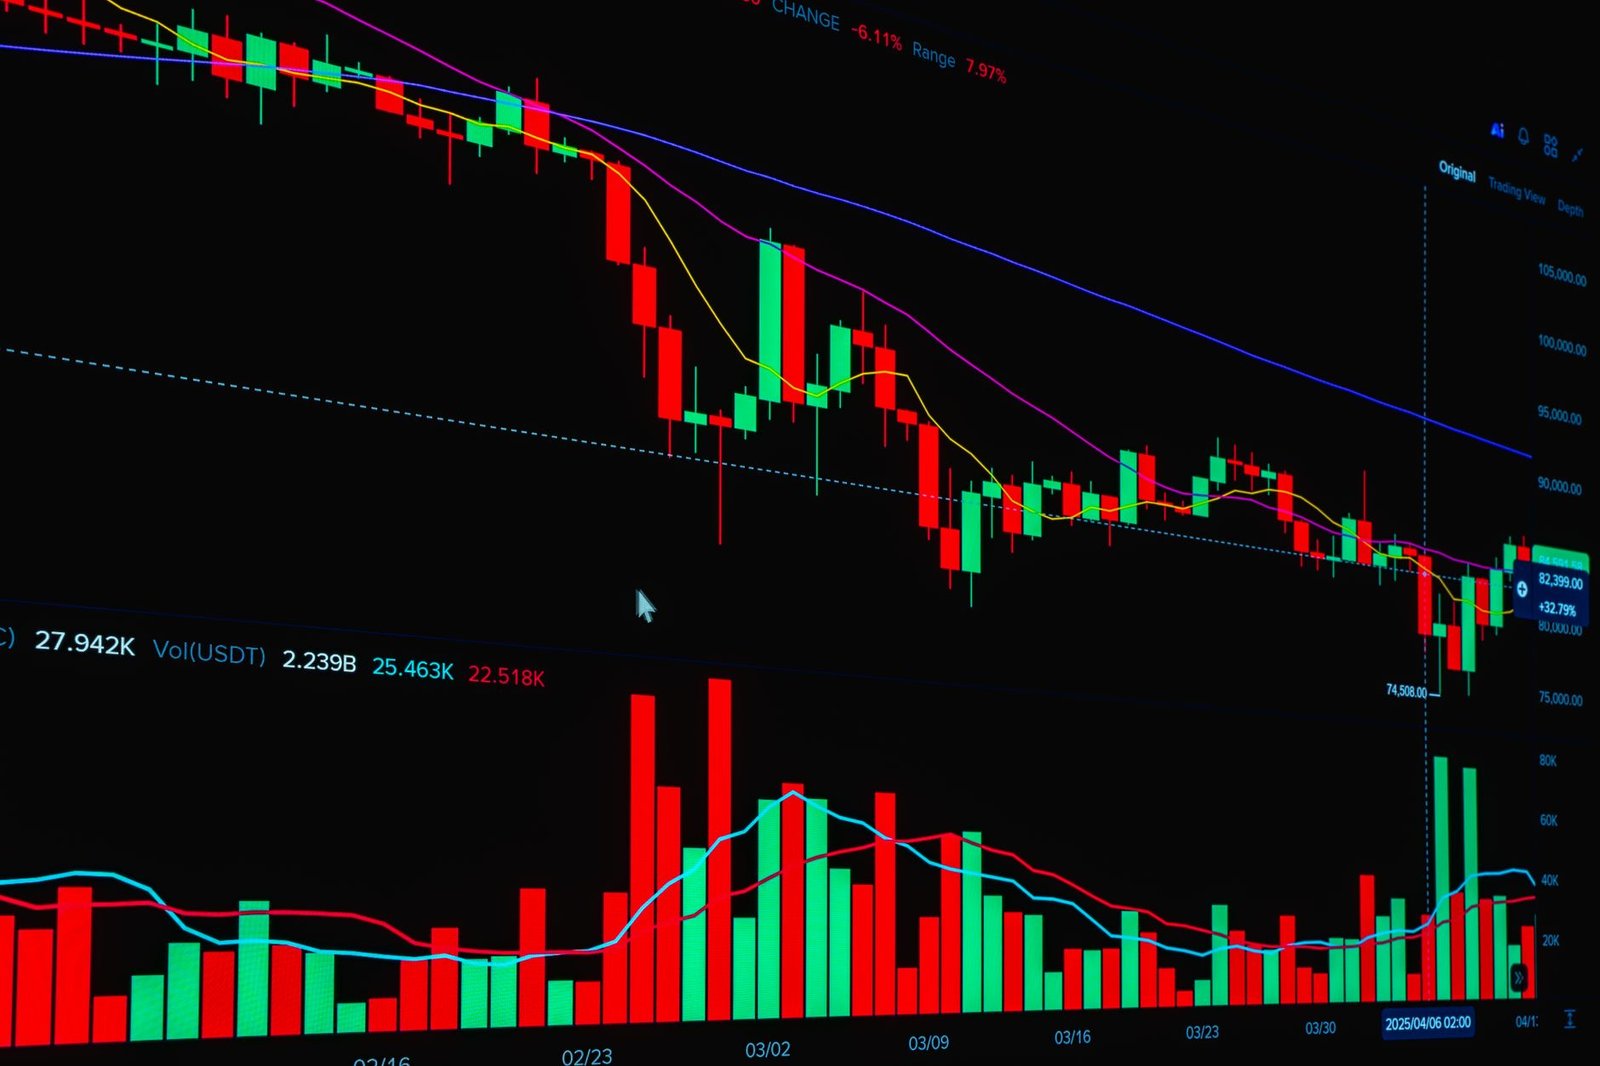
This indicator measures the percentage of stocks in a given index (like the Nifty 50 or BSE Sensex) that are trading above their certain moving averages, such as the 50-day or 200-day moving average. A high percentage (e.g., over 80%) suggests broad participation in an uptrend, indicating a healthy market. Conversely, a low percentage (e.g., below 20%) indicates widespread weakness. Readings can help identify overbought or oversold conditions.
How to Use Market Breadth Indicators for Trading Decisions
Incorporating market breadth indicators into your trading strategy can significantly enhance your decision-making process. They provide a reality check on index movements and can help you identify trade opportunities or avoid traps.
- Start with a Reliable Data Source: Ensure you have access to accurate daily data for advancing stocks, declining stocks, unchanged stocks, new highs, and new lows for the Indian markets (NSE & BSE). Many financial portals and charting platforms provide this.
- Calculate or Access Key Indicators: Choose 1-2 core breadth indicators that resonate with your trading style, such as the Advance-Decline Line or the Percentage of Stocks Above 50-Day Moving Average. Utilize readily available indicators on platforms like TradingView, or calculate them manually/via custom scripts if you’re comfortable.
- Identify Trend Confirmation: Look for confirmation between the price action of the index (e.g., Nifty 50) and your chosen breadth indicators. If the index is making new highs and the breadth indicators are also showing strength (e.g., A-D Line rising, more stocks above their MAs), it confirms the uptrend’s robustness.
- Spot Divergences for Reversals: This is where breadth indicators shine. If the Nifty 50 is making a new high but the A-D Line is making a lower high, or the percentage of stocks above their MAs is declining, it signals a bearish divergence, suggesting the uptrend may be weakening and a correction could be imminent. The opposite applies for bullish divergences during downtrends.
- Gauge Market Extremes: Use indicators like the A-D Ratio or the McClellan Oscillator to identify potential overbought or oversold conditions. Extremely high readings might suggest caution is needed before entering new long positions, while extremely low readings might signal a buying opportunity.
- Combine with Other Tools: Market breadth indicators are most effective when used in conjunction with other technical analysis tools, such as price patterns, volume analysis, and support/resistance levels. They are not standalone signals but provide a crucial layer of analysis. Consider using a comprehensive TradingView indicator that integrates breadth analysis.
- Backtest Your Strategy: Before deploying real capital, backtest how your chosen breadth indicators and trading rules have performed historically. This helps refine your approach and build confidence.
- Manage Risk: Always implement strict risk management techniques, such as setting stop-losses, regardless of the signals generated by breadth indicators.
When to Use Market Breadth Indicators
Market breadth indicators are versatile tools that can be applied across different market conditions and trading timeframes. They are particularly useful during periods of consolidation, when price action alone might be confusing, or when seeking to confirm the strength of a breakout or breakdown.
They are invaluable for identifying potential trend reversals before they become obvious in the price charts. By understanding the participation level of stocks, traders can gain an edge in anticipating market shifts. For instance, if a stock market index is hovering around its all-time high, but the breadth indicators are showing a sharp deterioration, it might be prudent to reduce long exposure or look for shorting opportunities.
Conversely, during a steep market decline, if breadth indicators start showing signs of improvement (fewer stocks making new lows, more stocks participating in small rallies), it could signal that the worst is over and a potential bottom is forming. This allows traders to position themselves for the eventual recovery.

These indicators are also helpful in assessing the overall sentiment. A market with strong positive breadth often reflects growing investor confidence and willingness to take on risk, while weak breadth can indicate fear and a flight to safety. This sentiment analysis is crucial for making informed trading decisions, especially in volatile Indian markets.
Frequently Asked Questions
What is the most important market breadth indicator?
While subjective, the Advance-Decline Line (A-D Line) is often considered the most fundamental and important breadth indicator due to its long history and direct representation of overall market participation.
Can market breadth indicators predict the future?
No indicator can perfectly predict the future. Market breadth indicators provide probabilities and insights into current market health, helping to anticipate potential moves rather than guaranteeing them.
How often should I check market breadth?
For active traders, checking daily breadth data is recommended. For longer-term investors, weekly or even monthly checks might suffice, depending on their strategy and market volatility.
Are market breadth indicators useful for individual stocks?
While primarily used for indices, breadth concepts can be adapted. For example, analysing the percentage of stocks in a specific sector that are above their 50-day moving average can offer insights into that sector’s health.
What is a bearish divergence in market breadth?
A bearish divergence occurs when a market index makes a new high, but a breadth indicator (like the A-D Line) fails to make a new high or makes a lower high, signalling weakening underlying participation.
How do I find market breadth data for NSE and BSE?
Data for advancing/declining stocks, new highs/lows, etc., for NSE and BSE is typically available on major financial news websites, stock market analysis portals, and charting platforms like TradingView.
Key Takeaways
- Market breadth indicators measure the participation of stocks in a market trend, providing insights beyond simple price action.
- Key indicators include the Advance-Decline Line, Advance-Decline Ratio, New Highs-New Lows Index, McClellan Oscillator, and Percentage of Stocks Above Moving Averages.
- Divergences between breadth indicators and price indices are crucial signals for potential trend reversals.
- Strong breadth confirms uptrends, while weak breadth suggests downtrends are healthy; divergences signal potential weakness.
- These indicators help identify overbought/oversold conditions and gauge the overall market sentiment.
- For best results, combine breadth analysis with other technical tools and always manage risk diligently.
- Consider exploring advanced tools, such as a powerful TradingView indicator designed for Indian markets, to integrate breadth analysis seamlessly into your workflow.
Trading and investing in the stock market involve risks. Ensure you understand these risks before making any investment decisions.





 Finovatives