TL;DR: Positional trading in India is a strategy where traders hold positions for weeks to months to capture significant price trends, requiring a blend of technical and fundamental analysis to maximize profits while managing risk effectively.
Key Stats at a Glance:
- Nifty 50 Historical Average Annual Return: ~12%
- Typical Positional Trade Holding Period: 3 weeks to 6 months
- NSE listed companies: Over 2,000
- BSE listed companies: Over 5,000
- Average stop-loss hit rate for positional traders: 25-30%
What is Positional Trading?
Positional trading is a trading strategy that aims to capture gains over a period of several weeks to several months, holding positions long enough to benefit from medium-to-long-term price trends.
This approach sits between the short-term focus of day trading and the long-term buy-and-hold strategy of traditional investing. Positional traders typically use a combination of technical and fundamental analysis to identify potential trends. They are not concerned with short-term market noise or daily fluctuations, instead focusing on the larger price movements. The goal is to ride a significant trend until it shows signs of reversing, thereby maximizing profit from each trade. This strategy often involves using charts and indicators to identify entry and exit points, as well as setting appropriate stop-losses to manage downside risk. Indian markets, with their inherent volatility and potential for sustained trends, offer fertile ground for this strategy.
Why Choose Positional Trading for Indian Markets?
Positional trading offers an attractive balance for Indian retail traders by allowing them to capitalize on significant market trends without the constant time commitment of day trading and benefiting from potentially larger profit margins than short-term strategies.
The Indian stock market, characterized by its dynamic nature and often pronounced trends driven by economic factors, policy changes, and global events, presents numerous opportunities for positional traders. Unlike intraday trading, which requires continuous monitoring and quick decision-making, positional trading allows for a more relaxed pace. Traders can allocate their time to research, analysis, and position management without needing to be glued to their screens. Furthermore, the potential for capturing multi-week or multi-month trends can lead to substantial profits per trade, often exceeding what can be achieved through shorter-term strategies. This makes it particularly suitable for working professionals or those who cannot dedicate full-time attention to trading. The psychological aspect is also a benefit; fewer trades mean less stress and fewer emotional decisions, provided a robust risk management framework is in place.
Capturing Medium-Term Trends
Positional traders focus on identifying and riding price trends that typically last for several weeks to a few months. These trends are often formed by significant shifts in market sentiment, economic news, or sector-specific developments.
Reduced Trading Frequency
This strategy involves fewer trades compared to day trading or swing trading, leading to lower brokerage costs and less decision fatigue.
Time Efficiency
It is ideal for individuals with other commitments, such as full-time jobs, as it requires less screen time and active monitoring.
Potential for Higher Profits Per Trade
By holding positions for longer durations, positional traders can aim to capture larger price movements, leading to more significant profits on successful trades.
Balancing Technical and Fundamental Analysis
Effective positional trading often requires a blend of both technical indicators for timing entries/exits and fundamental analysis to confirm the underlying strength of a stock or trend.
While technical analysis is crucial for pinpointing optimal entry and exit points, understanding the fundamental reasons behind a stock’s movement can provide greater conviction and help filter out weaker opportunities. For instance, a positional trader might identify an uptrend using chart patterns and indicators, but would also look for positive earnings reports, sector tailwinds, or favourable economic news to support the trade. This dual approach allows traders to align their technical signals with the broader economic and corporate landscape, enhancing the probability of success. SEBI’s focus on investor awareness encourages such well-researched approaches.
How to Implement a Positional Trading Strategy
Implementing a successful positional trading strategy involves a systematic process of identifying opportunities, managing risk, and executing trades with discipline.
Success in positional trading hinges on a structured approach. It begins with defining clear objectives and risk tolerance. Then, selecting suitable stocks based on market trends and fundamental strength, followed by technical analysis to pinpoint entry points. Crucially, setting strict stop-losses and profit targets is essential. Monitoring positions and knowing when to exit are the final steps. For those exploring tools to aid this process, specialised TradingView indicators can offer valuable insights for identifying potential trend continuations or reversals. Moreover, understanding your risk appetite is paramount; positional trading, while potentially rewarding, involves holding risk over a longer period than intraday trades.
- Define Your Trading Plan: Establish clear goals, risk tolerance (e.g., maximum loss per trade), capital allocation, and preferred market conditions.
- Stock Selection: Identify stocks or indices showing potential for medium-term trends. Look for stocks with good liquidity and reasonable volatility, often those in trending sectors.
- Analysis: Use technical indicators (e.g., Moving Averages, MACD, RSI) to identify trend direction and potential entry/exit points. Supplement with fundamental analysis to understand the underlying business and industry outlook.
- Entry Strategy: Enter a trade when your analysis confirms a trend is likely to continue or a significant reversal is occurring. Wait for confirmation signals rather than jumping in prematurely.
- Risk Management: Always set a stop-loss order below a key support level for long positions (or above resistance for short positions) to limit potential losses. A common rule is to risk no more than 1-2% of your trading capital per trade.
- Position Sizing: Determine the number of shares to trade based on your stop-loss distance and the percentage of capital you are willing to risk.
- Monitoring and Trailing Stop-Loss: Periodically review your positions. As the trade moves in your favour, consider using a trailing stop-loss to lock in profits while allowing the trade to run.
- Exit Strategy: Exit the trade when your profit target is reached, the trend shows clear signs of reversal (e.g., breaking a key support/resistance level, bearish chart pattern), or your trailing stop-loss is triggered.

Key Technical Indicators for Positional Traders
Certain technical indicators are particularly effective for positional traders in identifying trends, momentum, and potential reversal points.
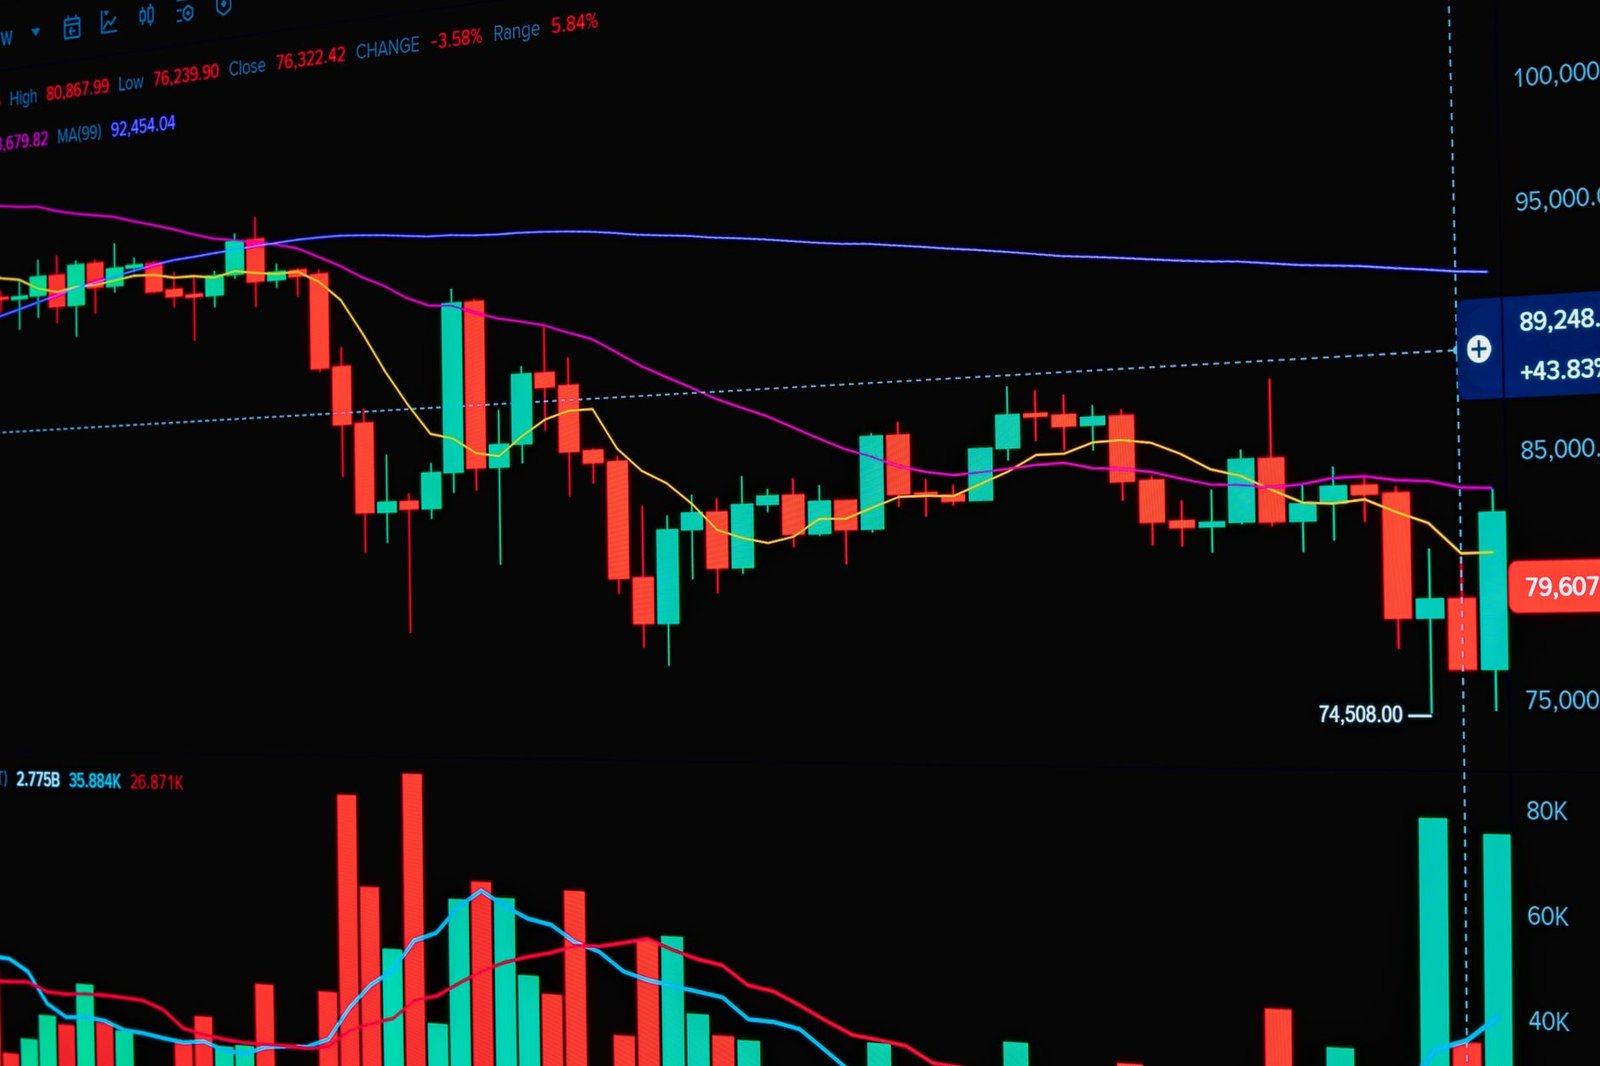
Positional traders leverage indicators that help filter out short-term noise and focus on the prevailing trend. Moving Averages (like the 50-day and 200-day) are fundamental for identifying the direction of the trend and potential support/resistance levels. The Moving Average Convergence Divergence (MACD) is excellent for spotting changes in momentum and potential trend reversals. The Relative Strength Index (RSI) helps gauge overbought or oversold conditions, which can signal potential turning points, though it’s best used in conjunction with trend indicators. Bollinger Bands can help identify periods of consolidation and potential breakouts. For more advanced insights, proprietary tools like the Trend Traders Tool can provide synthesized signals, helping traders stay ahead.
Moving Averages (MA)
Simple Moving Averages (SMA) and Exponential Moving Averages (EMA), especially the 50-day and 200-day, are used to determine the trend direction and identify support/resistance levels.
Moving Average Convergence Divergence (MACD)
This momentum indicator helps identify changes in the strength, direction, duration, and speed of a trend.
Relative Strength Index (RSI)
A momentum oscillator that measures the speed and change of price movements, used to identify overbought or oversold conditions.
Bollinger Bands
These bands represent volatility and can help identify potential price reversals and breakouts.
Volume Analysis
Increasing volume during a trend confirms its strength, while decreasing volume might signal weakening momentum.
Managing Risk in Positional Trading
Effective risk management is paramount in positional trading to protect capital and ensure long-term sustainability.
The core of successful positional trading lies in capital preservation. This is achieved primarily through the disciplined use of stop-loss orders. A stop-loss should be placed at a logical price level where the trade’s premise is invalidated, not just an arbitrary percentage. Position sizing is equally critical; it ensures that no single trade can inflict catastrophic damage on the portfolio, even if it moves against the trader. Diversification across different stocks and sectors can also mitigate unsystematic risk. Regular review of the trading plan and emotional control are also vital components of risk management, preventing impulsive decisions during adverse market movements.
The Importance of Stop-Loss Orders
Setting and adhering to stop-loss orders is non-negotiable for limiting potential losses on any given trade.
Position Sizing Rules
Determining the appropriate number of shares to trade based on risk tolerance and stop-loss level is crucial for capital preservation.
Avoiding Over-Trading
Resisting the temptation to trade too frequently, especially during periods of high volatility or uncertainty, is key to preserving capital.
Reviewing and Adjusting the Strategy
Periodically assessing the performance of the trading strategy and making necessary adjustments based on market conditions and personal experience is vital.
Frequently Asked Questions
What is the minimum capital required for positional trading in India?
There is no fixed minimum. However, considering brokerage, taxes, and the need for proper position sizing, a capital of ₹50,000 to ₹1,00,000 is often recommended for serious positional traders in India.
How long should one hold a positional trade?
Positional trades are typically held for a period ranging from a few weeks to several months, depending on the identified trend’s duration and the trader’s objectives.
Is positional trading suitable for beginners?
It can be, as it requires less screen time than day trading. However, beginners must thoroughly understand technical and fundamental analysis, and implement strict risk management from the outset.
What is the difference between positional trading and swing trading?
Positional trading focuses on longer-term trends (weeks to months), while swing trading aims to capture shorter-term price swings (days to weeks).
What are the biggest risks in positional trading?
The primary risks include unexpected market events causing sharp reversals, holding a losing position for too long, and the psychological pressure of managing trades over extended periods.
Can fundamental analysis be used alone for positional trading?
While fundamental analysis helps identify fundamentally strong stocks, technical analysis is generally required to time entries and exits effectively for positional trades.
Key Takeaways:
- Positional trading captures medium-to-long-term trends lasting weeks to months.
- It requires a blend of technical analysis for timing and fundamental analysis for conviction.
- Discipline in setting stop-losses and position sizing is crucial for risk management.
- Key indicators include Moving Averages, MACD, and RSI.
- It offers time efficiency compared to day trading, making it suitable for working professionals.
- Successful implementation requires a well-defined trading plan and periodic review.
Trading in securities is subject to market risks. Please read all related documents carefully before investing. Investments are subject to market risks; please read all the scheme related documents carefully before investing.






 Finovatives