TL;DR: Reading financial statements of Indian companies involves analysing the Balance Sheet for assets and liabilities, the Income Statement for profitability over a period, and the Cash Flow Statement for cash movements, which collectively reveal a company’s financial health and trading potential.
Key Stats at a Glance:
- BSE & NSE list over 5,000+ companies combined.
- Net Profit Margin for top Indian companies can range from 5% to over 25% in FY23.
- Debt-to-Equity ratios for well-managed Indian firms often stay below 1.0.
- Current Ratio for healthy companies typically exceeds 1.5.
- Cash flow from operations is a vital indicator, with positive trends often preferred by investors.
What are Financial Statements?
Financial statements are formal records of the financial activities and position of a business, person, or other entity. For Indian companies listed on the NSE and BSE, these reports are crucial for investors and traders to assess performance and make informed decisions.

How to Read an Income Statement (Profit & Loss Account)?
The Income Statement, also known as the Profit & Loss (P&L) Account, details a company’s revenues, expenses, and profits over a specific period, usually a quarter or a financial year.
Understanding Revenue & Sales
This is the top line, representing the total income generated from the company’s primary business activities. Look for growth trends year-over-year.
Cost of Goods Sold (COGS) & Operating Expenses
COGS are direct costs attributable to the production of goods sold. Operating expenses include salaries, rent, marketing, etc. A rising COGS or operating expenses disproportionately to revenue can signal trouble.
Profitability Metrics
Key metrics include Gross Profit (Revenue – COGS), Operating Profit (Gross Profit – Operating Expenses), and Net Profit (the bottom line after all expenses, interest, and taxes). Investors often focus on Net Profitability and its growth rate.
Earnings Per Share (EPS)
This is the portion of a company’s profit allocated to each outstanding share of common stock. A higher EPS generally indicates greater profitability per share.
How to Read a Balance Sheet?
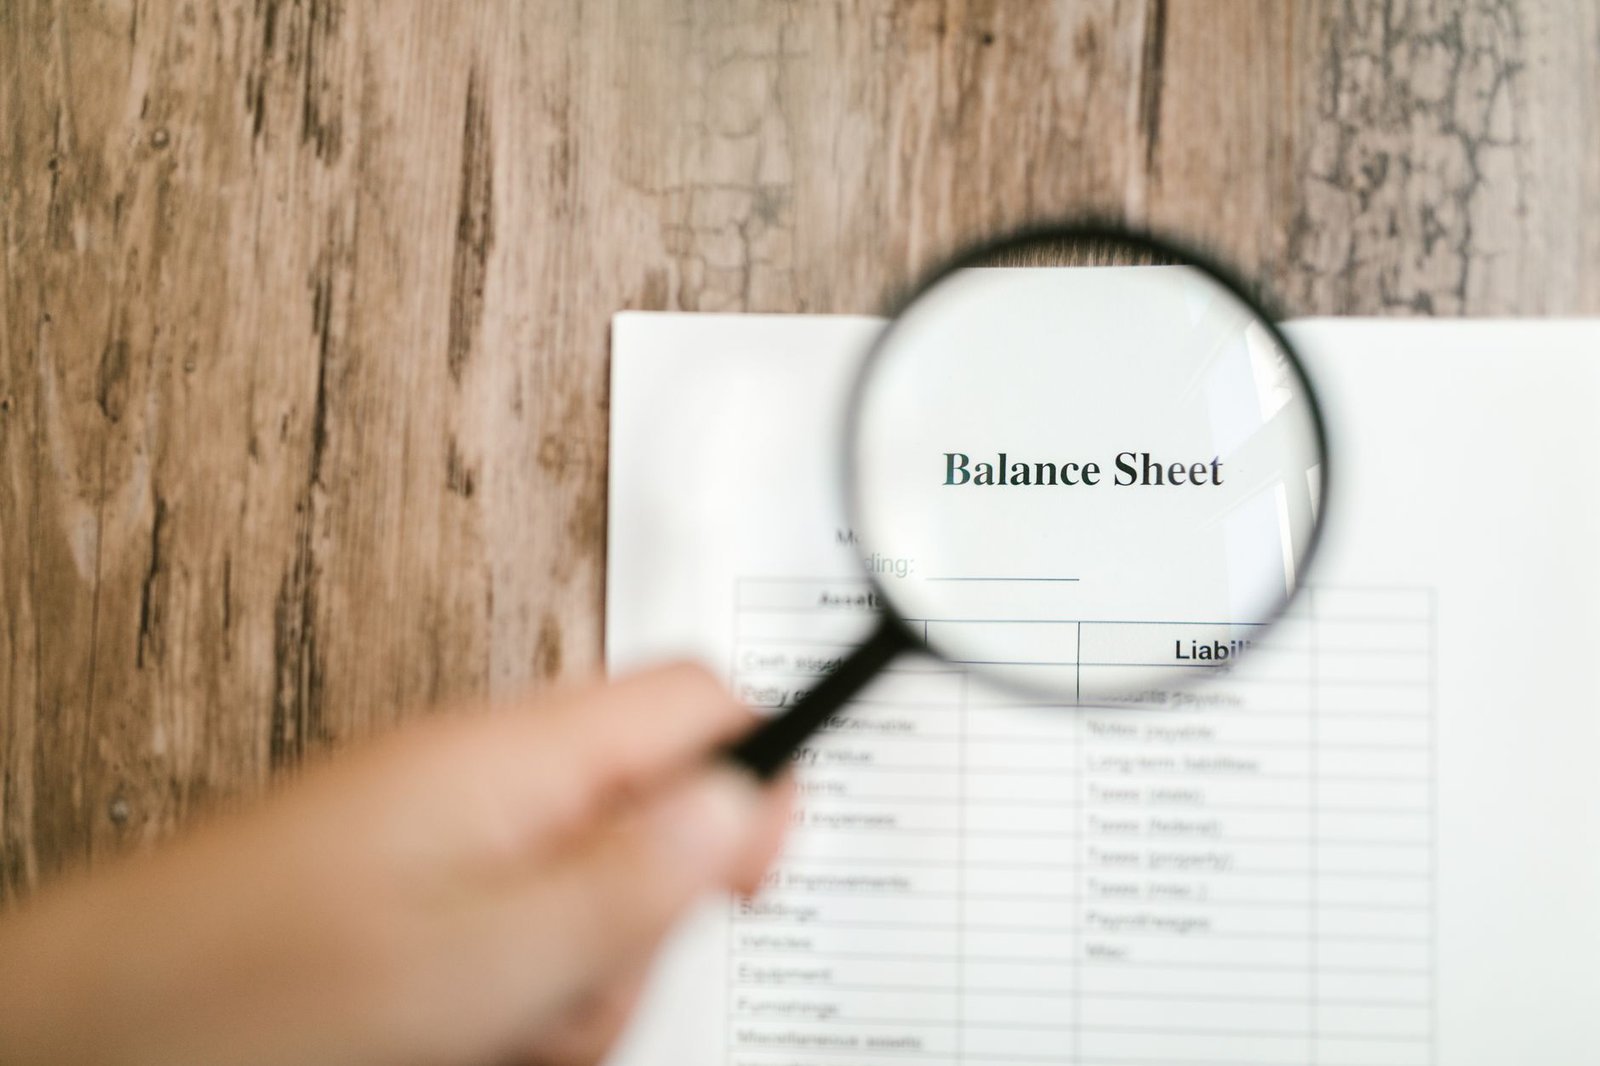
The Balance Sheet provides a snapshot of a company’s assets, liabilities, and shareholders’ equity at a specific point in time, adhering to the fundamental accounting equation: Assets = Liabilities + Shareholders’ Equity.
Assets: What the Company Owns
Assets are resources controlled by the company. They are categorised into Current Assets (cash, receivables, inventory – expected to be converted to cash within a year) and Non-Current Assets (property, plant, equipment, long-term investments).
Liabilities: What the Company Owes
Liabilities are obligations of the company. Current Liabilities (accounts payable, short-term debt – due within a year) and Non-Current Liabilities (long-term debt, deferred tax liabilities).
Shareholders’ Equity: The Owners’ Stake
This represents the owners’ residual claim on assets after deducting liabilities. It includes share capital, reserves, and retained earnings.
Key Ratios from the Balance Sheet
Current Ratio: Current Assets / Current Liabilities. Measures short-term liquidity. A ratio above 1.5-2.0 is generally considered healthy.
Debt-to-Equity Ratio: Total Liabilities / Shareholders’ Equity. Indicates financial leverage. A ratio below 1.0 is often preferred for stability.
How to Read a Cash Flow Statement?
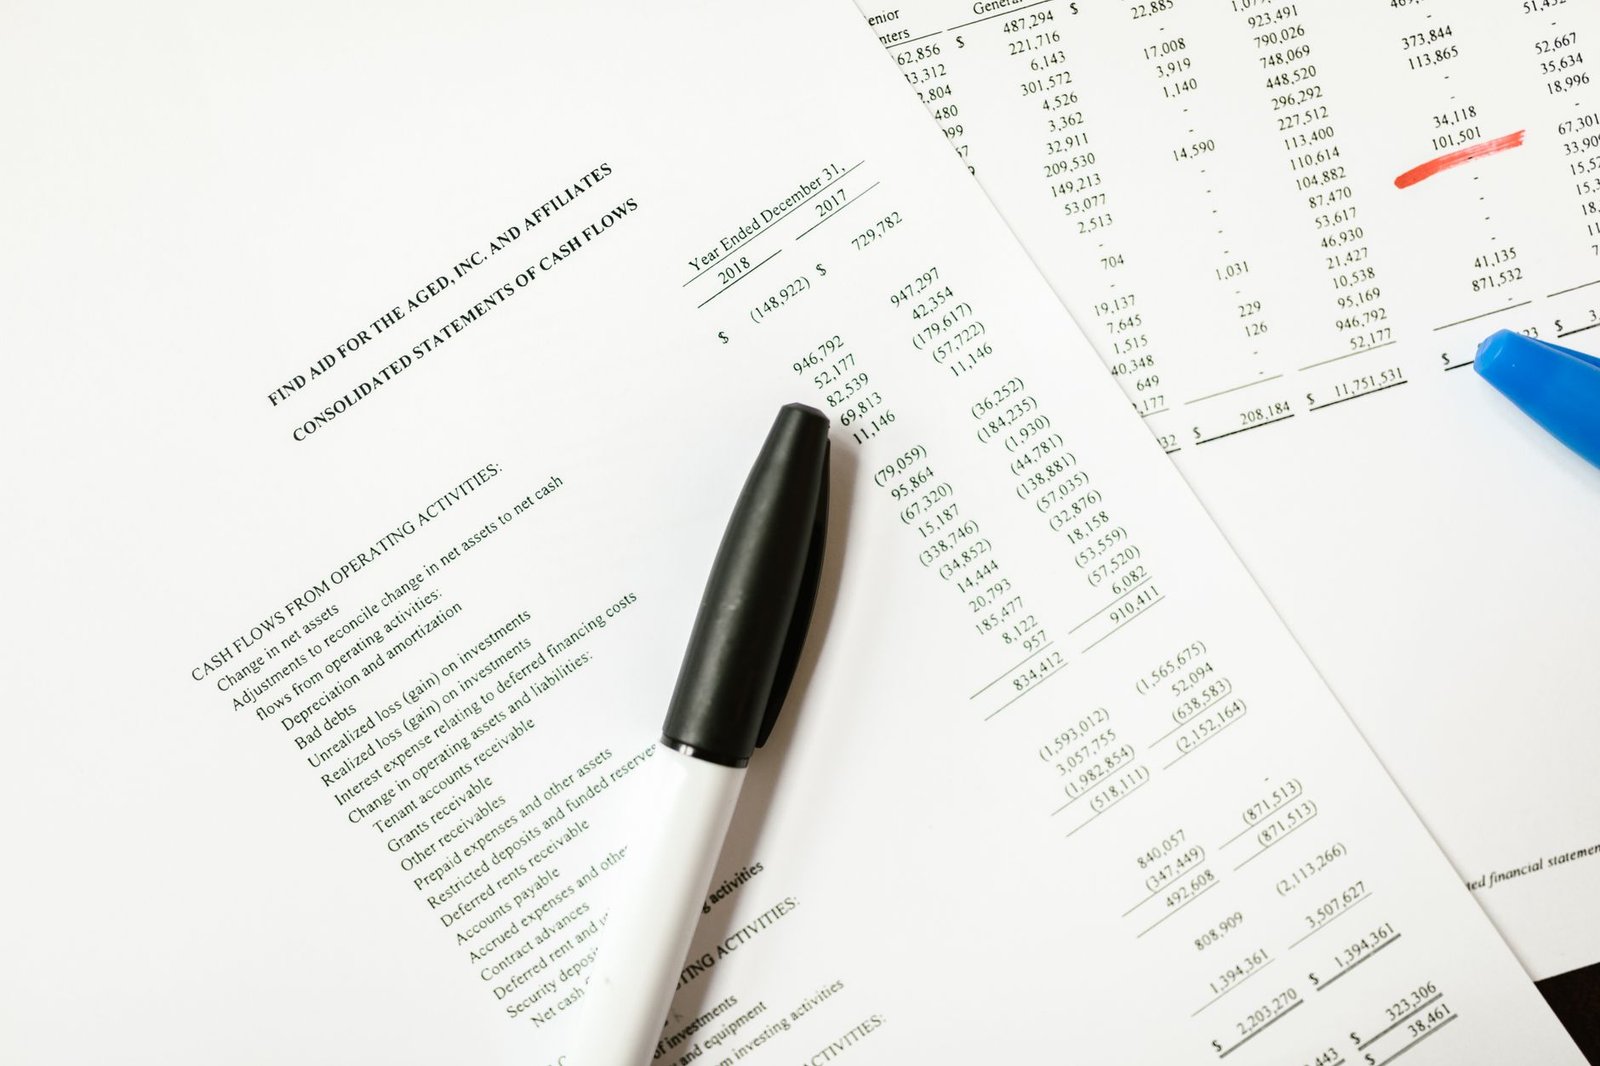
The Cash Flow Statement tracks the movement of cash and cash equivalents into and out of a company over a period. It’s vital because profit doesn’t always equal cash in hand.
Cash Flow from Operations (CFO)
This is the cash generated from a company’s normal business operations. A consistently positive CFO is a strong indicator of a healthy business.
Cash Flow from Investing (CFI)
This section shows cash spent on or generated from investments in long-term assets like property, plant, and equipment. Negative CFI often means the company is investing in its future growth.
Cash Flow from Financing (CFF)
This reflects cash flows from debt, equity, and dividend payments. Positive CFF might indicate borrowing or issuing stock, while negative CFF could mean debt repayment or dividend payouts.
Free Cash Flow (FCF)
Calculated as CFO minus Capital Expenditures (CapEx), FCF represents the cash a company has left after covering its operating expenses and capital investments. It’s cash available for debt repayment, dividends, or expansion.
How to Use Financial Statements for Trading Decisions?
Applying the insights from financial statements can significantly enhance your trading strategy. By understanding a company’s financial health, you can identify robust businesses and avoid those with underlying weaknesses.
Analysing Trends
Don’t just look at one period’s statements. Analyse trends over multiple quarters and years. Consistent revenue growth, improving profit margins, and stable cash flows are positive signs.
Comparing with Peers
Benchmark the company’s performance against its competitors within the same industry. Ratios like P/E (Price-to-Earnings), ROE (Return on Equity), and debt levels provide valuable comparative insights.
Identifying Red Flags
Watch out for declining revenues, shrinking profit margins, increasing debt without corresponding asset growth, negative operating cash flow, or excessive inventory build-up.

Using Technical and Fundamental Analysis Together
Fundamental analysis using financial statements helps identify good companies. Technical analysis, often enhanced with tools like a TradingView indicator, helps determine optimal entry and exit points based on price action and volume. For instance, our Trend Traders Tool can help identify potential breakouts in fundamentally strong stocks.
How to Read Financial Statements: A Step-by-Step Approach
- Obtain the Latest Statements: Download the latest quarterly (Unaudited) and annual (Audited) financial results from the company’s investor relations website or the NSE/BSE websites.
- Start with the Income Statement: Review revenue, cost of sales, operating expenses, and net profit. Look for year-over-year growth and margin stability.
- Analyse the Balance Sheet: Examine assets (especially cash and receivables), liabilities (particularly debt levels), and equity. Calculate key ratios like Current Ratio and Debt-to-Equity.
- Scrutinise the Cash Flow Statement: Focus on Cash Flow from Operations. Ensure it’s positive and growing, and assess Free Cash Flow.
- Calculate Key Ratios: Compute ratios like EPS, ROE, ROCE (Return on Capital Employed), and Debt-to-Equity to assess profitability and financial health.
- Compare with Industry Peers: Benchmark the company’s performance and ratios against its competitors to gauge relative strength.
- Read the Management Discussion & Analysis (MD&A): This section in annual reports provides management’s perspective on performance, risks, and future outlook.
- Look for Auditor’s Report: For annual statements, check the auditor’s report for any qualifications or adverse opinions, which could be a major red flag.

Frequently Asked Questions
What are the three main financial statements?
The three main financial statements are the Income Statement (P&L), the Balance Sheet, and the Cash Flow Statement. Together, they provide a comprehensive view of a company’s financial performance and position.
Where can I find financial statements for Indian companies?
You can find financial statements on the investor relations section of the company’s official website, or on the stock exchange websites (NSE India, BSE India). SEBI also mandates disclosures.
Is profit the same as cash flow?
No. Profit is an accounting measure of earnings, while cash flow is the actual movement of cash in and out of the business. A company can be profitable but have negative cash flow.
What is a good Debt-to-Equity ratio?
A Debt-to-Equity ratio below 1.0 is generally considered healthy, indicating that the company relies more on equity financing than debt. However, acceptable levels vary by industry.
How often are financial statements released?
Indian listed companies typically release their financial results quarterly (unaudited) and annually (audited). The annual report provides the most comprehensive financial data.
What is the significance of EPS?
Earnings Per Share (EPS) shows how much profit a company makes for each outstanding share. It’s a key indicator of profitability and is often used in valuation metrics like the P/E ratio.
Key Takeaways
- The Income Statement reveals profitability over a period.
- The Balance Sheet shows assets, liabilities, and equity at a point in time.
- The Cash Flow Statement tracks cash inflows and outflows, crucial for operational health.
- Key ratios like Current Ratio, Debt-to-Equity, and EPS help in analysis.
- Comparing a company’s statements to its peers provides valuable context.
- Always look for trends over multiple reporting periods, not just single data points.
- Combining fundamental analysis from statements with technical analysis improves trading decisions.
Investing in the stock market involves risks. Please consult with a SEBI-registered investment advisor before making any investment decisions.





 Finovatives