



TL;DR: Reading Indian company financial statements involves analysing the Balance Sheet, Income Statement, and Cash Flow Statement to understand a company’s financial health, profitability, and cash generation, enabling informed trading decisions on platforms like NSE and BSE.
Key Stats at a Glance:
- Nifty 50’s average P/E ratio fluctuates, but understanding individual company P/E is vital.
- Over 5,000 companies are listed across NSE and BSE combined.
- Indian companies typically report quarterly and annual financial results.
- SEBI mandates standardized formats for financial statement disclosures.
- ₹10,000 Crore is a common benchmark for large-cap companies.
What are the core financial statements?
The three primary financial statements essential for analysing Indian companies are the Balance Sheet, the Income Statement (also known as the Profit & Loss or P&L statement), and the Cash Flow Statement.
How do I analyse the Balance Sheet?
The Balance Sheet provides a snapshot of a company’s assets, liabilities, and shareholders’ equity at a specific point in time, showing what a company owns and owes.
Understanding Assets
Assets are resources controlled by the company from which future economic benefits are expected to flow. They are typically divided into current assets (expected to be converted to cash within one year, like cash, accounts receivable, and inventory) and non-current assets (long-term assets like property, plant, and equipment, and intangible assets).
Understanding Liabilities
Liabilities represent the company’s obligations to external parties. Current liabilities are debts due within one year (e.g., accounts payable, short-term loans), while non-current liabilities are long-term obligations (e.g., long-term debt, deferred tax liabilities).
Shareholders’ Equity
This represents the owners’ stake in the company. It includes share capital (money raised by issuing shares) and reserves and surplus (retained earnings and other accumulated profits). The fundamental accounting equation, Assets = Liabilities + Equity, must always hold true.
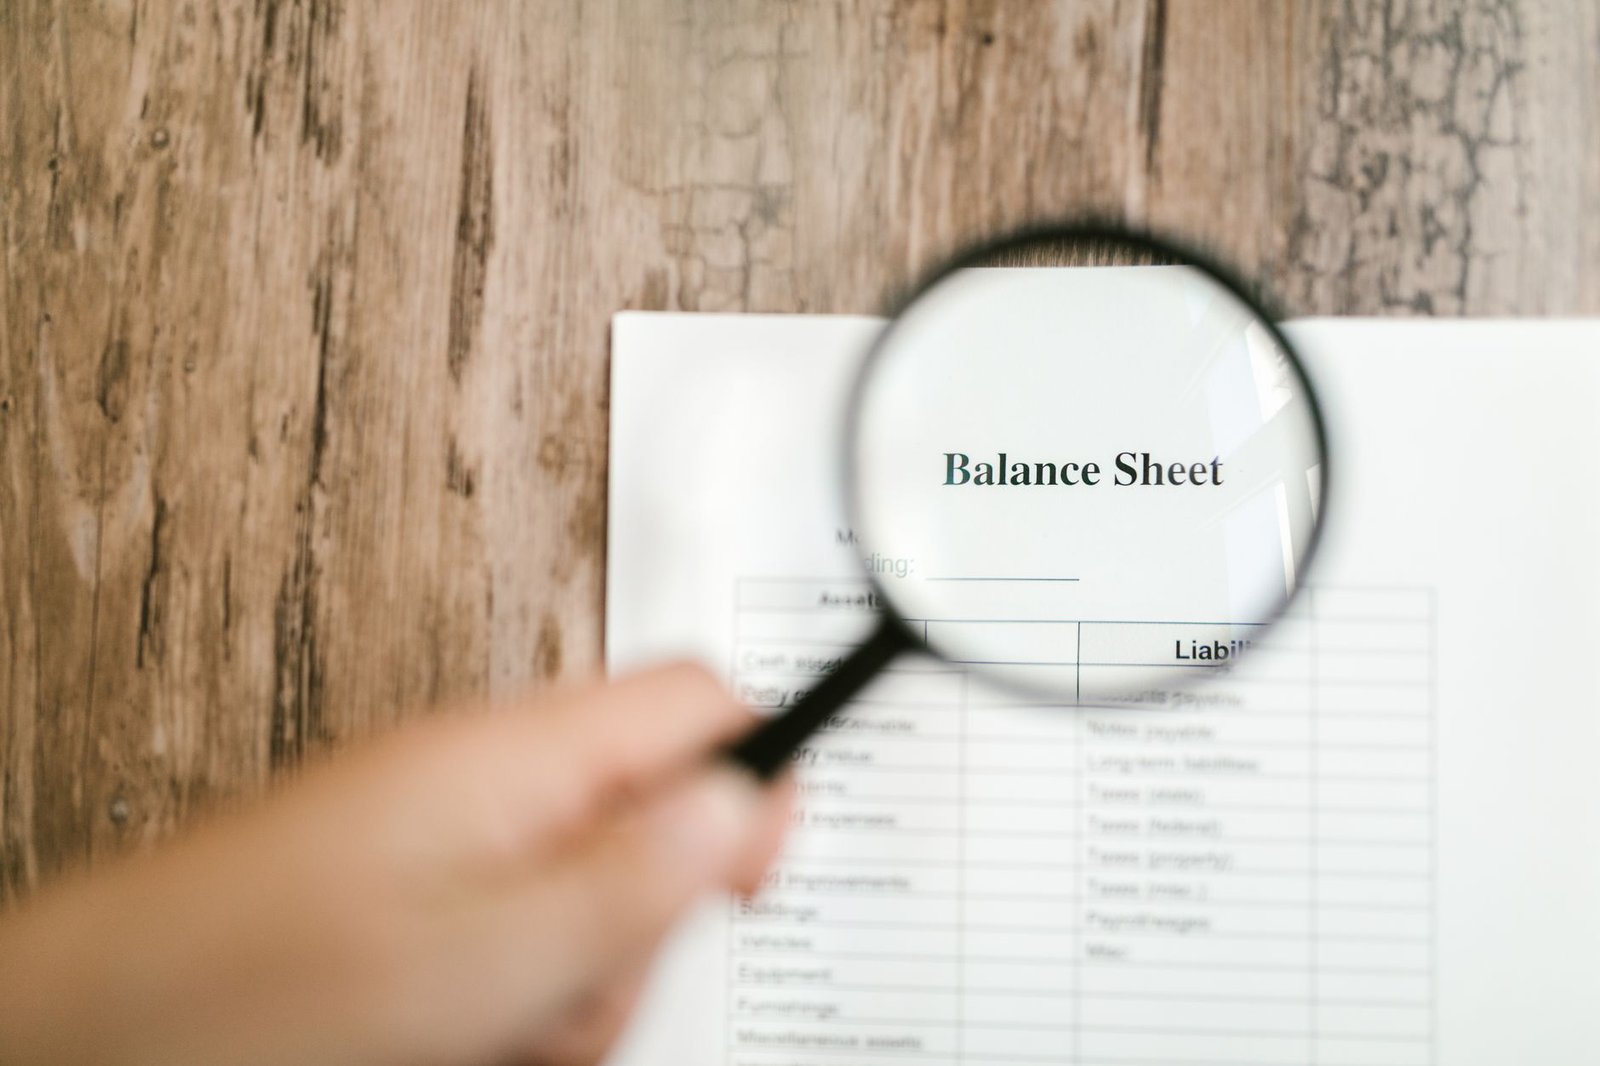
For traders, a rising trend in assets, particularly productive non-current assets, alongside manageable or decreasing liabilities, signals financial strength. Equity growth, especially through retained earnings, indicates profitability and reinvestment.
How do I analyse the Income Statement?
The Income Statement (P&L) details a company’s revenues, expenses, and profits over a specific period (quarterly or annually), revealing its operational performance and profitability.
Revenue Recognition
Revenue, or sales, is the top line of the income statement, representing the total income generated from the company’s primary business activities. Analysts scrutinize revenue growth rates and the sources of revenue.
Cost of Goods Sold (COGS) & Operating Expenses
COGS includes direct costs attributable to the production of goods sold. Operating expenses cover costs like salaries, rent, marketing, and administrative costs. The difference between Revenue and COGS is Gross Profit. The difference between Gross Profit and Operating Expenses is Operating Profit or EBIT (Earnings Before Interest and Taxes).
Profitability Metrics
Key profit metrics include EBIT, PBT (Profit Before Tax), and PAT (Profit After Tax), also known as net profit. PAT is the bottom line, representing the company’s profit after all expenses, interest, and taxes. Traders often look at Earnings Per Share (EPS), which is PAT divided by the number of outstanding shares.
Consistent revenue growth and improving profit margins (Gross, Operating, and Net) are positive indicators. A declining trend in these areas warrants caution. Examining the growth of EPS is fundamental for evaluating shareholder value.
How do I analyse the Cash Flow Statement?
The Cash Flow Statement tracks the movement of cash and cash equivalents into and out of the company over a period, categorised into Operating, Investing, and Financing activities.
Cash Flow from Operations (CFO)
This is arguably the most critical section, showing cash generated or used by the company’s normal day-to-day business operations. Positive and growing CFO indicates a healthy business that can generate cash from its core activities.
Cash Flow from Investing (CFI)
This section reflects cash spent on or received from acquiring or disposing of long-term assets like property, plant, and equipment, as well as investments in other companies. Negative CFI typically signifies investment in future growth (e.g., buying new machinery).
Cash Flow from Financing (CFF)
This shows how cash has been used or generated through debt, equity, and dividends. Issuing debt or equity brings cash in, while repaying debt, buying back stock, or paying dividends uses cash. Positive CFF might indicate borrowing or issuing shares, while negative CFF could mean debt repayment or shareholder returns.

A company should ideally generate positive cash flow from operations consistently. While investing and financing activities can fluctuate, a strong CFO is a bedrock of financial stability. A company with high profits but negative CFO may face liquidity issues.
How to Read Financial Statements Effectively
- Gather Statements: Obtain the latest annual report and quarterly results from the company’s website, NSE, or BSE filings.
- Review the Balance Sheet: Analyse trends in assets, liabilities, and equity over the past 3-5 years. Look for healthy current ratios (Current Assets / Current Liabilities) and manageable debt-to-equity ratios.
- Analyse the Income Statement: Examine year-on-year revenue growth, gross profit margins, operating profit margins, and net profit margins. Calculate and track EPS growth.
- Scrutinize the Cash Flow Statement: Focus on positive and growing cash flow from operations. Assess if investments (CFI) align with company strategy and if financing (CFF) is sustainable.
- Calculate Key Ratios: Compute and compare financial ratios like ROE (Return on Equity), ROCE (Return on Capital Employed), Debt-to-Equity, and Current Ratio against industry peers and historical data. Consider using a TradingView indicator that can help visualize these metrics.
- Read Management Discussion & Analysis (MD&A): Understand the management’s perspective on performance, future outlook, and risks.
- Check for Notes to Accounts: These provide crucial details about accounting policies and specific line items.
- Compare with Peers: Benchmark the company’s performance against competitors in the same sector to gauge relative strength and identify potential opportunities.

Frequently Asked Questions
What is the most important financial statement for traders?
While all three are crucial, the Income Statement is often prioritised for understanding profitability and growth trends, while the Cash Flow Statement reveals the company’s ability to generate actual cash from its operations, which is vital for sustainability.
How often should I check financial statements?
Traders should review quarterly results as soon as they are released to stay updated on performance. An in-depth annual review provides a broader perspective on long-term trends and strategic direction.
What is a ‘good’ Debt-to-Equity ratio?
A ‘good’ ratio varies by industry. Generally, a ratio below 1 is considered conservative. High ratios indicate higher financial risk, especially if the company struggles to generate consistent profits or cash flow.
How do I find financial statements for Indian companies?
Official sources include the company’s investor relations website, stock exchange websites (NSE India, BSE India), and financial data portals that aggregate this information, often accessible via platforms offering a TradingView indicator.
Can I rely solely on financial statements for trading decisions?
No. Financial statements provide fundamental insights but should be combined with technical analysis, market sentiment, industry trends, and macroeconomic factors for a comprehensive trading strategy. Tools like the Trend Traders Tool can integrate various analytical approaches.

Key Takeaways:
- The Balance Sheet shows financial position, Income Statement shows profitability, and Cash Flow Statement shows cash movements.
- Focus on trends, growth rates, and margins across all statements, not just single data points.
- Key ratios like EPS growth, ROE, ROCE, and Debt-to-Equity are vital for comparative analysis.
- Cash Flow from Operations is a critical indicator of business health.
- Always compare a company’s performance against its historical data and industry peers.
- Financial statements provide a foundational view; supplement with technical analysis and market context.
Investing in securities is subject to market risks. Read all related documents carefully before investing.






 Finovatives