

TL;DR: Reading financial statements of Indian companies involves analysing the Balance Sheet, Income Statement, and Cash Flow Statement to assess profitability, liquidity, and solvency, enabling informed investment decisions.
Key Stats at a Glance:
- Nifty 50 companies’ average P/E ratio fluctuates, typically ranging from 20-25.
- Over 7,000 companies listed across NSE and BSE as of 2024.
- SEBI mandates standardised formats for financial reporting.
- Indian companies typically report quarterly and annually.
- Average net profit margin for BSE 500 companies can vary significantly by sector, from 5% to 20%+.
What are Financial Statements?
Financial statements are formal records of the financial activities and position of a business, person, or other entity. For Indian companies listed on NSE and BSE, these documents provide a comprehensive overview of their financial performance and health over a specific period.
The Three Core Statements
Every investor and trader must become familiar with the three primary financial statements: the Balance Sheet, the Income Statement (also known as the Profit & Loss Statement), and the Cash Flow Statement. Each tells a different but crucial part of the company’s financial story.
1. The Balance Sheet
The Balance Sheet provides a snapshot of a company’s assets, liabilities, and shareholders’ equity at a specific point in time. It follows the fundamental accounting equation: Assets = Liabilities + Shareholders’ Equity.
2. The Income Statement
The Income Statement (or P&L Statement) reports a company’s financial performance over a period, such as a quarter or a year. It shows revenues, expenses, and ultimately, the net profit or loss.
3. The Cash Flow Statement
The Cash Flow Statement tracks the movement of cash into and out of a company. It’s divided into three activities: operating, investing, and financing, providing insight into how the company generates and uses cash.
Understanding these statements is not just for accountants; for retail traders in India, it’s a fundamental skill for evaluating stocks beyond just price charts. Tools like our Trend Traders Tool can complement this analysis by identifying potential trends based on price and volume, but the underlying financial health is paramount.
Why is Reading Financial Statements Crucial for Indian Traders?
For traders and investors on the NSE and BSE, dissecting financial statements is non-negotiable for making informed decisions that align with their investment goals and risk tolerance. It moves you from speculative trading to strategic investing.
Identifying Financial Health
Strong financial statements are indicative of a healthy company that can weather economic downturns and continue to grow. Key metrics within these statements help gauge this health.
Spotting Growth Opportunities
By analysing trends in revenue, profit margins, and cash flow over multiple periods, traders can identify companies with sustainable growth trajectories. This is vital for long-term wealth creation.
Assessing Valuation
Financial statements provide the data needed to calculate valuation ratios (like P/E, P/B, Debt-to-Equity). Comparing these ratios against industry averages and historical data helps determine if a stock is overvalued or undervalued.
Detecting Red Flags
Unusual trends, declining revenues, increasing debt, or negative cash flows from operations can be early warning signs of financial distress. Early detection allows traders to exit positions before significant losses occur.
How to Read an Indian Company’s Income Statement
The Income Statement, often called the Profit and Loss (P&L) Statement, reveals a company’s profitability over a specific period. For Indian companies, these are usually reported quarterly and annually as per SEBI guidelines.
Understanding Revenue and Sales
This is the top line – the total amount of money generated from the company’s primary business activities. Look for consistent growth year-on-year.
Analysing Cost of Goods Sold (COGS)
COGS includes the direct costs attributable to the production of the goods sold by a company. Comparing COGS to revenue helps understand gross profit margins.
Examining Operating Expenses
These are costs incurred in the normal course of business, not directly tied to production, such as salaries, rent, and marketing. High or rapidly increasing operating expenses can erode profits.
Calculating Operating Profit (EBIT)
Earnings Before Interest and Taxes (EBIT) shows profitability from core operations before accounting for financing costs and taxes. It’s a good indicator of operational efficiency.
Evaluating Net Profit
This is the bottom line – what’s left after all expenses, interest, and taxes are deducted from revenue. A consistently growing net profit is a positive sign.
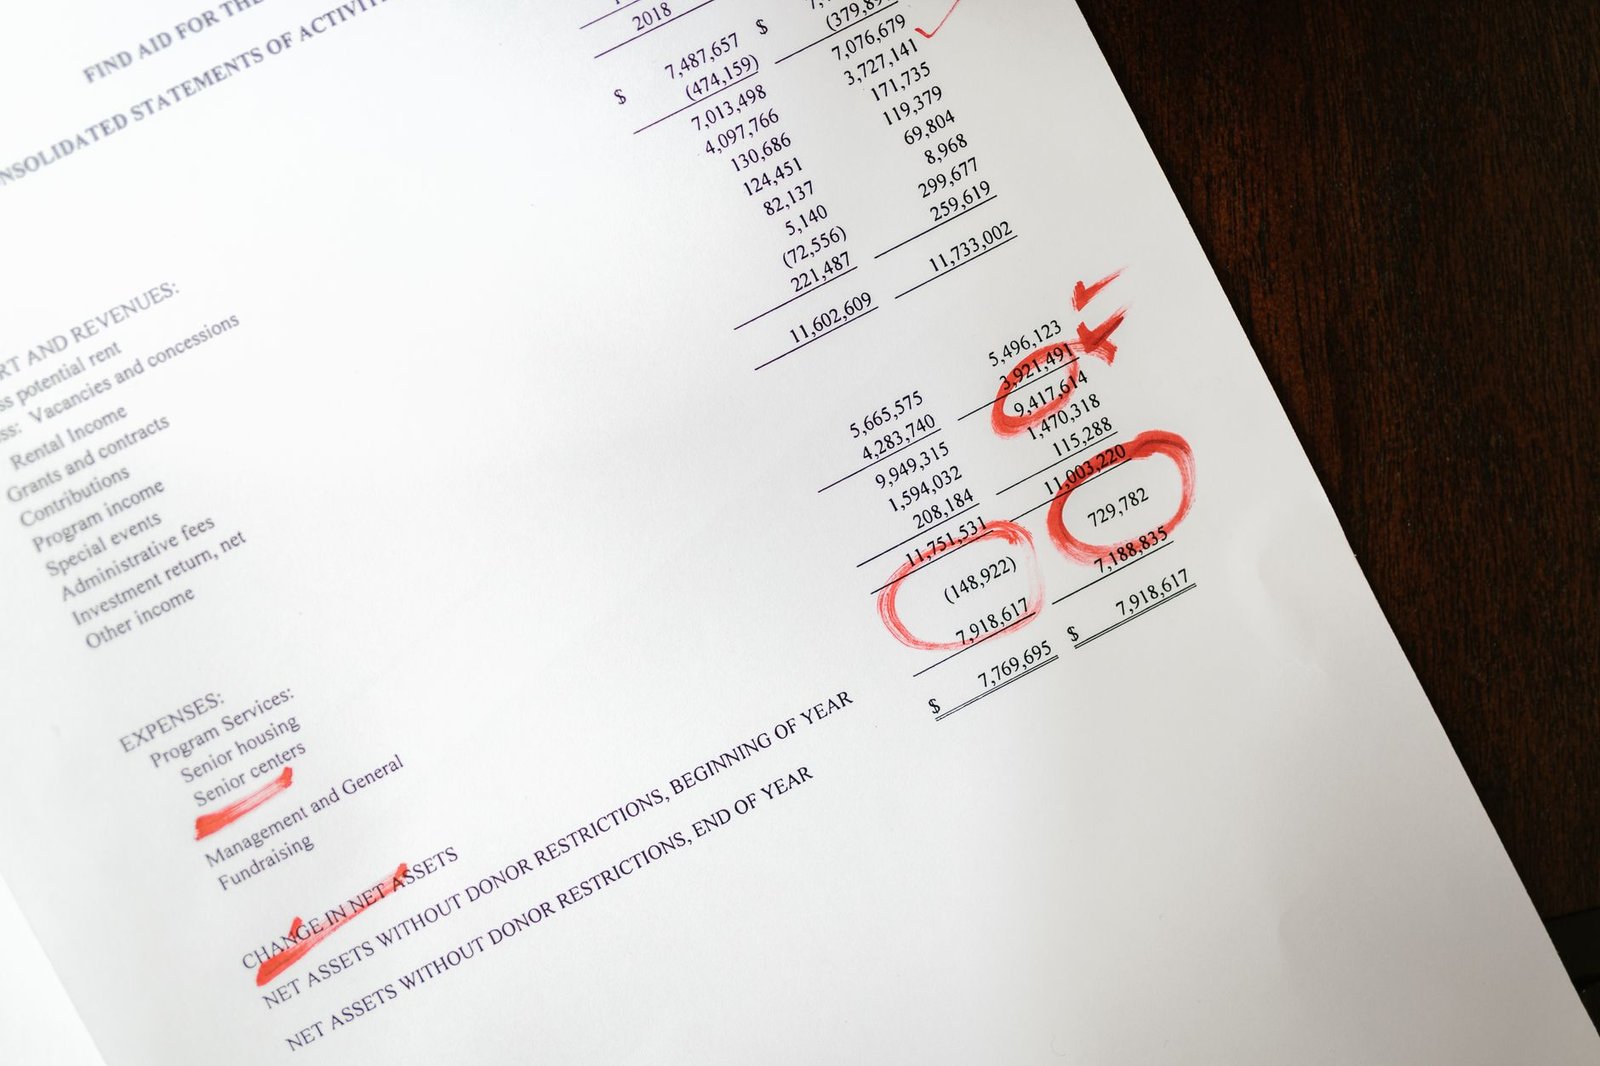
Traders often look at Net Profit Margin (Net Profit / Revenue) to understand how much profit is generated per rupee of sales.
How to Read an Indian Company’s Balance Sheet
The Balance Sheet provides a snapshot of a company’s financial standing at a particular moment. It’s a critical tool for assessing a company’s assets, liabilities, and equity.
Key Components: Assets
Assets are resources owned by the company that have economic value. They are typically divided into current assets (expected to be converted to cash within a year, e.g., cash, inventory, receivables) and non-current assets (long-term assets, e.g., property, plant, equipment).
Key Components: Liabilities
Liabilities are what the company owes to others. Current liabilities are obligations due within a year (e.g., accounts payable, short-term loans), while non-current liabilities are long-term debts (e.g., bonds, long-term loans).
Key Components: Shareholders’ Equity
This represents the owners’ stake in the company. It includes share capital and retained earnings (profits reinvested back into the business). Shareholders’ Equity = Total Assets – Total Liabilities.
Liquidity Ratios
Ratios like the Current Ratio (Current Assets / Current Liabilities) and Quick Ratio ( (Current Assets – Inventory) / Current Liabilities ) indicate a company’s ability to meet its short-term obligations. A ratio significantly below 1 might signal liquidity issues.
Solvency Ratios
The Debt-to-Equity Ratio (Total Liabilities / Shareholders’ Equity) is a key solvency metric, showing how much debt a company uses to finance its assets relative to the value of shareholders’ equity. High ratios can indicate higher risk.
How to Read an Indian Company’s Cash Flow Statement
The Cash Flow Statement is crucial because it shows the actual movement of cash, which is essential for a company’s survival and growth. It helps bridge the gap between accrual accounting (Income Statement) and actual cash on hand.
Cash Flow from Operations (CFO)
This section shows the cash generated from a company’s normal business operations. A consistently positive and growing CFO is a strong sign of financial health. Negative CFO can be a red flag, even if the company reports profits.
Cash Flow from Investing (CFI)
This reflects cash spent on or generated from long-term assets like property, plant, and equipment, or investments in other companies. Significant outflows here might indicate expansion, while inflows could mean asset sales.
Cash Flow from Financing (CFF)
This shows cash flows related to debt, equity, and dividends. It includes raising capital through loans or issuing stock, and repaying debt or paying dividends.
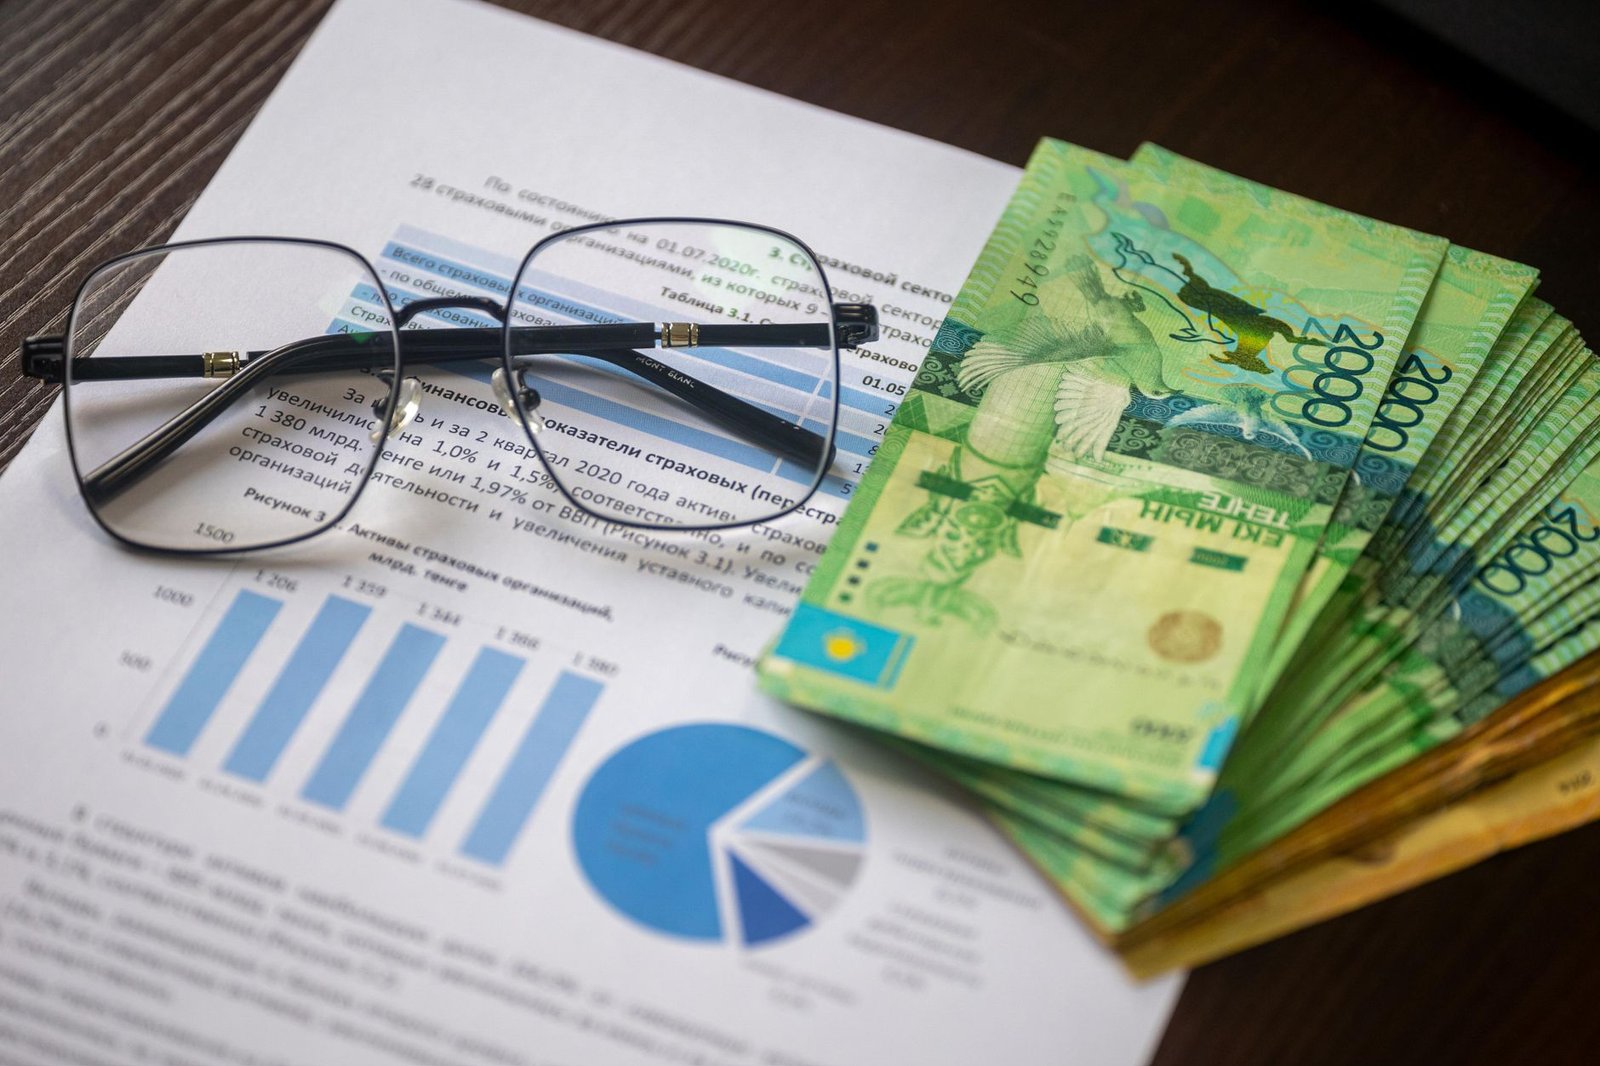
By analysing the interplay between these three sections, traders can understand how a company is funding its operations and growth, and whether its reported profits are translating into actual cash.
How to Analyse Financial Statements: A Step-by-Step Guide for Traders
Effectively reading financial statements requires a systematic approach. Here’s a practical guide for Indian retail traders:
- Gather the Statements: Obtain the latest quarterly and annual reports (often called ‘results’) from the company’s investor relations website, NSE India, or BSE India.
- Start with the Income Statement: Analyse revenue growth, profit margins (gross, operating, net), and earnings per share (EPS) trends over the last 3-5 years.
- Examine the Balance Sheet: Assess the company’s debt levels (Debt-to-Equity ratio), liquidity (Current Ratio), and asset growth. Check for any significant increases in intangible assets.
- Review the Cash Flow Statement: Focus on operating cash flow. Is it consistently positive and growing? Compare net profit to operating cash flow; they should generally move together.
- Calculate Key Ratios: Compute important financial ratios relevant to the industry (e.g., P/E, P/B, ROE, ROCE, Debt-to-Equity).
- Compare with Industry Peers: Benchmark the company’s ratios against competitors and industry averages to gauge relative performance and valuation.
- Look for Trends and Red Flags: Identify consistent patterns (positive or negative) and watch out for unusual items, declining margins, increasing debt without corresponding revenue growth, or negative operating cash flows.
- Read the Management Discussion & Analysis (MD&A): This section, part of the annual report, provides management’s perspective on performance, risks, and future outlook.
Frequently Asked Questions
What is the most important financial statement for a trader?
While all three are vital, the Cash Flow Statement is often considered paramount by traders as it shows the actual cash a company generates and uses, which is critical for solvency and growth, unlike accrual-based profits.
How often should I check a company’s financial statements?
As a trader, review quarterly results when they are announced and annual reports for a comprehensive year-end view. For long-term investors, quarterly updates are sufficient.
What is a good Net Profit Margin in India?
A ‘good’ Net Profit Margin varies significantly by industry. For stable sectors like FMCG or IT, 10-20%+ might be considered good. However, for capital-intensive sectors like steel or power, lower margins might be acceptable.
How does SEBI influence financial reporting in India?
SEBI mandates strict accounting standards and disclosure norms for listed Indian companies, ensuring transparency and consistency in financial reporting to protect investor interests.
What does a high Debt-to-Equity ratio signify?
A high Debt-to-Equity ratio suggests the company relies heavily on borrowed funds to finance its operations. This can increase financial risk, especially during economic downturns or rising interest rate environments.
Can I rely solely on financial statements for trading decisions?
No. While crucial for fundamental analysis, financial statements should be used in conjunction with technical analysis (like charting patterns and indicators available on TradingView) and broader market sentiment for a holistic trading strategy.

What are intangible assets and why should I look at them?
Intangible assets include items like goodwill, patents, and brand recognition. While they can add value, a significant increase in goodwill without clear justification can be a red flag, potentially masking underlying issues.
Key Takeaways
- Financial statements (Balance Sheet, Income Statement, Cash Flow Statement) are essential tools for understanding a company’s financial health.
- The Income Statement reveals profitability, the Balance Sheet shows assets/liabilities/equity, and the Cash Flow Statement tracks cash movements.
- Key ratios derived from these statements (like P/E, Debt-to-Equity, Current Ratio) help in valuation and risk assessment.
- Consistent revenue and profit growth, coupled with strong operating cash flow, are positive indicators.
- Always compare a company’s financials against its historical performance and industry peers.
- SEBI regulations ensure a degree of standardization and transparency in reporting for Indian listed companies.
- These statements are foundational for fundamental analysis, complementing technical indicators for a well-rounded trading approach.
Investing in the stock market involves inherent risks. Always conduct thorough research and consult with a qualified financial advisor before making any investment decisions.




 Finovatives