


TL;DR: Market breadth indicators analyse the participation of stocks in a market move, helping Indian traders identify the strength or weakness of a trend and anticipate potential reversals before they become obvious in price alone.
Key Stats at a Glance:
- Nifty 50 comprises 50 large-cap stocks, but breadth indicators look at the 2,000+ stocks on NSE.
- Advance-Decline Line often leads price movements by several weeks.
- Volume participation can confirm trend strength, with high volume during uptrends being a positive sign.
- New 52-week highs/lows can signal shifts in market sentiment.
- Overbought/oversold readings from breadth oscillators can precede price corrections.
What are Market Breadth Indicators?
Market breadth indicators are tools that measure the extent of a stock market’s movement, focusing on the number of advancing stocks versus declining stocks, or the volume traded by advancing versus declining stocks, rather than just the price of an index.
Imagine the Nifty 50 or Sensex moving up, but only a handful of the largest stocks are driving that rise, while most other stocks are falling. This is a classic sign of weak market breadth, suggesting the rally might not be sustainable. Conversely, if most stocks are participating in a move, it indicates strong underlying support for the trend.
Understanding market breadth is crucial for any serious Indian trader looking to move beyond simple price action and gain a more holistic view of market dynamics. These indicators help confirm trends, detect divergences, and signal potential turning points, offering a significant edge, especially when combined with robust tools like a TradingView indicator.
Why is Market Breadth Analysis Important for Indian Traders?
For Indian retail traders, market breadth analysis provides a vital layer of confirmation and early warning that price action alone often misses.
The NSE and BSE are vast ecosystems with thousands of listed companies. While headline indices like the Nifty 50 and Sensex give us a broad overview, they can mask underlying weaknesses or strengths within specific sectors or across the broader market. Market breadth indicators allow us to peer beneath the surface and assess the true health of the rally or decline.
For instance, if the Nifty 50 is hitting new highs, but the number of stocks hitting new 52-week highs is decreasing, it’s a bearish divergence. This suggests that fewer companies are contributing to the upward momentum, and the rally might be nearing exhaustion. Recognizing such divergences early can help traders avoid getting caught on the wrong side of a potential reversal.
SEBI, in its advisories, often stresses the importance of a well-rounded approach to trading, and understanding market internals like breadth is a key component of that. It helps in making more robust decisions, managing risk effectively, and avoiding herd mentality driven by index movements.
Key Breadth Indicators to Watch
Several indicators fall under the umbrella of market breadth. Understanding and monitoring these can significantly enhance your trading strategy.
1. Advance-Decline Line (A-D Line): This is perhaps the most fundamental breadth indicator. It’s calculated by summing the difference between the number of advancing stocks and declining stocks each day. A rising A-D line generally confirms an uptrend, while a falling line confirms a downtrend. Divergences between the A-D line and the index price are significant.
2. Advancers/Decliners Ratio (A/D Ratio): This is a simpler ratio, calculated by dividing the number of advancing stocks by the number of declining stocks on a given day. A ratio above 1 indicates more advancers than decliners, suggesting bullish sentiment, while a ratio below 1 suggests bearish sentiment. Extreme readings (e.g., above 2 or below 0.5) can signal overbought or oversold conditions.
3. New Highs – New Lows (NHNL): This indicator tracks the number of stocks reaching 52-week highs versus those reaching 52-week lows. A rising number of new highs generally confirms an uptrend, while a rising number of new lows confirms a downtrend. A decrease in new highs during an uptrend, or an increase in new lows during a downtrend, signals weakening momentum.
4. Volume Advance-Decline Line: Similar to the A-D Line, but it incorporates volume. It calculates the difference between the volume of advancing stocks and the volume of declining stocks. This gives more weight to moves involving higher participation.
5. Breadth Thrust (or McClellan Oscillator variation): While the McClellan Oscillator is more complex, simpler breadth thrust indicators measure the percentage of stocks trading above their 50-day or 200-day moving averages. A high percentage suggests broad participation and a healthy uptrend.

How to Interpret Market Breadth Indicators
Interpreting market breadth indicators involves looking for confirmation of price trends, identifying divergences, and spotting potential turning points.
The core principle is to compare the behaviour of the breadth indicator with the behaviour of the primary market index (like Nifty 50 or Sensex). When both the index and the breadth indicator are moving in the same direction, it confirms the strength and sustainability of the trend.
Confirmation: If the Nifty 50 is making new highs and the Advance-Decline Line is also making new highs, it strongly suggests a healthy bull market with broad participation. Conversely, if the Sensex is falling and the A-D Line is also falling, it confirms the bearish trend.
Divergence: This is where breadth indicators become exceptionally powerful. A bearish divergence occurs when the index makes a new high, but the breadth indicator (e.g., A-D Line or NHNL) fails to make a new high, or even starts declining. This suggests that fewer stocks are driving the index higher, and the upward momentum is weakening, potentially signalling an upcoming reversal.
A bullish divergence occurs when the index makes a new low, but the breadth indicator starts to move up or fails to make a new low. This indicates that selling pressure is easing, and the market may be preparing for a rebound.
Extreme Readings: Overbought or oversold conditions can be identified by extreme readings on certain breadth indicators. For example, if the A/D Ratio spikes very high (e.g., above 3:1) or plunges very low (e.g., below 0.5:1), it might suggest that the market has moved too far, too fast, and a consolidation or reversal could be imminent.
How to Use Market Breadth for Trading Decisions
Integrating market breadth indicators into your trading strategy can lead to more timely entries and exits, and better risk management.
Here’s a practical approach for Indian traders:
- Choose Your Primary Index/Market: Decide whether you’re focusing on the Nifty 50, Nifty Bank, broader market indices, or even specific sectors.
- Select Key Breadth Indicators: Start with 1-2 reliable indicators like the Advance-Decline Line and the New Highs-New Lows indicator. Many charting platforms offer these.
- Monitor for Confirmation: Look for situations where the index price and your chosen breadth indicator are moving in the same direction. This strengthens the validity of the current trend.
- Identify Divergences: Actively search for divergences. A divergence between the index and a breadth indicator is often a potent signal of an impending trend change.
- Use as an Entry/Exit Filter: Use breadth signals to refine your entry and exit points. For example, if you’re looking to go long on an index but the breadth is weak, you might wait for improved breadth before entering. Conversely, a strong breadth indicator can support holding a profitable trade longer.
- Combine with Other Tools: Market breadth is not a standalone system. Combine it with price action analysis, volume analysis, and potentially custom TradingView indicators for a comprehensive view.
- Be Aware of Market Conditions: Breadth indicators tend to work best in trending markets. In choppy, sideways markets, they can generate more false signals.
- Review and Adapt: Regularly review how the indicators are performing in the current market environment and adjust your interpretation or chosen indicators as needed.
Example: Spotting a Potential Top
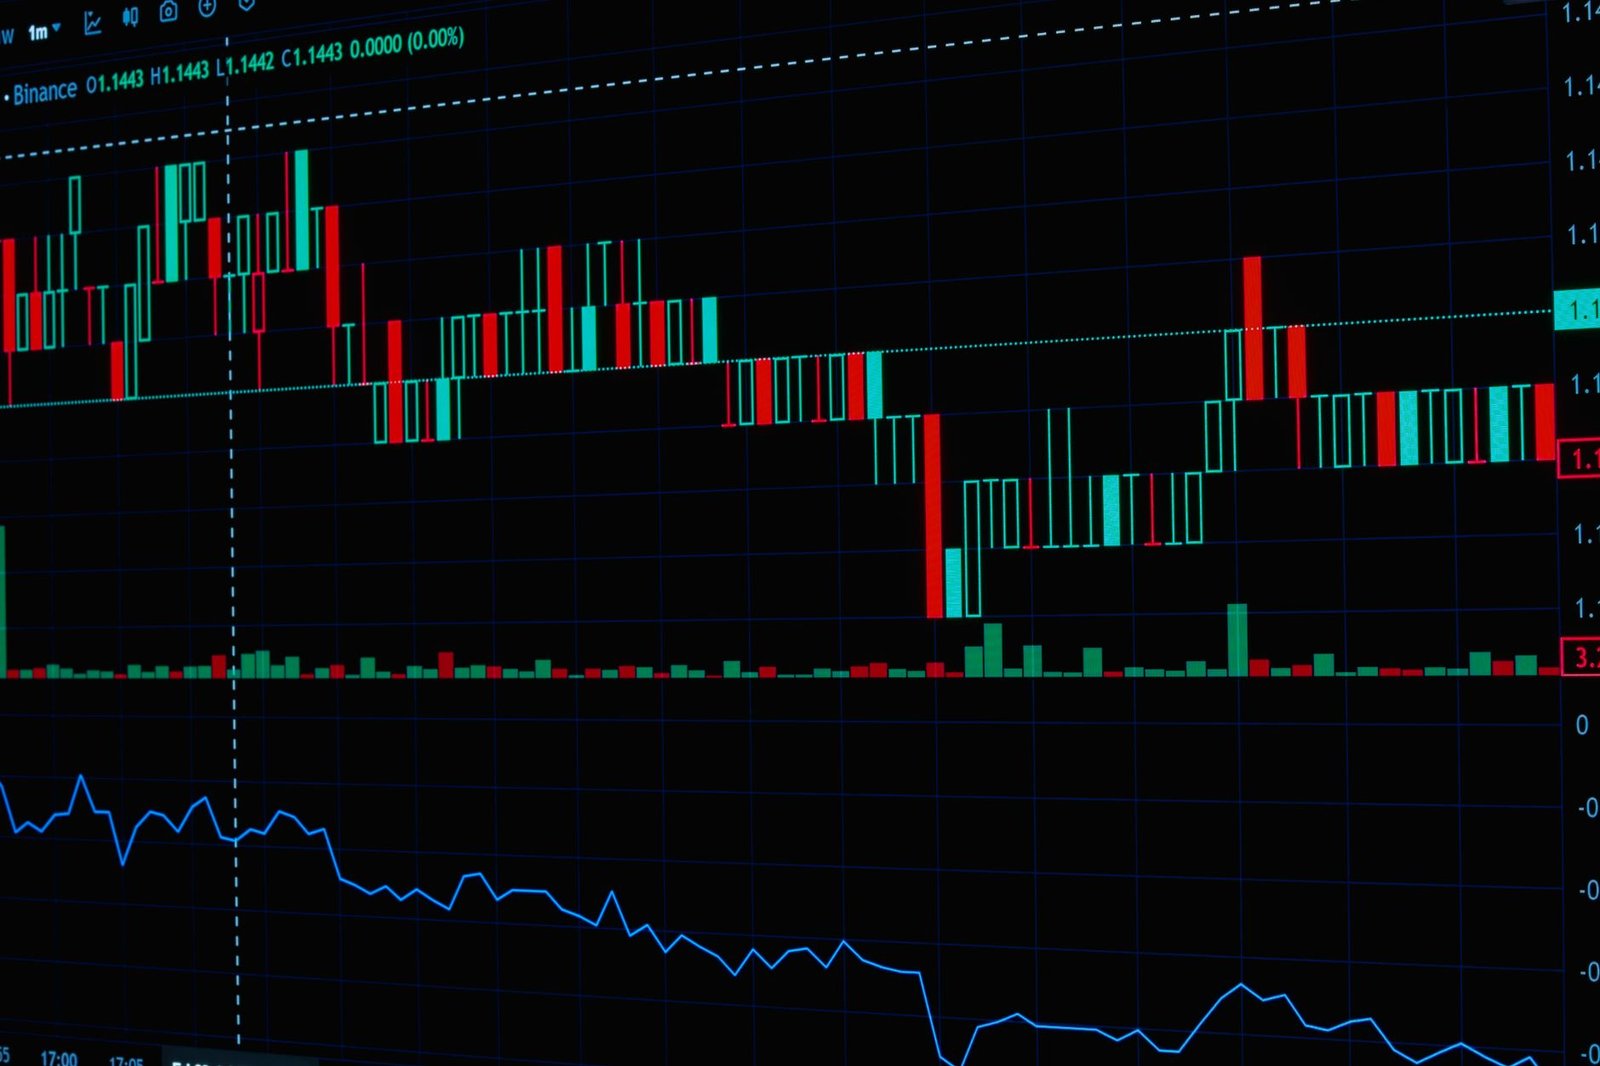
Let’s say the Nifty 50 has been in a strong uptrend and recently made a new all-time high. However, upon checking the New Highs-New Lows indicator, you notice that the number of stocks hitting new 52-week highs has been steadily declining over the past few weeks, while the number of stocks hitting new 52-week lows has started to tick up. This is a bearish divergence. The headline index is still rising, but the underlying participation is weakening. This alert suggests caution, and a trader might consider tightening stop-losses on existing long positions or looking for shorting opportunities if the market shows signs of turning downwards.
Example: Confirming a Bullish Reversal
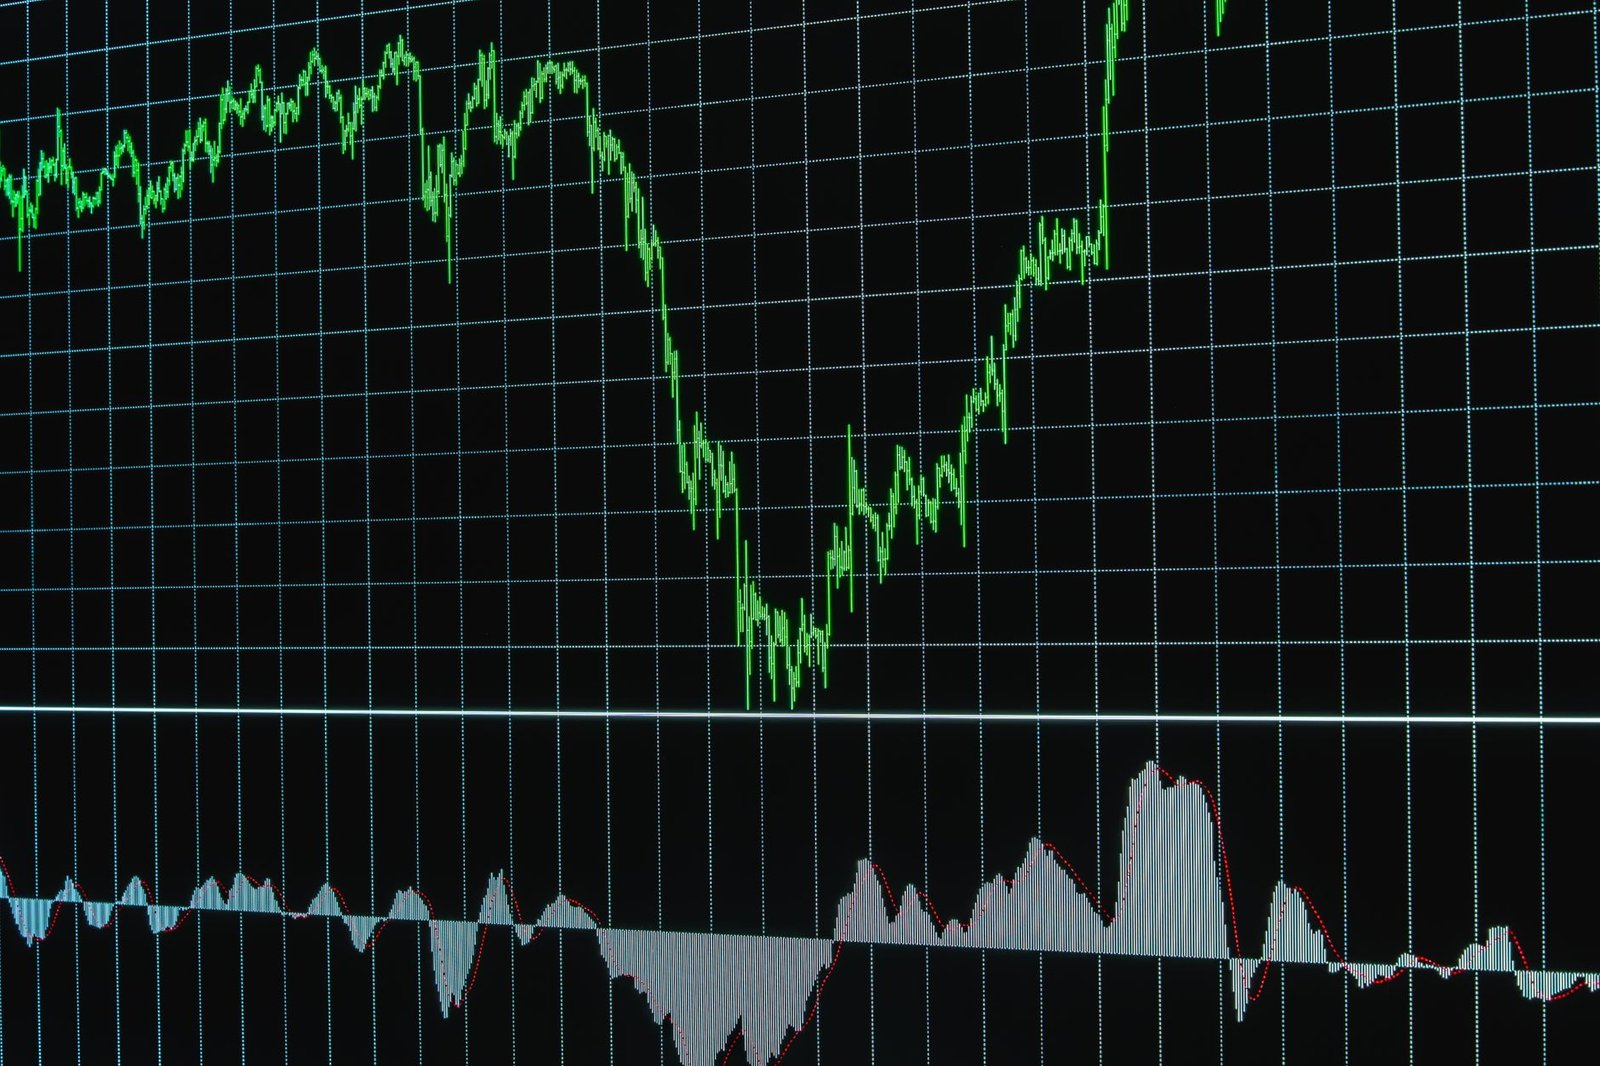
Suppose the Nifty 50 has experienced a sharp correction and is hovering around a key support level. The price action might look indecisive. However, when you examine the Advance-Decline Line, you see that it stopped declining a week ago and has started to trend upwards, even though the Nifty 50 only recently bottomed. Furthermore, the A/D Ratio has been showing increasing numbers of advancers over decliners for several days. This strong bullish breadth divergence signals that institutional money or smart money might be starting to accumulate, suggesting the correction is likely over and a new uptrend could be forming.
Challenges and Limitations
While powerful, market breadth indicators are not infallible and come with their own set of challenges.
One primary limitation is that they are lagging indicators; they confirm what has already happened in terms of stock participation. Therefore, using them requires patience and a focus on anticipating the implications of current breadth trends on future price movements.
Another challenge is interpreting extreme readings. A very high A/D Ratio doesn’t always mean an immediate reversal; sometimes, strong trends can persist even with frothy breadth. Similarly, an oversold breadth reading doesn’t guarantee an immediate bounce. Market sentiment and broader economic factors can keep a trend going longer than breadth indicators might suggest.
Furthermore, different breadth indicators can sometimes give conflicting signals. For instance, the A-D Line might be trending up, while the NHNL indicator is showing weakness. In such cases, a trader needs to exercise judgment, perhaps giving more weight to the indicator that has historically been more reliable for their specific market or timeframe. It’s why having a comprehensive toolset, perhaps including a specialised Trend Traders Tool, can be beneficial.
How to Integrate with Technical Analysis
Market breadth indicators complement traditional technical analysis beautifully. They provide a macro view of market health that can validate or challenge signals generated by price patterns, support/resistance levels, or moving averages.
For example, if you identify a bullish chart pattern like a ‘double bottom’ on the Nifty 50, and simultaneously, the Advance-Decline Line is showing a bullish divergence or is trending upwards, this confluence of signals significantly increases the probability of the pattern successfully playing out. The strong breadth confirms that the underlying market is supportive of the anticipated upward move.
Conversely, if a stock or index breaks above a resistance level, but the market breadth indicators are deteriorating, it serves as a warning sign. This ‘false breakout’ scenario might be avoided by waiting for breadth confirmation before entering a long position. It highlights that the price move is not supported by broad market participation.
In essence, breadth indicators act as a ‘second opinion’ from the collective market, helping to filter out weaker signals and confirm stronger ones. This layered approach is essential for making consistently profitable trading decisions in the dynamic Indian stock market.

Frequently Asked Questions
What is the most common market breadth indicator?
The Advance-Decline Line (A-D Line) is often considered the most fundamental and widely used market breadth indicator, tracking the cumulative difference between advancing and declining stocks.
Can market breadth indicators predict market tops and bottoms?
While not perfect predictors, market breadth indicators can provide early warnings of potential market tops (e.g., bearish divergences) and bottoms (e.g., bullish divergences) by showing shifts in underlying participation before they are fully reflected in index prices.
When should I use market breadth indicators?
Market breadth indicators are most useful for confirming existing trends, identifying potential trend reversals through divergences, and assessing the overall health and participation level of the market, especially in trending environments.
Are market breadth indicators better than price action?
Neither is inherently ‘better.’ Market breadth indicators provide a different perspective on market internals that complements price action analysis, leading to more robust trading decisions when used in conjunction.
How many stocks are typically considered for market breadth analysis on NSE?
While indices like the Nifty 50 have 50 stocks, market breadth analysis often considers the participation across hundreds or even thousands of stocks listed on the NSE to gauge broader market sentiment.
Can I use market breadth indicators for intraday trading?
Yes, market breadth indicators can be adapted for intraday trading by using shorter timeframes and focusing on indicators like the intraday A/D Ratio or volume participation, though they are generally more reliable for swing and positional trading.
Key Takeaways
- Market breadth indicators gauge the participation of stocks in market moves, offering insights beyond just index price.
- They help confirm trends, identify divergences, and signal potential reversals, enhancing trading decision-making.
- Key indicators include the Advance-Decline Line, A/D Ratio, and New Highs-New Lows.
- Divergences between price and breadth indicators are crucial signals of potential trend changes.
- Breadth analysis complements traditional technical analysis, providing a more comprehensive market view.
- While powerful, they have limitations and should be used in conjunction with other analytical tools.
Trading involves risks, and market breadth indicators are tools to aid decision-making, not guarantees of profit.




 Finovatives