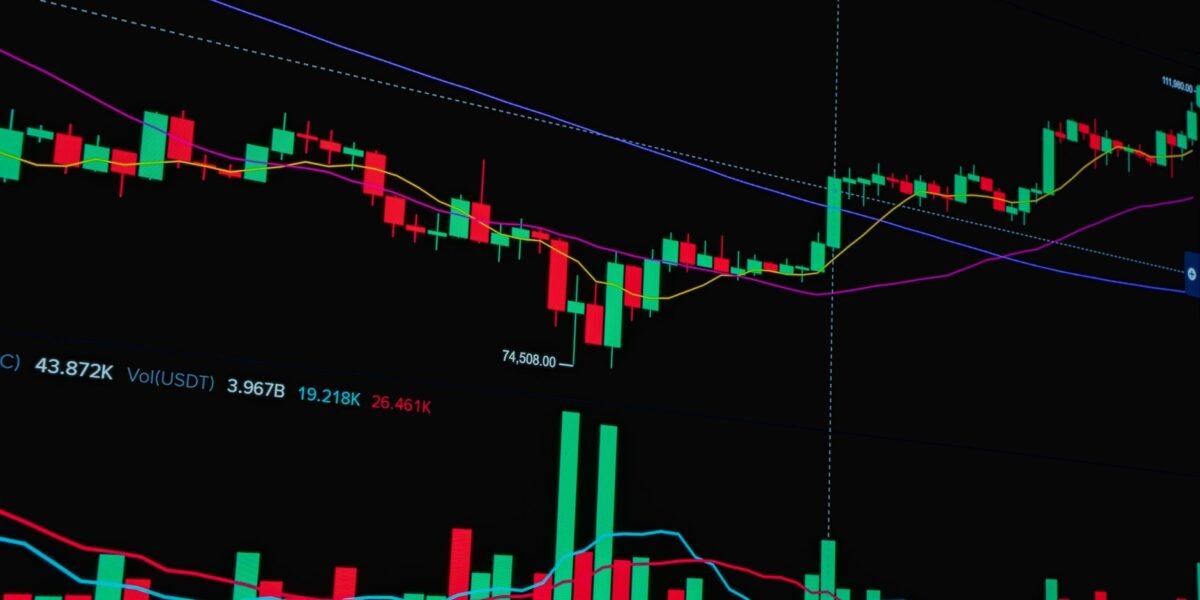
TL;DR: Support and resistance are critical price levels in stock trading where price trends tend to pause or reverse due to a balance of buying and selling pressure, acting as vital guides for entry and exit points.
Key Stats at a Glance:
- Nifty 50 has seen an average annual return of approximately 12% over the last decade.
- NSE’s market capitalisation exceeds ₹400 lakh crore as of early 2024.
- Over 5,000 listed companies trade on Indian stock exchanges (NSE & BSE combined).
- Support/Resistance levels can form over intraday, daily, weekly, or monthly charts.
What are Support and Resistance Levels?
Support and resistance levels are horizontal price zones on a stock chart where the price has historically found it difficult to move beyond, either downwards (support) or upwards (resistance).
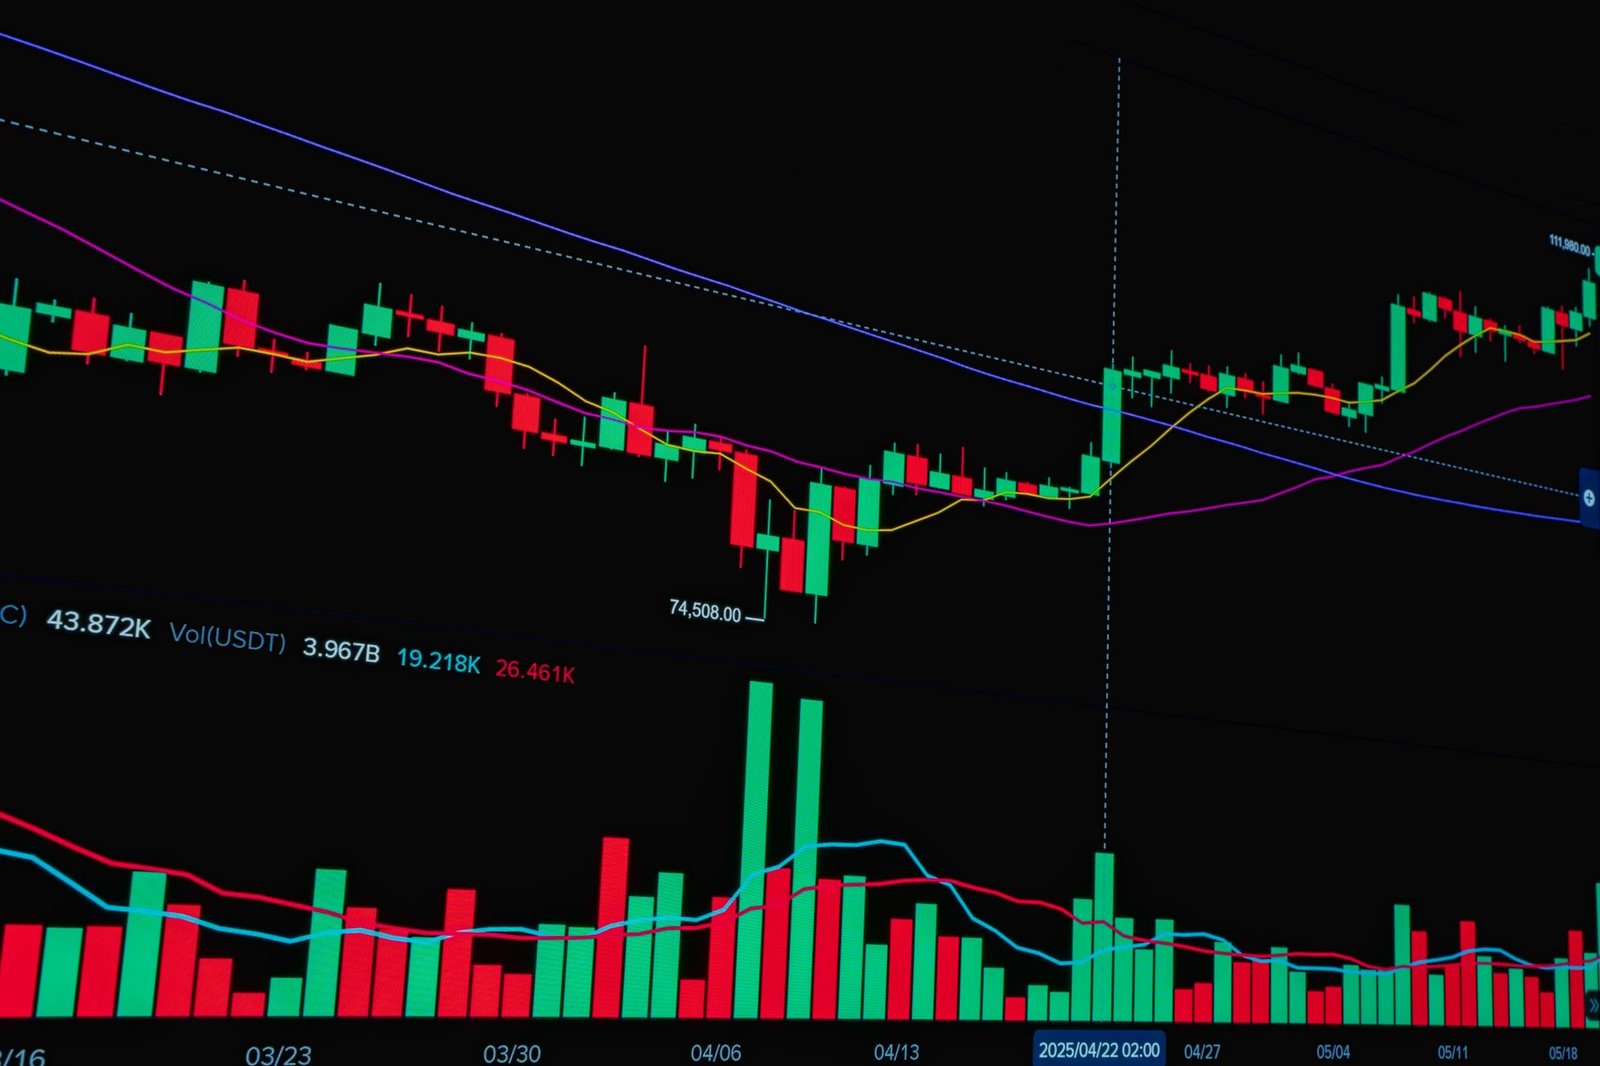
Think of support as the floor and resistance as the ceiling for a stock’s price. Support occurs when buying interest is strong enough to overcome selling pressure, preventing further price decline. Conversely, resistance emerges when selling interest becomes strong enough to overcome buying pressure, halting further price increases. These levels are not exact lines but rather zones, and their significance grows with the number of times a price has reacted to them.
How are Support and Resistance Levels Identified?
These key levels are identified by observing historical price action, looking for areas where prices have repeatedly reversed or consolidated.
Traders primarily use several methods to pinpoint these crucial zones:
- Previous Highs and Lows: The simplest way is to look at past peak prices (potential resistance) and trough prices (potential support). A price that stalled or reversed multiple times at a certain level is a strong candidate.
- Trendlines: Diagonal lines connecting a series of rising lows (support trendline) or falling highs (resistance trendline) can also indicate dynamic support and resistance.
- Moving Averages: Commonly used moving averages like the 50-day, 100-day, or 200-day Simple Moving Average (SMA) can act as dynamic support or resistance, especially in trending markets.
- Psychological Levels: Round numbers (e.g., ₹100, ₹500, ₹1000) often act as psychological support or resistance points simply because they are easy for traders to remember and trade around.
- Fibonacci Retracement Levels: These are calculated based on a mathematical sequence and can highlight potential support and resistance areas where a price might retrace before continuing its original trend.
The Role of Volume in Confirmation
Volume is a critical companion when identifying support and resistance. A strong reaction at a support level accompanied by high buying volume can confirm its strength. Similarly, a price rejection at resistance with high selling volume adds credibility to that resistance zone. Low volume at these levels might suggest a weaker conviction and a higher chance of a breakout.
Why are Support and Resistance Important for Traders?
Understanding and correctly applying support and resistance levels is fundamental because they provide actionable insights into potential price movements and market sentiment.
These levels are indispensable for several reasons:
- Entry and Exit Points: Traders use support levels to identify potential buying opportunities (entering long positions) and resistance levels to find opportune moments to sell or take profits (exiting long positions or entering short positions).
- Stop-Loss Placement: Support levels are ideal locations to place stop-loss orders for long positions, as a break below support suggests the trade may be moving against the trader. Conversely, resistance levels are used for stop-loss orders on short positions.
- Breakout and Breakdown Signals: When a price decisively moves through a resistance level, it signals a potential breakout, suggesting an upward trend continuation. If the price breaks decisively below a support level, it’s a breakdown, indicating a potential downtrend continuation.
- Risk Management: By defining these levels, traders can better manage their risk per trade, understanding potential downside if a level fails.
Support Becoming Resistance, and Vice Versa
A crucial concept is the ‘polarity principle’: when a support level is broken, it often transforms into a resistance level on subsequent price rallies. Conversely, when a resistance level is broken, it tends to act as a support level on future price declines. This dynamic shift is a powerful signal for traders to re-evaluate their positions.
How to Use Support and Resistance in Your Trading Strategy
Effectively integrating support and resistance into your trading strategy involves a systematic approach to identification, confirmation, and action.
Here’s a step-by-step guide:
- Choose Your Timeframe: Decide on your trading style (day trading, swing trading, long-term investing) and select the appropriate chart timeframe (e.g., 5-minute, hourly, daily, weekly). Support and resistance levels vary significantly across different timeframes.
- Identify Potential Levels: Scan charts for historical price points where the stock has shown repeated buying or selling pressure. Look for clusters of highs and lows.
- Draw Your Zones: Mark these identified levels on your chart. It’s often best to draw horizontal lines or shaded areas to represent these zones rather than single points.
- Look for Confirmation: Wait for the price to interact with these levels. Observe the volume. A strong bounce off support with high volume, or a sharp rejection at resistance with high selling volume, provides confirmation.
- Plan Your Trade: Based on the interaction with the level, decide your entry point. For instance, if a stock bounces off support, you might consider entering a long position near that support.
- Set Stop-Loss: Always place a stop-loss order just beyond the support level for a long trade, or beyond the resistance level for a short trade, to limit potential losses if the level breaks.
- Define Your Target: Set a profit target, perhaps at the next significant resistance level or based on a risk-reward ratio (e.g., 1:2 or 1:3).
- Monitor and Adjust: Continuously monitor your trade and the price action around the identified levels. Be prepared to adjust your strategy if the market conditions change or if a level is decisively broken.
Using Support and Resistance with Other Indicators
While powerful on their own, support and resistance levels gain further utility when combined with other technical indicators. For example, spotting an oversold condition on an RSI indicator near a strong support level can provide a stronger buy signal than either indicator alone. Similarly, finding resistance coinciding with a bearish divergence on MACD can strengthen a sell signal.
Common Mistakes When Trading Support and Resistance
Even experienced traders can fall prey to common pitfalls when trading these essential price levels.
Avoid these frequent errors:
- Treating Levels as Exact Lines: Remember these are zones. Price can sometimes slightly overshoot or undershoot a level before reversing.
- Ignoring Volume: Trading solely on price levels without considering volume confirmation can lead to false signals.
- Trading on Too Low a Timeframe: Very short timeframes can generate noisy signals, making it harder to distinguish true support and resistance from minor fluctuations.
- Not Adjusting for Polarity: Failing to recognise when a broken support becomes resistance, or vice versa, can lead to incorrect trade setups.
- Over-reliance on a Single Level: A single instance of a price reaction doesn’t make a strong level. Look for historical significance.
- Chasing Price Breakouts: Jumping into a trade immediately after a breakout or breakdown without waiting for confirmation can lead to buying at the top or selling at the bottom.
Frequently Asked Questions
What is the strongest type of support?
The strongest support is typically a historically significant level that has been tested multiple times by price and held, especially when accompanied by high trading volume during bounces.
Can support and resistance levels change?
Yes, support and resistance levels are not static. As market dynamics evolve and prices move significantly, old levels can break, and new ones can form. The polarity principle highlights this dynamic nature.
Are support and resistance levels guaranteed to hold?
No, they are not guaranteed. Price can and does break through support and resistance levels. They represent probabilities rather than certainties, hence the importance of stop-losses.
How many support and resistance levels should I look for?
Focus on the most significant levels on your chosen timeframe, typically those tested multiple times. Trying to track too many can lead to analysis paralysis.
What is a breakout in trading?
A breakout occurs when the price of an asset moves decisively beyond a defined resistance level, suggesting potential for further upward movement. Conversely, a breakdown is a move below support.
How do I find support and resistance on TradingView?
On TradingView, you can use the horizontal line tool to draw support and resistance levels by identifying past price highs and lows where the price has reversed or consolidated. Look for patterns on different chart intervals.
Key Takeaways
- Support acts as a price floor, while resistance acts as a price ceiling.
- These levels are identified through historical price action, trendlines, and moving averages.
- Volume confirmation is crucial for validating the strength of support and resistance zones.
- They are vital for setting entry/exit points, stop-losses, and identifying potential breakouts/breakdowns.
- The polarity principle states that broken support can become resistance, and vice versa.
- Trading support and resistance requires patience, confirmation, and robust risk management.
- Using these concepts with other indicators like RSI or MACD can enhance trading signals.
Trading in the stock market involves inherent risks. Always conduct your own research and consider consulting with a SEBI-registered investment advisor before making any investment decisions.






 Finovatives