TL;DR: Support and resistance levels are critical price points in stock trading where a stock’s price tends to stop falling (support) or stop rising (resistance), providing vital clues for entry, exit, and risk management strategies.
Key Stats at a Glance:
- Nifty 50 has historically shown strong reactions around key psychological levels (e.g., 10000, 15000, 20000).
- Over 70% of intraday trades in the Indian stock market are reported to be speculative, often relying on technical indicators like S&R.
- A breakout above resistance or below support can lead to a price move of at least 3-5% in many liquid Indian stocks.
- NSE and BSE list thousands of stocks, making technical analysis tools like S&R indispensable for traders.
- Backtesting shows that strategies using S&R can improve win rates by up to 15% when combined with other indicators.
What are Support and Resistance Levels?
Support is a price level where a downtrend is expected to pause due to a concentration of buying interest, potentially causing the price to bounce back up. Resistance is a price level where an uptrend is expected to pause due to a concentration of selling interest, potentially causing the price to reverse downwards.
Defining Support
Support acts like a floor for the stock price. When the price approaches a support level, demand (buying pressure) is typically strong enough to overcome supply (selling pressure), preventing further decline. This is often because traders and investors see the stock as undervalued at this price and begin to buy.
Defining Resistance
Conversely, resistance acts like a ceiling. As the price approaches a resistance level, supply tends to outweigh demand, leading to a slowdown or reversal of the upward movement. This occurs as traders who bought at lower prices may decide to sell at this perceived high point, or new sellers enter the market.
The Psychology Behind S&R
These levels are not arbitrary lines on a chart; they are born from the collective psychology of market participants. Traders remember past price points where significant buying or selling occurred. When the price revisits these areas, those past trading decisions often repeat, reinforcing the support or resistance.
Previous Resistance Becomes New Support (and Vice Versa)
A crucial concept is the polarity principle: once a resistance level is decisively broken, it often transforms into a new support level. Similarly, when a support level breaks, it frequently becomes a new resistance level. This phenomenon is a testament to how market memory influences future price action.
How to Identify Support and Resistance Levels
Identifying these levels involves looking at historical price action on trading charts. Common methods include examining previous highs and lows, trendlines, moving averages, and Fibonacci retracements. The more times a price level has previously acted as support or resistance, the stronger and more significant it is considered.
Using Previous Highs and Lows
The simplest way to spot potential S&R is to look at historical price charts and identify significant peaks (highs) and troughs (lows). A horizontal line drawn through a series of previous highs can indicate a resistance zone, while a line through a series of previous lows points to a support zone. The more touches, the stronger the level.
Trendlines as Dynamic S&R
Trendlines offer dynamic support and resistance. An upward-sloping trendline connects a series of higher lows and can act as support in an uptrend. A downward-sloping trendline connects a series of lower highs and can act as resistance in a downtrend. These levels are not static and move with the price.
Moving Averages
Commonly used moving averages like the 50-day, 100-day, or 200-day Simple Moving Average (SMA) or Exponential Moving Average (EMA) often act as psychological and dynamic support or resistance levels. Traders watch these averages closely for potential turning points.
Fibonacci Retracement Levels
Developed from mathematical sequences, Fibonacci retracement levels (like 38.2%, 50%, and 61.8%) are widely used by traders to predict potential support and resistance areas after a significant price move. These levels can provide surprisingly accurate turning points.
How to Use Support and Resistance in Trading
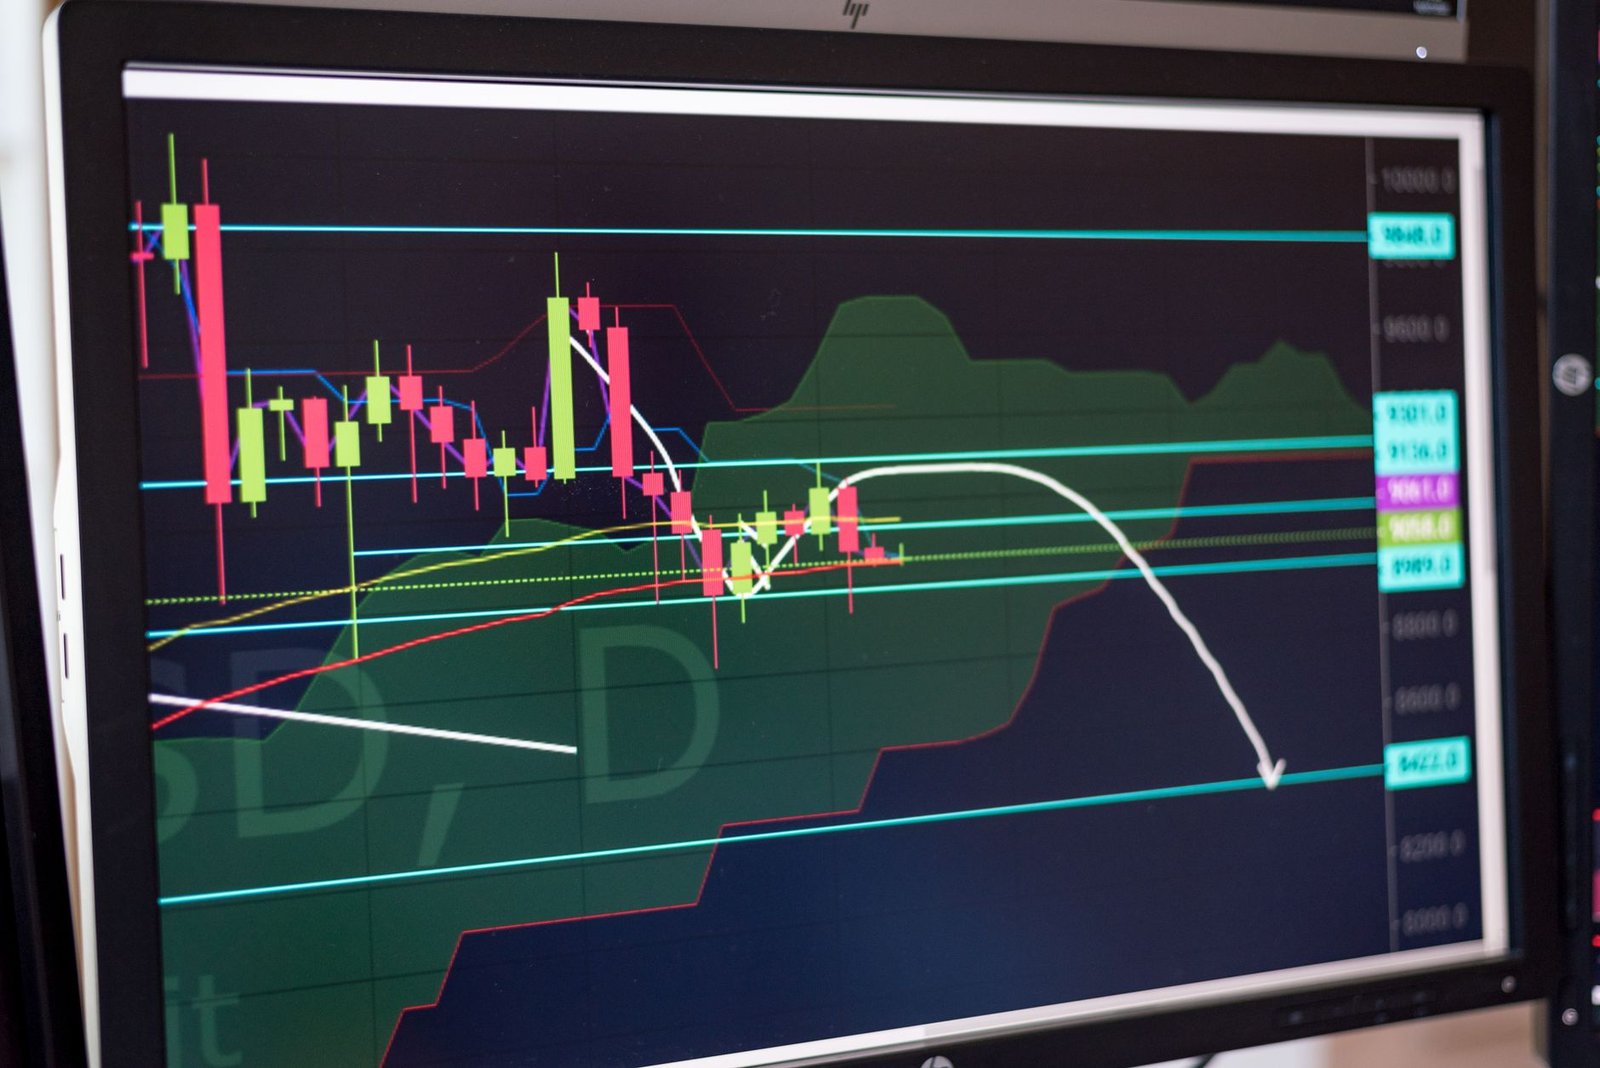
Support and resistance levels are not just for identification; they are powerful tools for strategic trading. They help traders determine optimal entry and exit points, set stop-loss orders to manage risk, and identify potential breakouts or breakdowns.
Trading Breakouts
A breakout occurs when the price moves decisively beyond a resistance level or support level. Trading a breakout involves entering a long position when the price breaks above resistance, expecting it to continue rising, or entering a short position when the price breaks below support, expecting it to fall further. Confirmation is key.
Trading Reversals
Reversal trading involves anticipating that the price will bounce off a support or resistance level rather than breaking through it. Traders might buy near a support level, expecting it to hold, or sell near a resistance level, expecting it to reject the price. This strategy requires careful timing and confirmation.
Setting Stop-Loss Orders
Support and resistance levels are crucial for risk management. When buying near a support level, a stop-loss order is typically placed just below that support. When selling short near a resistance level, the stop-loss is placed just above that resistance. This limits potential losses if the trade goes against you.
Setting Profit Targets
These levels also help in setting realistic profit targets. For example, if you buy near a support level in an uptrend, the next significant resistance level can be a logical target for taking profits. Conversely, if you initiate a short trade near resistance, the next support level is a potential profit target.
How to Implement S&R Trading Strategy
- Identify Key Levels: Analyse historical price charts to pinpoint significant horizontal support and resistance zones, trendlines, or moving averages.
- Wait for Confirmation: Do not trade solely based on the level itself. Wait for the price to react to the level (e.g., a bounce off support, a rejection at resistance) or for a clear breakout/breakdown with increased volume.
- Determine Entry Point: Enter a trade either near a confirmed support for a long position or near confirmed resistance for a short position, or on the breakout/breakdown.
- Set Stop-Loss: Place your stop-loss order just beyond the identified support (for longs) or resistance (for shorts) to limit potential losses.
- Set Profit Target: Identify the next significant resistance level as a target for long trades, or the next support level for short trades.
- Monitor the Trade: Keep an eye on the price action and adjust your stop-loss (e.g., trailing stop) as the trade progresses in your favour.
Common Mistakes to Avoid
While powerful, S&R levels are not foolproof. Novice traders often make mistakes that can lead to losses. Being aware of these pitfalls can significantly improve trading outcomes.
Treating Levels as Exact Lines
Support and resistance are often zones rather than precise price points. Prices can briefly dip below support or rise above resistance before reversing. Expecting exact precision can lead to premature stop-outs or missed entries.
Ignoring Volume
Volume is a crucial confirmation tool. A breakout above resistance or below support is much more significant and likely to succeed if accompanied by high trading volume. Low volume moves can be false signals.
Trading Without a Stop-Loss
Never trade without a stop-loss, especially when using S&R levels. Market conditions can change rapidly, and a well-placed stop-loss is your primary defence against substantial losses.
Over-Reliance on a Single Indicator
Support and resistance should be used in conjunction with other technical analysis tools and indicators (like RSI, MACD, or candlestick patterns) for better confirmation and a more robust trading strategy. Consider using a comprehensive TradingView indicator to enhance your analysis.

Frequently Asked Questions
What is the most reliable way to find support and resistance?
While no method is 100% reliable, using a combination of horizontal levels from previous highs/lows, trendlines, and significant moving averages (like the 200-day SMA) often provides the strongest confluence.
Can support and resistance levels change?
Yes, they can. Once a strong support level is broken, it often becomes resistance. Conversely, broken resistance often turns into support. Market dynamics and sentiment shifts can also alter the significance of levels over time.
How many support and resistance levels should I look for?
Focus on the most significant levels on the chart timeframe you are using. Typically, 2-3 key support and resistance zones are sufficient for making trading decisions, especially for short-term traders.
What is a breakout in relation to support and resistance?
A breakout is when the stock price moves decisively past a resistance level (indicating potential upside) or below a support level (indicating potential downside), often accompanied by increased trading volume.
Is support and resistance applicable to all markets?
Yes, the principles of support and resistance are universal and applicable across various markets, including stocks (NSE, BSE), forex, commodities (MCX), and cryptocurrencies.
Key Takeaways
- Support is a price floor, resistance is a price ceiling.
- Identify S&R using previous highs/lows, trendlines, and moving averages.
- The polarity principle states that broken resistance becomes support, and broken support becomes resistance.
- Use S&R for entry/exit points, stop-losses, and profit targets.
- Confirm S&R signals with volume and other technical indicators.
- Avoid treating levels as exact lines and always use a stop-loss.
- These principles apply across various financial markets.
Trading involves risk, and past performance is not indicative of future results. Always conduct your own research before investing.






 Finovatives