TL;DR: Effective swing trading strategies for NSE stocks focus on capturing price swings over days or weeks using technical analysis, identifying trends, breakouts, and reversals at support/resistance levels. Success hinges on robust risk management, disciplined execution, and understanding market sentiment.
Key Stats at a Glance:
- Nifty 50 annualised return (2014-2023): Approx. 12.1%
- NSE average daily turnover (FY23): Over ₹80,000 Crore
- Average swing trade duration: 2 days to 3 weeks
- SEBI mandate for market makers in F&O: To enhance liquidity
- Over 4,000+ listed companies on NSE
What is Swing Trading?
Swing trading is a trading strategy that attempts to capture gains in a stock (or any financial market) over a period of days to weeks. Swing traders aim to profit from price swings that are expected to be larger than those captured by day traders, but shorter than those sought by long-term investors.
Swing trading occupies a middle ground between day trading and long-term investing. Unlike day traders who close all positions before the market closes, swing traders hold positions overnight and over weekends. This allows them to benefit from price movements that occur outside regular trading hours. The core idea is to identify a trend or a potential reversal and hold the position as long as the momentum persists, exiting before a significant reversal occurs.
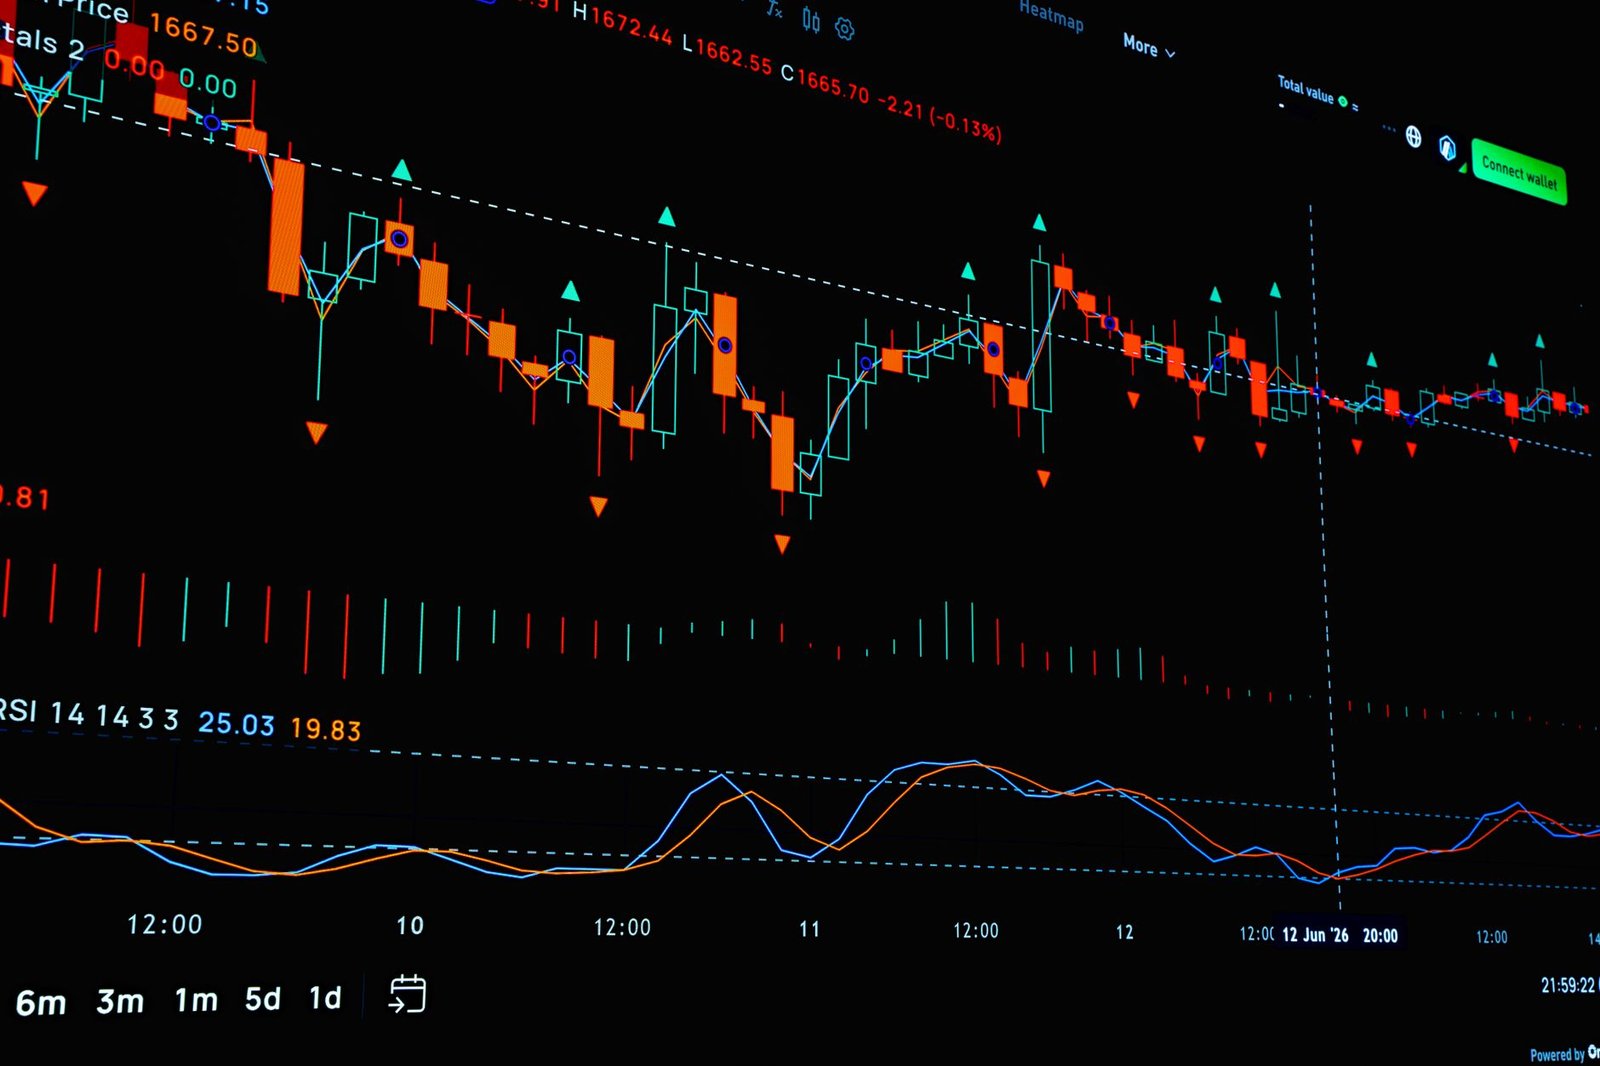
The primary tools for swing traders are technical analysis charts, indicators, and price action patterns. Fundamental analysis might play a secondary role, but the focus remains on short-to-medium term price movements driven by market psychology and technical setups.
What are the Best Swing Trading Strategies for NSE Stocks?
The most effective swing trading strategies for NSE stocks often involve identifying a clear trend and trading in its direction, exploiting breakouts from consolidation patterns, or capitalising on reversals at key support and resistance levels.
These strategies are popular among Indian retail traders due to the volatility and liquidity often present in NSE stocks, which can offer ample opportunities for capturing price swings. The key is to combine a chosen strategy with disciplined risk management and precise entry/exit points. Let’s explore some of the most effective ones:
1. Trend Following Strategy
This strategy involves identifying an existing uptrend or downtrend and entering a trade in the direction of that trend. The aim is to ride the trend for as long as possible, capturing a significant portion of the price movement.
Identifying Trends
Uptrends are generally identified by higher highs and higher lows on a price chart, while downtrends are characterised by lower highs and lower lows. Moving averages, such as the 50-day and 200-day Simple Moving Averages (SMAs), are commonly used to confirm the trend. A stock trading above its 50-day SMA, which is also above its 200-day SMA, suggests an uptrend.
Entry and Exit
For an uptrend, traders look for pullbacks to a support level (like a moving average or a previous resistance level now acting as support) for entry. The stop-loss is typically placed below the recent low or the support level. The target can be set based on previous resistance levels or using risk-reward ratios.
2. Breakout Trading Strategy
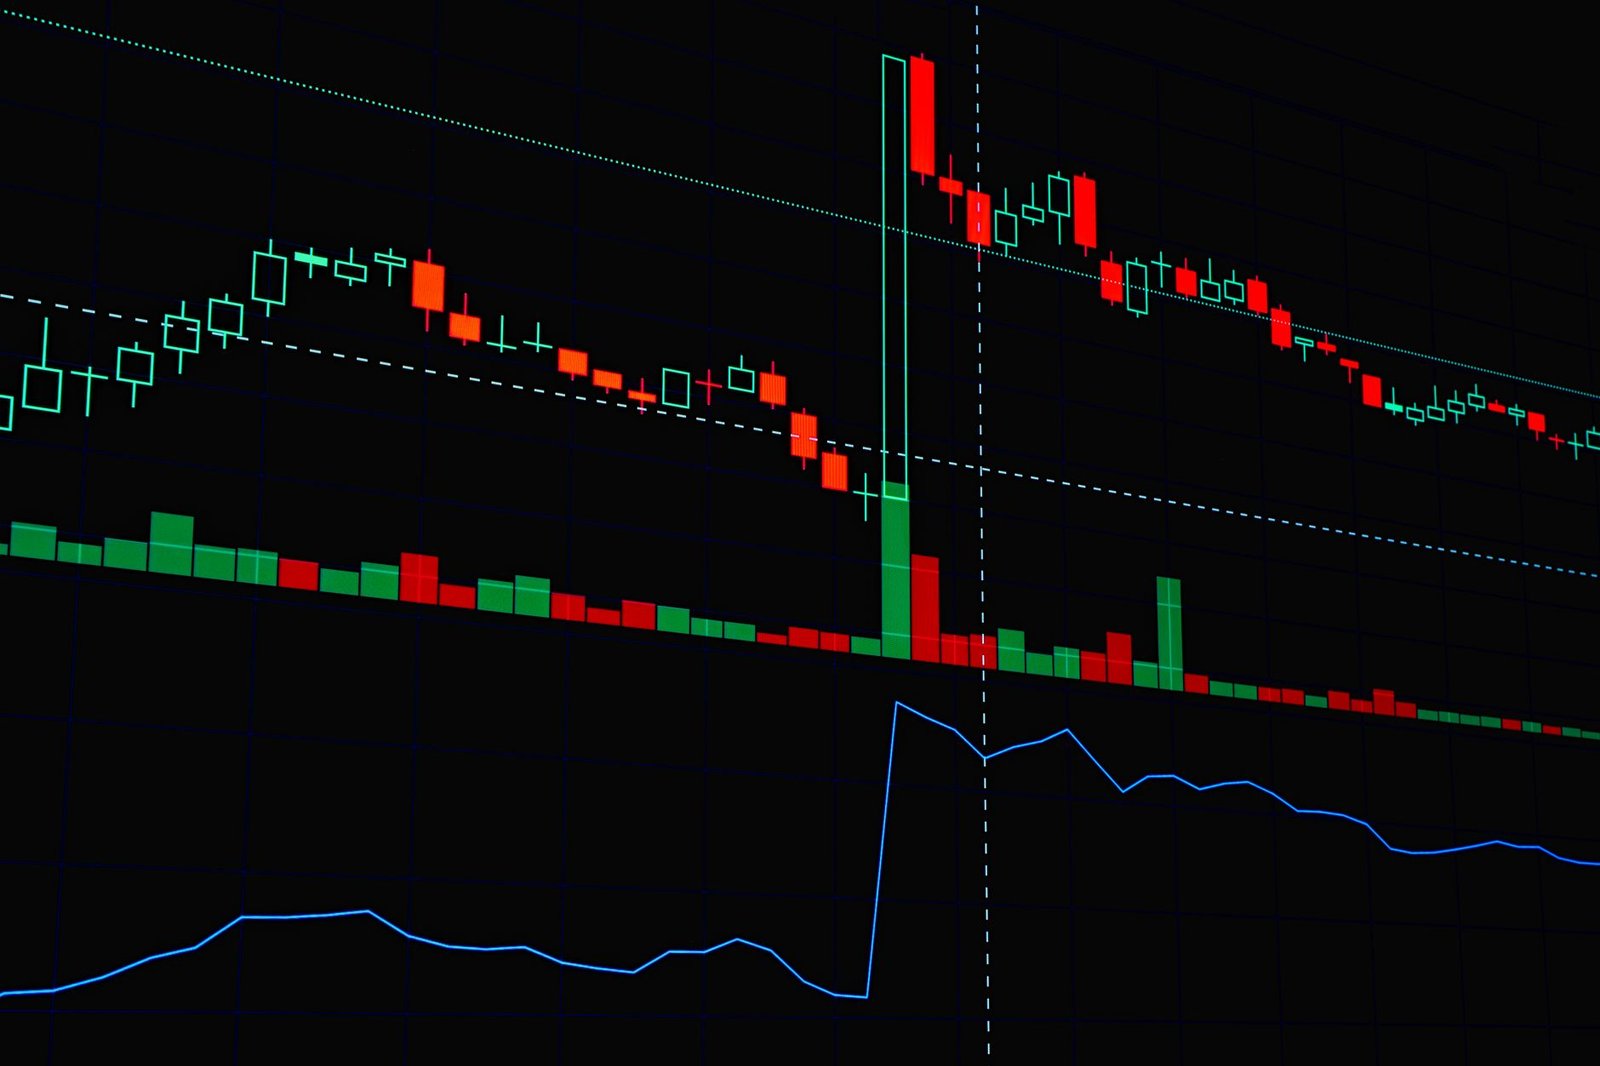
Breakout trading involves identifying periods of price consolidation (ranges) and entering a trade when the price decisively breaks out of this range, signalling a potential continuation of momentum in the direction of the breakout.
Consolidation Patterns
Common consolidation patterns include rectangles, triangles (ascending, descending, symmetrical), and flags. Traders wait for the price to close significantly beyond the boundaries of these patterns, often accompanied by increased trading volume.
Volume Confirmation
Volume is crucial in breakout trading. A breakout accompanied by significantly higher volume than average lends more credibility to the move. A breakout on low volume might be a false signal (a ‘fakeout’).
Stop-Loss and Targets
For an upward breakout, the stop-loss is often placed just below the breakout level or the pattern’s resistance line. For a downward breakout, it’s placed just above the breakout level or the pattern’s support line. Profit targets can be estimated by measuring the height of the consolidation pattern and projecting it from the breakout point.
3. Support and Resistance Reversal Strategy
This strategy focuses on identifying key support and resistance levels where the price has historically shown a tendency to reverse. Traders enter a position when the price shows signs of bouncing off a support level (for a long trade) or rejecting from a resistance level (for a short trade).
Identifying Key Levels
These levels can be identified by looking at past price action where the market repeatedly failed to move above a certain price (resistance) or below another price (support). Horizontal lines on the chart are drawn to mark these zones. Fibonacci retracement levels and pivot points are also valuable tools for identifying potential reversal zones.
Confirmation Signals
Traders look for specific candlestick patterns like hammers, bullish engulfing patterns near support, or shooting stars, bearish engulfing patterns near resistance to confirm a potential reversal. Divergence on oscillators like the Relative Strength Index (RSI) or MACD can also be an early warning of a reversal.
Risk Management
The stop-loss is placed just below the support level for a long trade, or just above the resistance level for a short trade. Profit targets are often set at the next significant resistance or support level, or based on a predetermined risk-reward ratio.

How to Implement a Swing Trading Strategy
- Define Your Trading Goal: Determine your profit targets and acceptable risk per trade.
- Choose a Market and Timeframe: Select NSE stocks with sufficient liquidity and volatility, and focus on daily or 4-hour charts for swing trading.
- Identify a Strategy: Select one of the proven strategies (trend following, breakout, reversal) that suits your trading style.
- Technical Analysis: Use charting tools and indicators (e.g., Moving Averages, RSI, MACD, Volume) to identify potential entry signals based on your chosen strategy. Consider a robust TradingView indicator for enhanced analysis.
- Risk Management: Determine your entry price, stop-loss level (to limit potential losses), and target profit level before entering any trade. Aim for a minimum risk-reward ratio of 1:2.
- Entry Execution: Place your buy or sell order with the predetermined stop-loss and target price.
- Trade Management: Monitor the trade closely. Consider moving your stop-loss to break-even once the trade moves in your favour, or trailing it to lock in profits as the price advances.
- Review and Refine: After exiting a trade, review its performance. What worked? What didn’t? Use these insights to improve your future trading decisions.
What Are the Essential Tools for Swing Traders?
Effective swing trading relies on a combination of reliable charting platforms, technical indicators, and a disciplined approach to risk management. Having access to real-time market data and advanced analytical tools can significantly improve decision-making.
Key tools include a robust charting software that allows for multiple indicator overlays and drawing tools, a reliable news source for understanding market sentiment, and a brokerage account with competitive pricing plans that suits your trading volume. Many traders also find specialised tools, like a well-configured TradingView indicator, indispensable for spotting opportunities.
1. Charting Software
Platforms like TradingView, MetaTrader, or broker-provided charting tools are essential. They offer various chart types (candlestick, bar, line), drawing tools (trendlines, Fibonacci), and the ability to apply numerous technical indicators.
2. Technical Indicators
Indicators like Moving Averages (SMA, EMA), MACD, RSI, Bollinger Bands, and Volume act as tools to confirm trends, identify overbought/oversold conditions, measure momentum, and signal potential breakouts or reversals. Understanding how to use them in confluence is key.
3. News and Sentiment Analysis
While swing trading is primarily technical, major news events (RBI policy, global economic data, company-specific announcements) can trigger significant price movements. Staying informed helps anticipate potential volatility. AMFI reports and NSE/BSE announcements are crucial for Indian markets.

4. Risk Management Tools
This includes stop-loss orders, take-profit orders, and position sizing calculators. Disciplined use of these tools is non-negotiable for capital preservation.
Frequently Asked Questions
What is the typical holding period for a swing trade?
Swing trades are typically held for a period ranging from a few days to a couple of weeks. The goal is to capture a significant price swing within this timeframe, exiting before the trend potentially reverses.
Is swing trading suitable for beginners in the Indian market?
Swing trading can be suitable for beginners if they start with a clear strategy, robust risk management, and a focus on learning. It requires more active management than long-term investing but less than day trading, making it a potential entry point.
Which technical indicators are most useful for swing trading NSE stocks?
Commonly useful indicators include Moving Averages (for trend identification), RSI and MACD (for momentum and potential reversals), and Volume (to confirm breakouts and trend strength).
How important is volume in swing trading?
Volume is highly important, especially for breakout strategies. A surge in volume accompanying a price breakout or breakdown suggests strong conviction behind the move, making the signal more reliable.
Can fundamental analysis be used in swing trading?
While primarily technical, fundamental analysis can provide a backdrop. Understanding a company’s health or upcoming events can help filter stocks or avoid trades during periods of high uncertainty, though the decision to enter/exit is usually driven by price action.
Key Takeaways
- Swing trading aims to profit from short-to-medium term price movements in NSE stocks, typically over days to weeks.
- Popular strategies include trend following, breakout trading, and support/resistance reversal plays.
- Technical indicators like Moving Averages, RSI, and MACD are crucial for identifying entry and exit points.
- Volume confirmation is vital, especially for breakout strategies, to validate the strength of the move.
- Strict risk management, including stop-loss orders and proper position sizing, is paramount for capital preservation.
- A disciplined approach, continuous learning, and the use of reliable charting tools are essential for successful swing trading.
- Consider exploring advanced tools like a specialized TradingView indicator to gain an edge in identifying trading opportunities.
Trading in securities is subject to market risks. Please read all the related documents carefully before investing.






 Finovatives