TL;DR: Analyzing the Indian stock market like a pro involves a disciplined approach combining technical and fundamental analysis, understanding market dynamics, and leveraging data-driven tools to make informed investment decisions on platforms like NSE and BSE.
Key Stats at a Glance:
- Nifty 50’s average annualised return (2014-2023): ~12.2%
- BSE Sensex’s 10-year CAGR: ~13.1%
- Number of listed companies on NSE: Over 2,000
- Average daily trading turnover on Indian exchanges: ₹50,000+ Crore
- SEBI mandate for market intermediaries: Strict compliance framework
What is Indian Stock Market Analysis?
Indian stock market analysis is the process of evaluating securities—primarily equities listed on the National Stock Exchange (NSE) and Bombay Stock Exchange (BSE)—to determine their future price movements and make informed investment or trading decisions.
The Dual Pillars: Technical vs. Fundamental Analysis
Prospective traders and investors often ponder whether to focus on charts or company reports. The reality is that a comprehensive analysis of the Indian stock market necessitates a strong understanding of both. Technical analysis involves studying historical price charts and trading volumes to identify patterns and predict future price trends, while fundamental analysis delves into a company’s financial health, industry position, and macroeconomic factors to ascertain its intrinsic value.
Historically, many successful traders have leaned heavily on one discipline. However, the current dynamic Indian market, with its rapid information flow and global interdependencies, rewards those who can synthesize insights from both approaches. For instance, a technically bullish chart pattern for a stock might be invalidated by negative fundamental news, or vice versa. Understanding this interplay is crucial.
Technical Analysis: Decoding Price Action
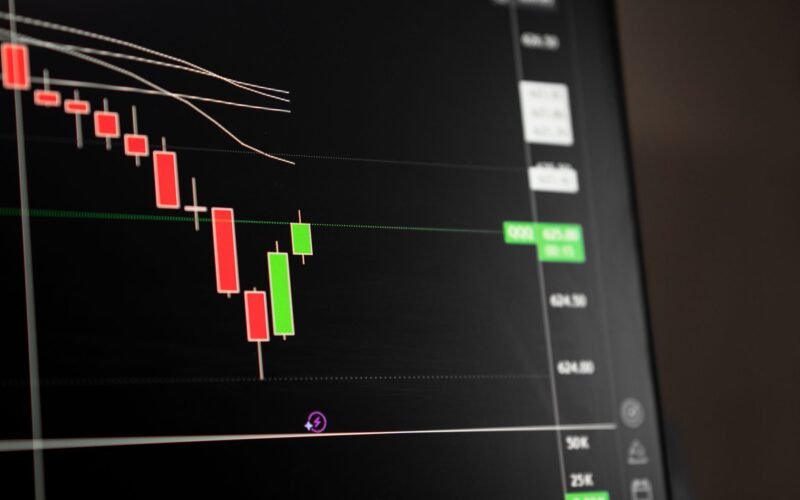
Technical analysis is built on the premise that all known information is reflected in the price. It uses historical data, primarily price and volume, to forecast future market movements. Key tools include chart patterns (like head and shoulders, triangles), trendlines, and indicators (like Moving Averages, RSI, MACD).
Chart Patterns and Trends
Identifying trends—uptrends, downtrends, and sideways consolidation—is fundamental. Chart patterns offer clues about potential trend reversals or continuations. For example, a ‘double bottom’ pattern often signals a potential upward reversal.
Technical Indicators for Confirmation
Indicators serve to confirm or contradict signals from price action. The Relative Strength Index (RSI), for instance, helps gauge overbought or oversold conditions, while Moving Average Convergence Divergence (MACD) can indicate momentum shifts.
Fundamental Analysis: The Intrinsic Value Equation
Fundamental analysis seeks to determine a stock’s ‘fair value’ by examining economic, industry, and company-specific factors. This approach is often favoured by long-term investors who aim to buy undervalued assets.
Economic and Industry Factors
Macroeconomic indicators such as GDP growth, inflation rates, interest rate policies by the Reserve Bank of India (RBI), and government policies significantly impact the overall market and specific sectors. Understanding these broader forces is essential.
Company-Specific Metrics
Key financial ratios like the Price-to-Earnings (P/E) ratio, Debt-to-Equity (D/E) ratio, Return on Equity (ROE), and Earnings Per Share (EPS) are critical for assessing a company’s performance and valuation. Examining a company’s management quality, competitive landscape, and future growth prospects is equally important.
How to Analyze the Indian Stock Market Effectively?
Effective analysis of the Indian stock market involves a structured approach, integrating various data points and tools to form a well-rounded perspective before committing capital.
- Define Your Investment Horizon and Goals: Are you a short-term trader or a long-term investor? Your objective dictates the type of analysis you prioritize.
- Select Your Analysis Tools: Choose between or combine technical and fundamental analysis based on your strategy. Consider using advanced TradingView indicators for real-time insights.
- Gather Data: Access financial statements, economic reports, market news, and historical price charts from reliable sources like NSE, BSE, and financial news portals.
- Perform Technical Analysis: Identify trends, support/resistance levels, and potential entry/exit points using charts and indicators.
- Conduct Fundamental Analysis: Evaluate a company’s financial health, competitive position, and valuation metrics. Assess macroeconomic factors relevant to the sector and the Indian economy.
- Consider Market Sentiment: Gauge the overall mood of the market, which can be influenced by news, events, and investor psychology.
- Formulate a Trading/Investment Plan: Based on your analysis, define your entry and exit strategies, position sizing, and risk management rules.
- Review and Adapt: Continuously monitor your investments and market conditions, and be prepared to adjust your strategy as needed.

Understanding Market Sentiment and News Flow
The Indian stock market, like any other, is susceptible to sentiment. News, whether related to corporate earnings, government policy, or geopolitical events, can trigger significant price movements. Professional analysts closely track news flow and sentiment indicators (like the India VIX for implied volatility) to anticipate market reactions.
Leveraging Data and Technology
Modern analysis relies heavily on data and technology. Sophisticated charting platforms, algorithmic trading tools, and data analytics software are essential for processing vast amounts of information quickly. Platforms offering real-time data and advanced analytical features, such as the Trend Traders Tool, can provide a significant edge.
What Are Key Indian Market Indicators to Watch?
Monitoring specific indicators provides a pulse on the health and direction of the Indian stock market, aiding in informed decision-making.
The Nifty 50 and Sensex
These are the benchmark indices representing the top-performing large-cap stocks on the NSE and BSE, respectively. Their movement often reflects the broader market trend. Analyzing their performance provides a macroeconomic view of the Indian equity landscape.
Sectoral Indices
India has a diverse economy, and specific sectors (like IT, banking, pharmaceuticals, energy) often perform differently. Sectoral indices, such as the Nifty Bank or Nifty IT, help traders identify which sectors are outperforming or underperforming, allowing for targeted investment.
Volatility Indices (e.g., India VIX)
The volatility index, or VIX, measures the market’s expectation of near-term volatility based on options prices. A rising VIX generally indicates increasing fear or uncertainty in the market, while a falling VIX suggests complacency or confidence.
Economic Data Releases
Key economic data points released by the government and RBI, such as inflation figures, industrial production numbers, and monetary policy statements, are closely watched as they can significantly influence market direction.
How to Manage Risk When Trading the Indian Market?
Risk management is paramount for survival and profitability in the dynamic Indian stock market. Implementing robust risk management strategies protects capital and ensures long-term sustainability.
Stop-Loss Orders
A stop-loss order is an order placed with a broker to buy or sell a security when it reaches a certain price. It is used to limit an investor’s loss on a security position. Setting appropriate stop-loss levels based on technical analysis (e.g., below a support level) is crucial.
Position Sizing
Position sizing refers to determining how much capital to allocate to a single trade. A common rule is to risk no more than 1-2% of your total trading capital on any single trade. This prevents any one bad trade from decimating your account.

Diversification
While not always applicable for very short-term traders, diversification across different stocks and sectors is a fundamental risk management technique for investors. It reduces the impact of poor performance in any single asset.
Regular Review and Discipline
Continuously reviewing your trading performance, identifying mistakes, and sticking to your trading plan are essential. Emotional trading, driven by fear or greed, is a major cause of losses.
Frequently Asked Questions
What is the most important indicator for the Indian stock market?
There isn’t a single ‘most important’ indicator. Professionals use a combination of market indices (Nifty 50, Sensex), volatility indices (India VIX), and economic data releases, alongside technical and fundamental analysis tools.
How can a beginner start analyzing the Indian stock market?
Beginners should start by understanding basic concepts of technical and fundamental analysis, learning to read financial statements, and tracking major market indices. Using platforms with clear data visualization and educational resources is highly recommended.
Should I use technical or fundamental analysis for Indian stocks?
Most successful traders and investors use a blend of both. Fundamental analysis helps identify good companies, while technical analysis helps find optimal entry and exit points, especially for shorter-term trading.
What is SEBI’s role in Indian stock market analysis?
SEBI (Securities and Exchange Board of India) regulates the market, ensures fair practices, and protects investors. While it doesn’t dictate analysis methods, its regulations impact market behaviour and data transparency, which are crucial for analysis.
How frequently should I review my stock analysis?
For short-term traders, daily or intra-day reviews are common. Long-term investors might review their analysis quarterly or semi-annually, focusing on company performance and significant economic shifts.
What are the biggest risks in Indian stock market analysis?
The biggest risks include over-reliance on a single analysis method, ignoring macroeconomic factors, emotional decision-making, insufficient risk management, and acting on unverified information or tips.
Key Takeaways
- A robust analysis of the Indian stock market integrates both technical and fundamental approaches.
- Understanding benchmark indices like Nifty 50 and Sensex provides a broad market perspective.
- Economic data, sectoral performance, and market sentiment are critical factors to monitor.
- Effective risk management, including stop-losses and position sizing, is non-negotiable.
- Leveraging technology and reliable data sources is essential for modern-day trading and investing.
- Continuous learning and adaptation to market dynamics are key to long-term success.
- Discipline and adherence to a well-defined trading plan are crucial for navigating market volatility.
Investing in the stock market involves inherent risks. Consult with a qualified financial advisor before making any investment decisions.





 Finovatives