TL;DR: Analyzing the Indian stock market like a pro involves a dual approach: mastering technical analysis for timing and price action, and fundamental analysis for valuing companies, all while staying informed about macroeconomic factors and regulatory changes from SEBI.
Key Stats at a Glance:
- Nifty 50 Index: Represents the weighted average of 50 largest Indian companies listed on NSE.
- BSE Sensex: Comprises 30 well-established, financially sound companies listed on BSE.
- NSE trading turnover: Often exceeds ₹1 lakh crore daily across various segments.
- SEBI mandates strict compliance for listed companies, enhancing investor confidence.
- AMFI data shows significant growth in mutual fund SIPs, indicating rising retail participation.
What is Stock Market Analysis?
Stock market analysis is the process of evaluating securities and determining their future price movements, with the goal of making informed investment or trading decisions.
The Dual Pillars: Technical and Fundamental Analysis
Professional traders and investors rely on two primary methodologies to dissect the market: technical analysis and fundamental analysis. While distinct, they are often used in conjunction to build a comprehensive view.
Technical Analysis: Reading the Charts
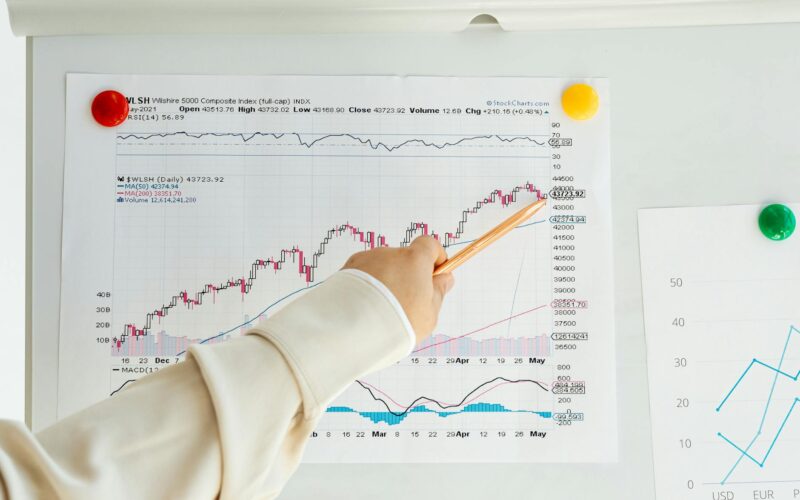
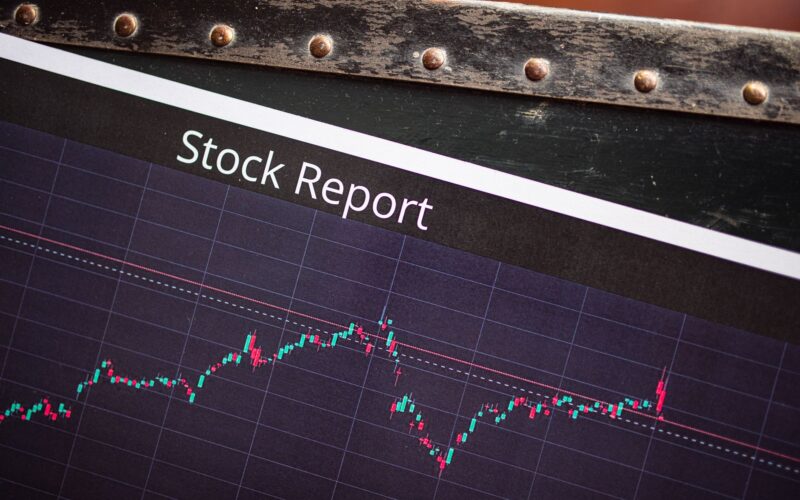
Technical analysis is a trading discipline employed to evaluate securities by analyzing statistics generated by market activity, such as past prices and volume. It operates on the premise that historical price action and trends can offer insights into future price movements.
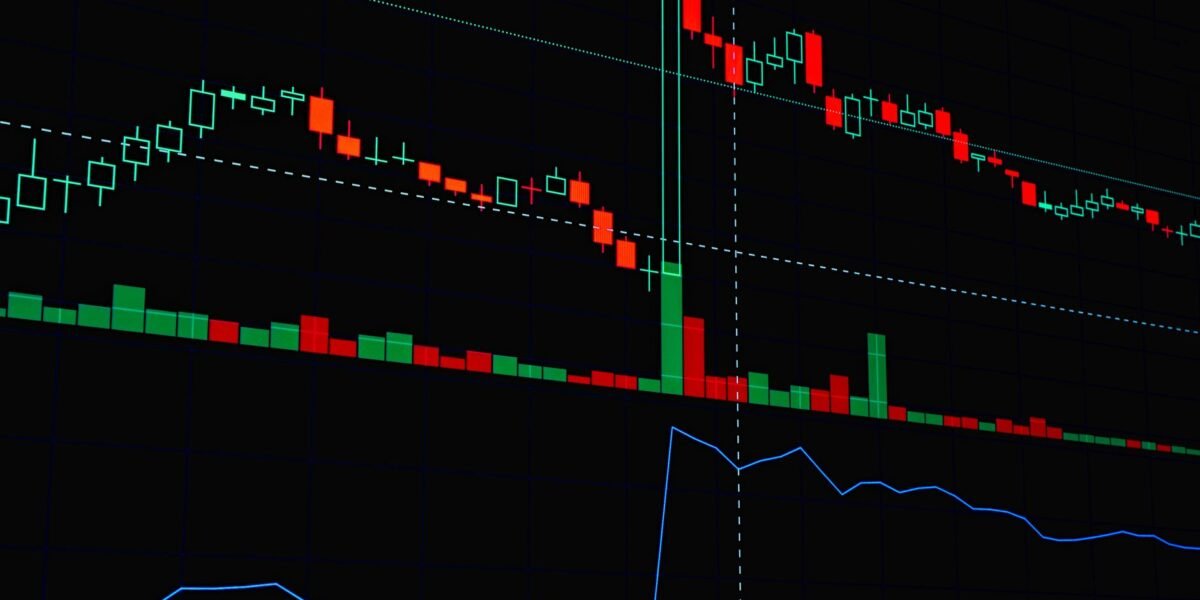
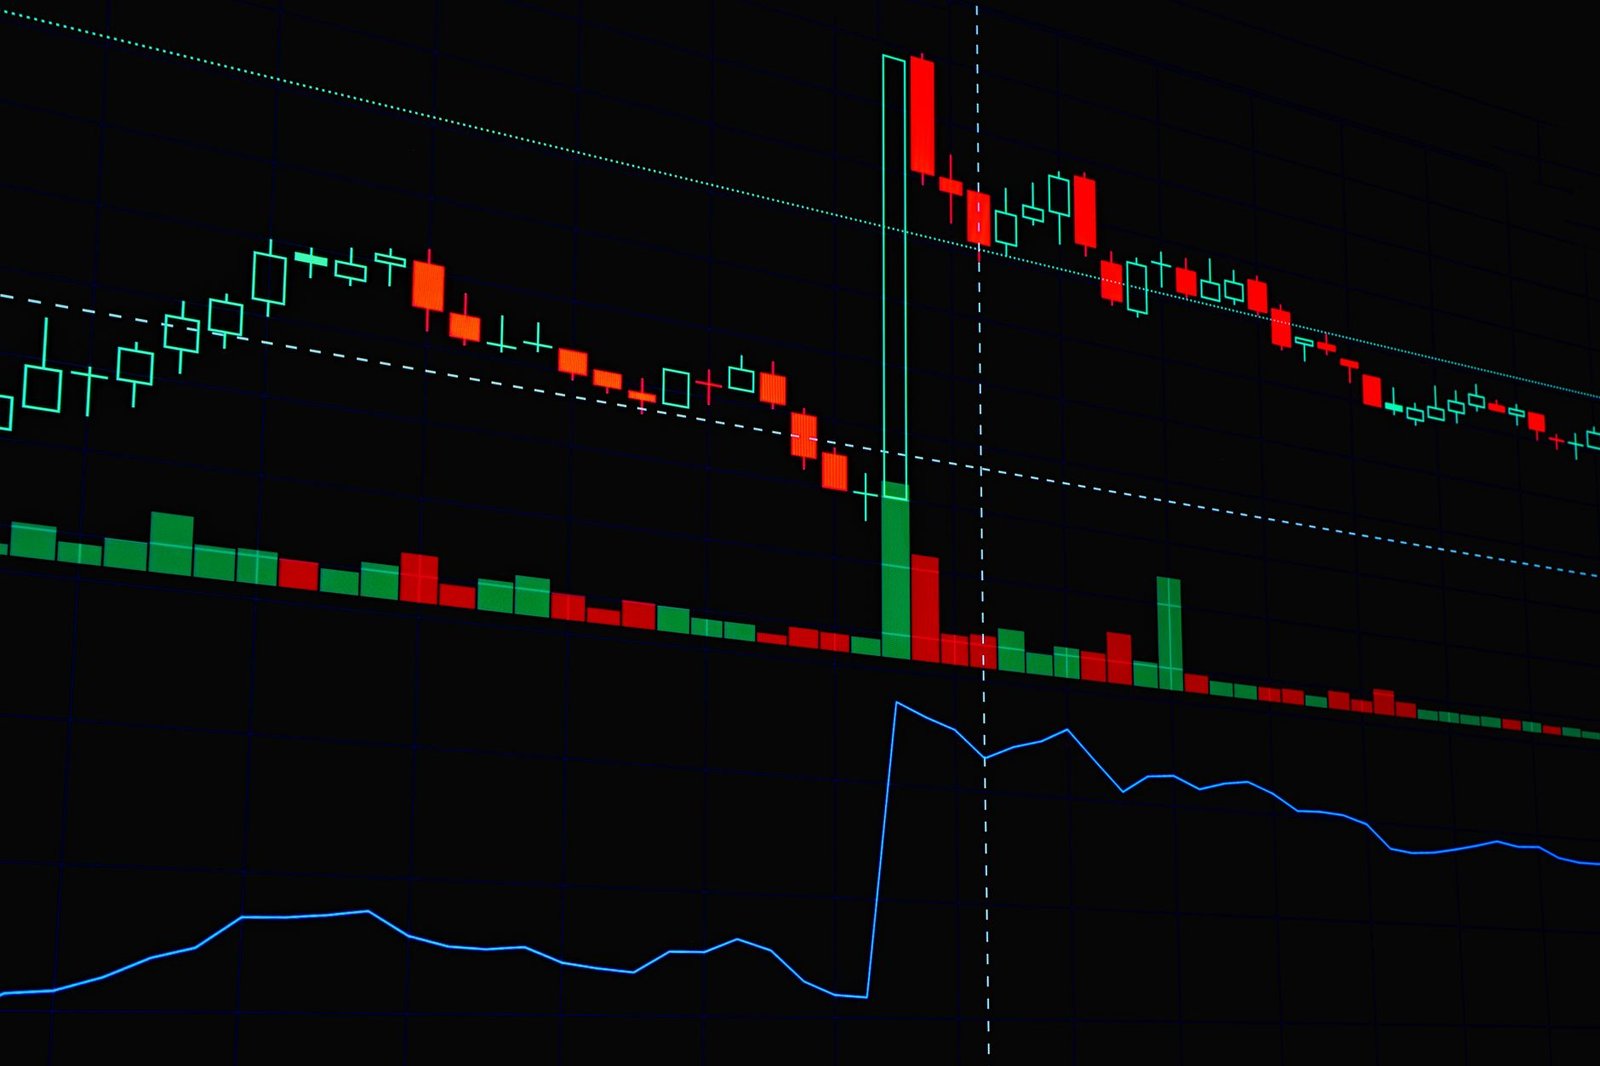
Technical analysts use charts and various indicators to identify patterns and predict where a stock or index might head next. Key tools include chart patterns (like Head and Shoulders, Double Tops/Bottoms), trendlines, support and resistance levels, and indicators like Moving Averages, MACD, RSI, and Bollinger Bands. For Indian markets, applying these tools to NSE and BSE data can reveal significant trading opportunities. Many sophisticated traders utilize a custom TradingView indicator to streamline this process.
Key Concepts in Technical Analysis
- Support and Resistance: Price levels where a stock tends to stop falling (support) or stop rising (resistance).
- Trendlines: Lines drawn on charts to connect a series of prices and indicate the direction of a trend.
- Volume: The number of shares traded during a specific period, often used to confirm the strength of a price move.
- Candlestick Patterns: Formations on price charts that can signal potential reversals or continuations.
Fundamental Analysis: Understanding Value
Fundamental analysis is a method of assessing the intrinsic value of a security by examining related economic, financial, and other qualitative and quantitative factors. The goal is to determine if a stock is overvalued, undervalued, or fairly valued.
For stocks listed on Indian exchanges like NSE and BSE, fundamental analysis involves digging into a company’s financial statements (Balance Sheet, Income Statement, Cash Flow Statement), management quality, competitive advantages, industry trends, and macroeconomic conditions. Key metrics include Earnings Per Share (EPS), Price-to-Earnings (P/E) ratio, Debt-to-Equity ratio, Return on Equity (ROE), and revenue growth. Understanding these numbers helps identify companies with strong long-term potential.

Core Components of Fundamental Analysis
- Financial Statements: Analyzing the health and performance of a company through its official reports.
- Economic Moats: Identifying sustainable competitive advantages that protect a company’s profits.
- Management Assessment: Evaluating the competence and integrity of the company’s leadership.
- Industry Analysis: Understanding the growth prospects and competitive landscape of the sector the company operates in.
How Does the Indian Stock Market Work?
The Indian stock market operates through two major exchanges, the National Stock Exchange (NSE) and the Bombay Stock Exchange (BSE), facilitating the buying and selling of shares of publicly listed companies under the regulatory framework of SEBI.
Navigating the Indian Market Landscape
Understanding the structure and key players in the Indian stock market is crucial for effective analysis. The Securities and Exchange Board of India (SEBI) plays a pivotal role in regulating the market, ensuring fair practices, and protecting investors.
- Exchanges: NSE and BSE are the primary platforms where shares are traded.
- Indices: Major indices like the Nifty 50 and BSE Sensex represent the performance of the broader market.
- Brokers: Intermediaries like Finovatives that provide platforms for traders to execute orders.
- Regulators: SEBI oversees all market activities.
- Listed Companies: Businesses that have sold shares to the public.
Macroeconomic Factors and Their Impact
Broader economic conditions significantly influence stock market performance in India. Traders must monitor key macroeconomic indicators such as GDP growth, inflation rates (CPI, WPI), interest rate decisions by the Reserve Bank of India (RBI), fiscal policy announcements by the government, and global economic trends.
For instance, a rise in inflation might prompt the RBI to increase interest rates, making borrowing more expensive and potentially slowing down economic growth, which can negatively impact stock prices. Conversely, government initiatives promoting manufacturing or infrastructure development can boost specific sectors.

Key Macroeconomic Indicators to Watch
- Gross Domestic Product (GDP) growth rate.
- Inflation figures (Consumer Price Index – CPI, Wholesale Price Index – WPI).
- Monetary policy decisions (repo rate, reverse repo rate) by the RBI.
- Government spending and fiscal deficit.
- Global commodity prices and geopolitical events.
Leveraging Market Sentiment
Market sentiment refers to the general attitude of investors towards a particular security or the market as a whole. It can be driven by news, economic data, political events, or even social media trends.
Positive sentiment often leads to buying pressure, driving prices up, while negative sentiment can trigger sell-offs. Tools like the India VIX (Volatility Index) can help gauge market fear or complacency. Understanding sentiment helps traders anticipate short-term price movements, complementing technical and fundamental analysis. Tools like Finovatives’ Trend Traders Tool can help identify prevailing market sentiment.
Tracking Market Sentiment
- Monitor financial news and analyst reports.
- Observe the India VIX for volatility expectations.
- Analyze the flow of funds (FII/DII activity).
- Gauge public opinion and social media discussions (with caution).
How to Analyze Stocks Like a Pro
Proactively analyzing stocks involves a structured approach combining technical and fundamental insights with an understanding of market dynamics and risk management.
A Step-by-Step Approach to Stock Analysis
- Define Your Investment Horizon and Goals: Are you a short-term trader or a long-term investor? Your strategy will differ significantly.
- Screen for Potential Stocks: Use stock screeners (available on platforms like Finovatives, NSE, BSE) based on criteria like market capitalization, P/E ratio, dividend yield, or technical indicators.
- Conduct Fundamental Analysis: Deep dive into the company’s financial health, management, competitive position, and industry outlook. Analyze quarterly results and annual reports.
- Perform Technical Analysis: Examine price charts, volume, and relevant indicators to identify entry and exit points, support/resistance levels, and potential trends. A good TradingView indicator can be invaluable here.
- Assess Market Sentiment and Macro Factors: Consider the overall market mood, economic news, and regulatory changes that could impact your chosen stock or sector.
- Calculate Valuation: Determine the intrinsic value using methods like Discounted Cash Flow (DCF), P/E multiples, or asset-based valuation to see if the current market price is justified.
- Risk Management: Define your stop-loss levels and position sizing to protect your capital. Never invest more than you can afford to lose.
- Review and Rebalance: Periodically review your investment thesis and portfolio performance, making adjustments as needed based on new information or changing market conditions.

Essential Tools for Analysis
- Financial Portals: Websites like NSE India, BSE India, Moneycontrol, and Trading Economics for data.
- Charting Software: Platforms like TradingView offering advanced charting tools and indicators.
- Stock Screeners: Tools to filter stocks based on specific parameters.
- News Aggregators: Staying updated with financial news and analysis.
Integrating Technical and Fundamental Insights
The true edge comes from combining both analysis types. For example, fundamental analysis might identify a strong company at an attractive valuation, while technical analysis helps pinpoint an opportune moment to enter the market, perhaps after a price consolidation or a breakout confirmation.
A stock might look fundamentally sound, but if its price chart shows a strong downtrend with heavy selling volume, a technical analyst would advise caution or wait for a trend reversal signal. Conversely, a technically attractive chart pattern might be suspect if the underlying company has deteriorating fundamentals.
When to Use Which Analysis
- Fundamental Analysis is best for: Long-term investment decisions, identifying undervalued assets, and understanding a company’s true worth.
- Technical Analysis is best for: Short-to-medium term trading, timing entries and exits, and managing risk based on price action.
Risk Management: The Pro Trader’s Secret Weapon
No analysis is complete without robust risk management. Pros understand that protecting capital is paramount. This involves setting stop-loss orders, determining appropriate position sizes (e.g., not risking more than 1-2% of capital on a single trade), and diversifying their portfolios.
Even the most sophisticated analysis can be wrong. Market conditions can change rapidly due to unforeseen events (black swans). Therefore, having a plan to limit potential losses is non-negotiable. This is where tools and disciplined execution become critical.

Core Risk Management Principles
- Stop-Loss Orders: Predetermined price points at which a losing trade is automatically closed.
- Position Sizing: Calculating the amount of capital to allocate to a trade based on risk tolerance and stop-loss distance.
- Diversification: Spreading investments across different assets, sectors, and geographies to reduce unsystematic risk.
- Risk/Reward Ratio: Ensuring potential profits significantly outweigh potential losses for each trade.
Frequently Asked Questions
What is the most important factor in stock analysis?
While crucial, there isn’t one single ‘most important’ factor. A combination of strong company fundamentals, favourable market conditions, and precise technical timing, coupled with disciplined risk management, yields the best results.
How often should I analyze my stocks?
For long-term investors, quarterly review of fundamentals and annual portfolio checks might suffice. Short-term traders should analyze their positions daily or even intraday, depending on their trading strategy.
Are technical indicators reliable for the Indian market?
Yes, widely used technical indicators are generally reliable across global markets, including India. However, they work best when used in conjunction with other indicators and analysis methods, not in isolation.
What is the role of SEBI in stock market analysis?
SEBI ensures market integrity by setting rules for disclosures, trading practices, and corporate governance. Its regulations provide a framework of transparency that underpins reliable fundamental and technical analysis.
Can fundamental analysis predict short-term price movements?
Fundamental analysis is primarily focused on long-term intrinsic value and is less effective for predicting short-term price fluctuations, which are often driven by market sentiment and technical factors.
How can I start analyzing stocks with a small capital?
Begin by focusing on fundamental research using publicly available data. Utilize free charting tools and practice technical analysis on paper trading accounts before deploying limited capital. Start with well-established companies and consider systematic investment plans (SIPs) in mutual funds.
Key Takeaways
- Mastering both technical and fundamental analysis is key to professional stock market evaluation in India.
- Understanding macroeconomic factors and market sentiment adds a crucial layer to analysis.
- SEBI regulations provide a framework for fair and transparent trading on NSE and BSE.
- A structured approach, including screening, in-depth analysis, and risk management, is vital.
- Tools like TradingView indicators and Finovatives platforms can enhance your analytical capabilities.
- Risk management, including stop-losses and proper position sizing, is non-negotiable for capital preservation.
- Continuous learning and adaptation to market dynamics are essential for long-term success.
Investing in the stock market involves inherent risks. Please consult with a qualified financial advisor before making any investment decisions.




 Finovatives