TL;DR: Fibonacci retracement helps Indian traders identify potential support and resistance levels by applying key ratios (23.6%, 38.2%, 50%, 61.8%, 78.6%) derived from the Fibonacci sequence to a prior price swing, aiding in predicting future price movements.
Key Stats at a Glance:
- Nifty 50 Index: Over 20 years of historical data available for analysis.
- Indian Equity Market: Trades over ₹10,000 crore daily on average across NSE & BSE.
- Fibonacci Ratio of Golden Mean: Approximately 1.618.
- Commonly Used Retracement Levels: 38.2%, 50%, 61.8%.
- SEBI’s Role: Regulates Indian stock markets, ensuring fair trading practices.
What is Fibonacci Retracement?
Fibonacci retracement is a technical analysis tool used to identify potential support and resistance levels in financial markets by applying mathematical ratios derived from the Fibonacci sequence to a prior price move.
The Fibonacci sequence, discovered by Leonardo Fibonacci, is a series of numbers where each number is the sum of the two preceding ones (e.g., 0, 1, 1, 2, 3, 5, 8, 13, 21, 34…). While the sequence itself might seem abstract, the ratios derived from it – particularly 23.6%, 38.2%, 50%, 61.8%, and 78.6% – have shown remarkable predictive power in financial markets. Indian traders, from beginners using basic charting tools to advanced users of sophisticated TradingView indicators, leverage these levels to anticipate where a stock price might pause or reverse after a significant upward or downward move.
The core idea is that after a substantial price movement (an ‘impulse leg’), the price will often ‘retrace’ or pull back a predictable portion of that move before continuing in the original direction. These retracement levels act as potential areas where the price might find support (during an uptrend) or resistance (during a downtrend).
The Fibonacci Sequence and its Ratios
The magic lies not in the sequence itself, but in the relationships between its numbers. Dividing a number in the sequence by the number that follows it yields ratios approaching 0.618 (the Golden Ratio). Dividing a number by the number two places to its right approaches 0.382. Other key ratios are derived through similar calculations:
- 61.8% (or 0.618): Often considered the most significant level, closely related to the Golden Ratio.
- 38.2% (or 0.382): Another widely watched level.
- 50%: While not a true Fibonacci ratio, it’s included as traders often observe support or resistance at the halfway point of a prior move.
- 23.6% (or 0.236): Represents a shallower retracement.
- 78.6% (or 0.786): A less common but still relevant level, derived from the square root of 0.618.
How to Draw Fibonacci Retracement Levels
Drawing these levels on a price chart is straightforward, though it requires identifying a significant price swing. A swing is typically defined as a clear move from a low point to a high point (uptrend) or a high point to a low point (downtrend).
How to Apply Fibonacci Retracement:
- Identify a Significant Price Swing: Look for a clear, sustained move in one direction. In an uptrend, this is from a swing low to a swing high. In a downtrend, it’s from a swing high to a swing low.
- Select the Fibonacci Retracement Tool: Most charting platforms, including TradingView, offer a dedicated Fibonacci retracement tool.
- Draw the Levels:
- For an uptrend: Click on the swing low and drag the cursor to the swing high.
- For a downtrend: Click on the swing high and drag the cursor to the swing low.
- Observe the Retracement: The tool will automatically draw horizontal lines at the key Fibonacci ratios (23.6%, 38.2%, 50%, 61.8%, 78.6%) between the high and low points.
- Identify Potential Support/Resistance: Watch how the price reacts when it approaches these levels during a pullback. These zones are potential areas for the price to find support (in an uptrend) or resistance (in a downtrend).
- Confirm with Other Indicators: Fibonacci levels are most effective when used in conjunction with other technical analysis tools like moving averages, candlestick patterns, or volume analysis.
- Set Stop-Loss and Profit Targets: Use the identified Fibonacci levels to set realistic stop-loss orders below support (in an uptrend) or above resistance (in a downtrend), and to define potential profit targets.
Where Do These Levels Work Best in the Indian Market?
Fibonacci retracement levels have proven effective across various timeframes and asset classes within the Indian stock market, including equities on the NSE and BSE, commodities on the MCX, and even currency pairs in the Forex market. Their efficacy is often observed during trending markets where a clear impulse move is followed by a corrective phase.
Equities: Nifty 50 and Beyond
Major indices like the Nifty 50 and the BSE Sensex often exhibit clear Fibonacci retracements, making them valuable for index traders. Individual stocks, especially those with high liquidity and significant price trends, also respond well. For instance, a large-cap stock like Reliance Industries or HDFC Bank, after making a significant new high, might pull back to its 38.2% or 61.8% retracement level before resuming its upward journey. Conversely, during a sharp decline, these levels can act as temporary resting places before further downside.
Commodities: MCX Trading
In the MCX, commodities like Gold (GoldM, Gold Guinea), Silver, and Crude Oil often show pronounced Fibonacci retracements. The volatility in these markets can lead to sharp impulse moves, followed by predictable pullbacks that align with Fibonacci ratios, offering opportunities for commodity traders.
Forex: INR Pairs
While the Indian Rupee (INR) pairs (e.g., USD/INR, EUR/INR) are influenced by numerous macroeconomic factors, technical analysis, including Fibonacci retracements, can still provide valuable insights. These levels can help identify potential turning points, especially in shorter to medium-term trends.
Timeframes
Fibonacci levels can be applied to any timeframe, from intraday charts (15-minute, 1-hour) to daily, weekly, and even monthly charts. Shorter timeframes might offer more trading signals but can also be noisier, while longer timeframes provide more significant levels but fewer trading opportunities. Traders often use multiple timeframes to confirm signals.
Using Fibonacci Retracements with Other Indicators
While powerful on their own, Fibonacci retracement levels gain significant strength when used in conjunction with other technical analysis tools. This confluence of signals increases the probability of a successful trade. As a Finovatives user, you might explore how our advanced TradingView indicators can complement Fibonacci analysis.
Candlestick Patterns
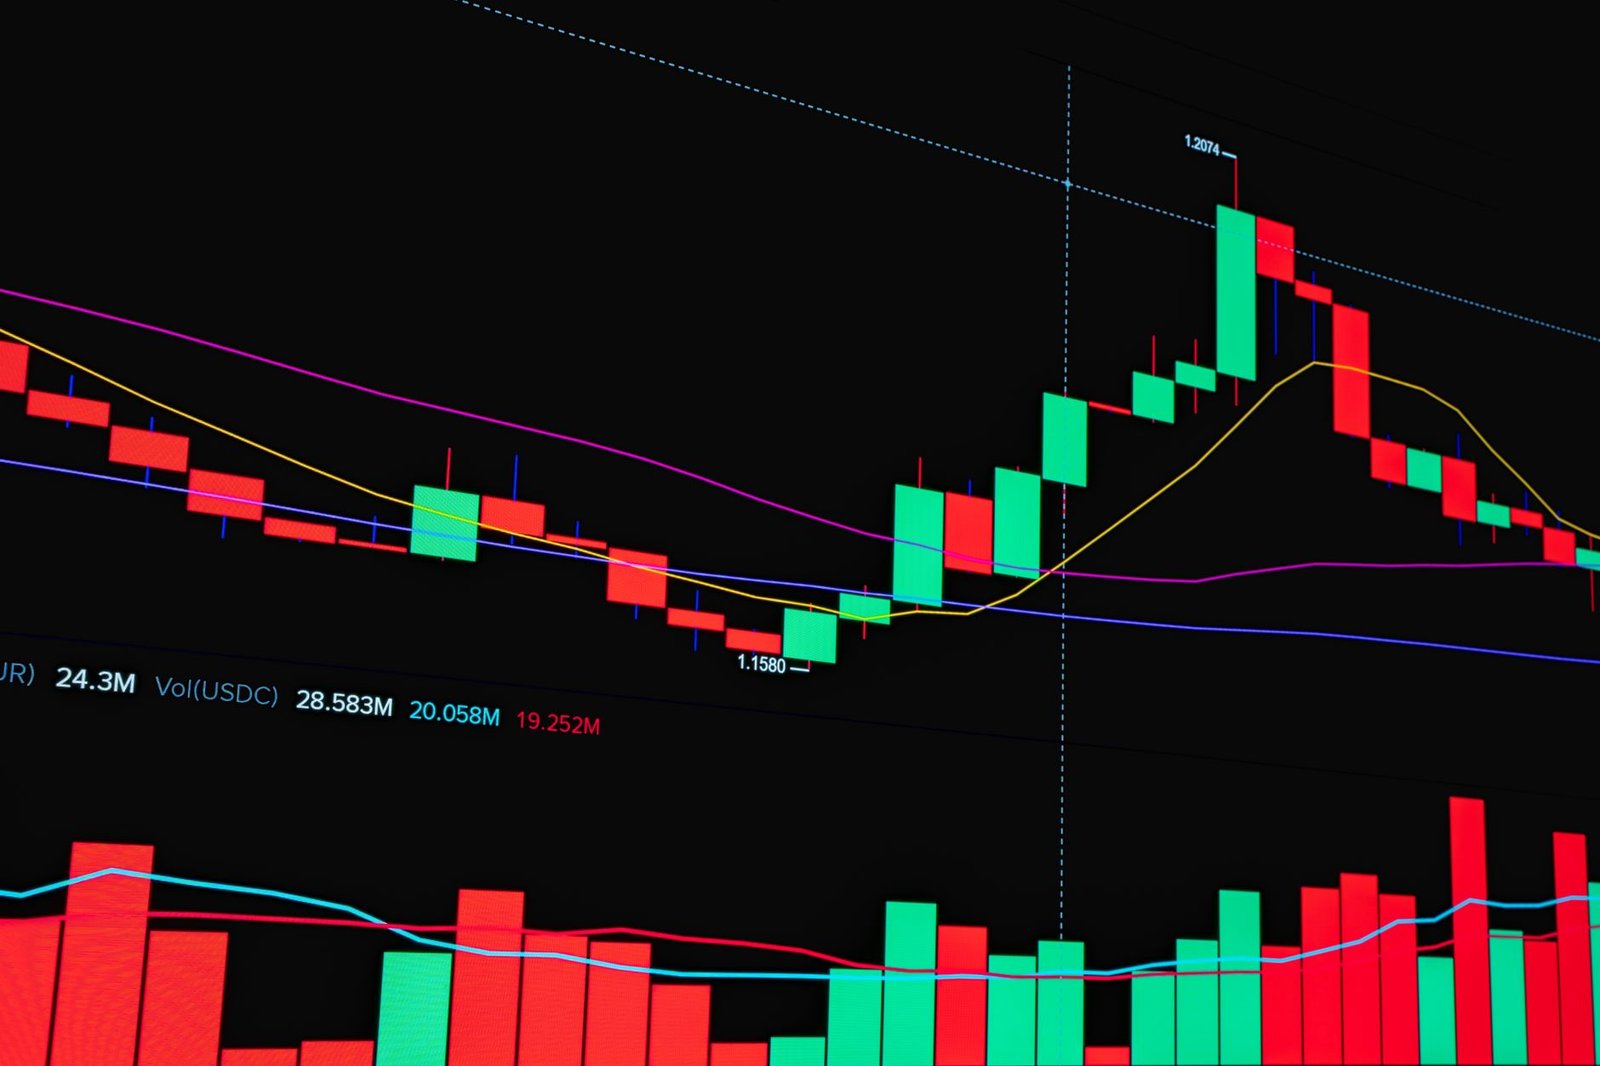
Look for bullish reversal candlestick patterns (like a hammer or bullish engulfing) forming at a Fibonacci support level during an uptrend. Conversely, bearish reversal patterns (like a shooting star or bearish engulfing) at a Fibonacci resistance level during a downtrend can signal a potential trend continuation after the retracement.
Moving Averages
When a key Fibonacci level coincides with a significant moving average (e.g., 50-day, 100-day, or 200-day Moving Average), it creates a strong confluence area. A price bounce off both a Fibonacci level and a moving average is a more reliable signal than a bounce off just one.
Volume Analysis
Increasing volume as the price approaches and bounces off a Fibonacci level can confirm its significance. High volume on a breakout from a retracement level also validates the resumption of the main trend.
Support and Resistance Zones
Fibonacci levels often align with previous price support and resistance areas. When a Fibonacci retracement level overlaps with a historically significant price level, it reinforces that area as a key turning point.
Oscillators (RSI, MACD)
While not directly plotted on the price chart, oscillators can provide leading indications. For example, if a stock is pulling back to a Fibonacci support level and an oscillator like the Relative Strength Index (RSI) is showing oversold conditions, it strengthens the case for a potential bounce.
Common Pitfalls for Indian Traders
Despite its effectiveness, Fibonacci retracement is not a foolproof system. Indian traders should be aware of common mistakes that can lead to losses.
Invalidating the Swing High/Low
The accuracy of Fibonacci retracement relies heavily on correctly identifying the true swing high and swing low. If the trader mistakenly picks an intermediate peak or trough, the calculated retracement levels will be incorrect, leading to flawed trading decisions.
Treating Levels as Exact Points
Fibonacci levels are zones, not exact price points. Markets are dynamic, and prices may slightly overshoot or undershoot a level before reversing. Traders who expect the price to halt precisely at a line often get stopped out unnecessarily.
Ignoring Market Context and Trends
Applying Fibonacci retracements in a choppy, sideways market with no clear trend is generally less effective. The tool works best in markets exhibiting clear directional momentum. Always consider the broader market trend, as indicated by SEBI’s regulatory framework and general market sentiment.
Over-reliance on a Single Tool
As mentioned, Fibonacci retracement should be part of a broader trading strategy. Relying solely on these levels without confirmation from other indicators or analysis methods significantly increases risk.
Incorrect Timeframe Selection
Using a short-term Fibonacci setup on a long-term chart, or vice versa, can lead to conflicting signals and confusion. It’s crucial to align the timeframe of the Fibonacci analysis with the trader’s intended holding period and trading style.
Frequently Asked Questions
What are the most important Fibonacci retracement levels?
The most commonly watched and significant Fibonacci retracement levels are 38.2%, 50%, and 61.8%. The 61.8% level is particularly notable as it is closely linked to the Golden Ratio.
Can Fibonacci retracements be used for intraday trading?
Yes, Fibonacci retracements can be effectively used for intraday trading by applying them to significant price swings within the trading day on shorter timeframes like 5-minute or 15-minute charts.
How do I confirm a Fibonacci retracement level?
Confirmation often comes from other technical indicators like moving averages, candlestick patterns, or volume analysis. When a Fibonacci level coincides with another indicator’s signal, it strengthens its validity.
What is the difference between Fibonacci retracement and extension?
Retracements identify potential support/resistance levels within a prior price move, while Fibonacci extensions project potential price targets beyond the prior move, typically used to set profit targets.
Is Fibonacci analysis suitable for beginners in India?
Yes, Fibonacci retracement is a relatively straightforward tool to learn and apply. Beginners can start by using it on daily charts with clear trends and confirming signals with simple moving averages.
What is the ‘Trend Traders Tool’ from Finovatives?
The ‘Trend Traders Tool’ is a proprietary indicator designed by Finovatives to help traders identify and capitalize on strong market trends, often complementing traditional analysis techniques like Fibonacci retracements.
Key Takeaways:
- Fibonacci retracement uses key ratios (23.6%, 38.2%, 50%, 61.8%, 78.6%) to identify potential support and resistance levels after a significant price move.
- The tool is derived from the Fibonacci sequence and its associated mathematical relationships.
- Accurate identification of swing highs and lows is crucial for drawing effective retracement levels.
- Confluence with other technical indicators like moving averages and candlestick patterns enhances signal reliability.
- Common pitfalls include misidentifying swings, expecting exact price points, and ignoring market context.
- Fibonacci retracement is applicable across various Indian markets (NSE, BSE, MCX) and timeframes.
Investing in the stock market involves inherent risks. Please conduct your own research and consult with a qualified financial advisor before making any investment decisions.



 Finovatives