
TL;DR: To analyze the Indian stock market like a pro, integrate fundamental analysis (company health, economic factors) with technical analysis (price patterns, indicators), monitor market sentiment, and utilize data-driven tools for informed decision-making.
Key Stats at a Glance:
- Nifty 50’s average annual return (2014-2023): ~10.5%
- BSE Sensex market capitalization: Over ₹300 lakh crore as of early 2024
- NSE offers trading in 20+ market segments
- Retail investor participation in Indian equity markets has grown by over 40% in the last 5 years
- India ranks among the top 5 global emerging markets for equity trading volume
What is Indian Stock Market Analysis?
Indian stock market analysis is the process of evaluating stocks and market trends on exchanges like the NSE (National Stock Exchange) and BSE (Bombay Stock Exchange) to make informed investment and trading decisions.
Why is Stock Market Analysis Crucial for Indian Traders?
Stock market analysis is crucial for Indian traders and investors as it helps in identifying profitable opportunities, managing risk effectively, and achieving long-term financial goals within the dynamic Indian economic landscape.
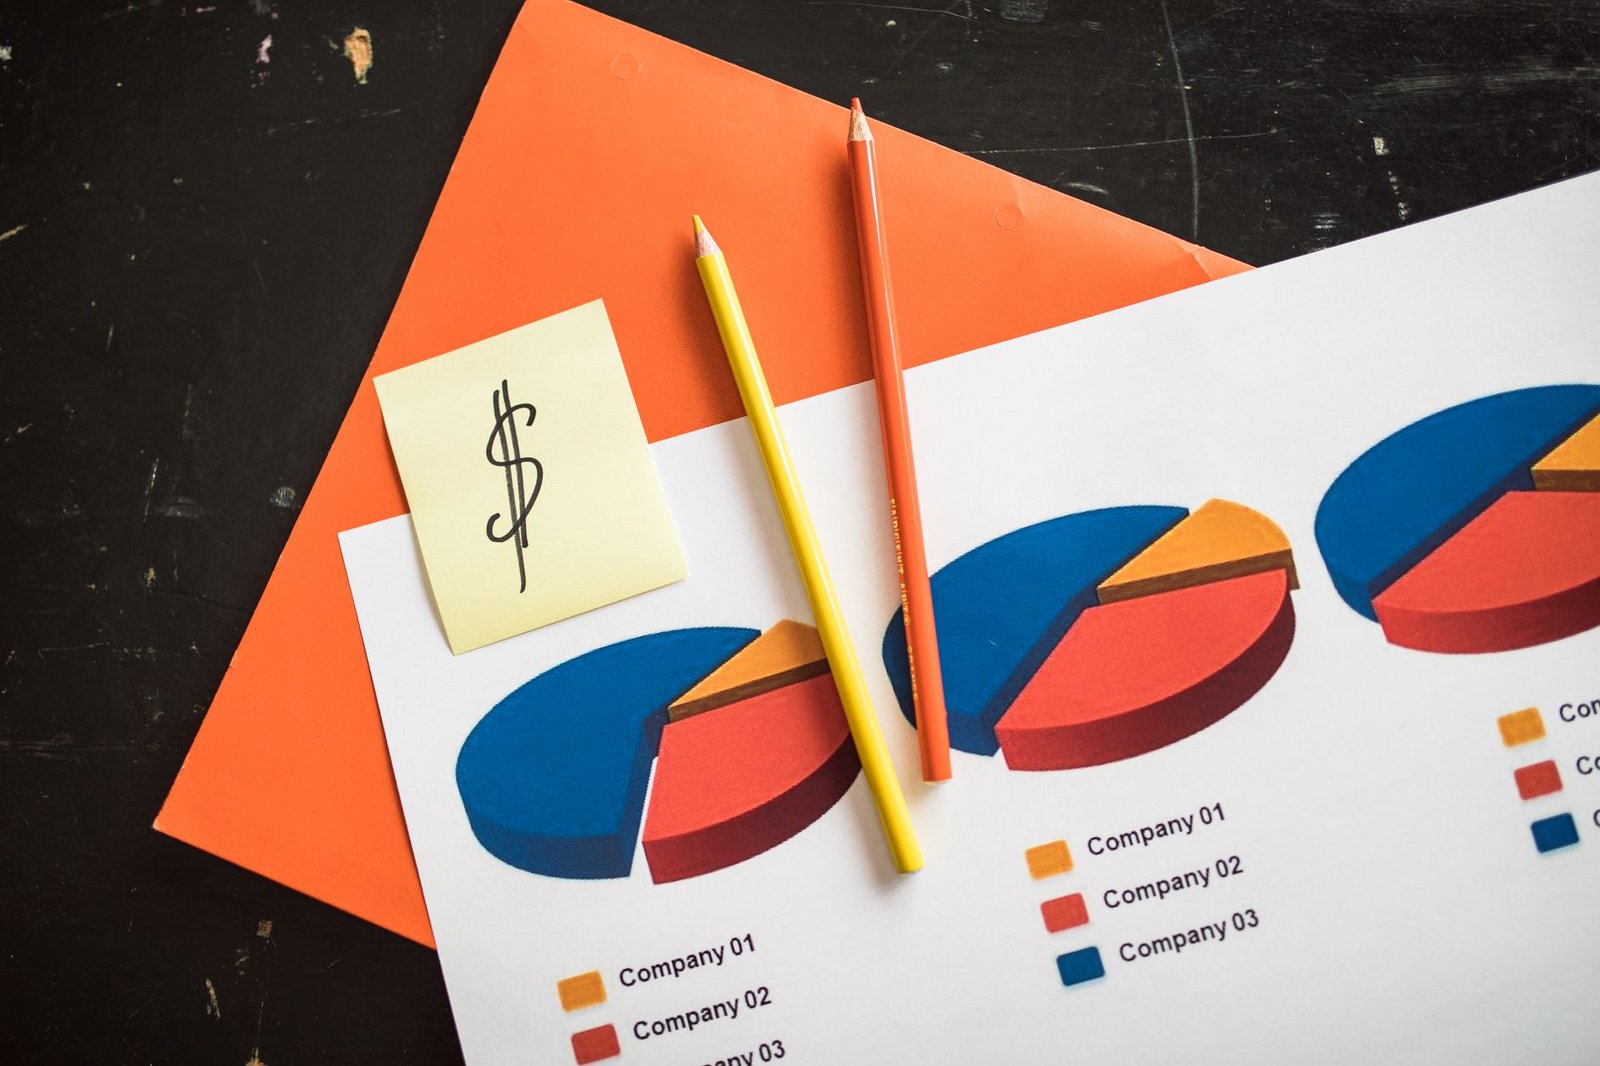
Fundamental Analysis: The Bedrock of Value
Fundamental analysis involves assessing a company’s intrinsic value by examining its financial statements, management quality, competitive landscape, and overall economic conditions. This approach helps identify fundamentally strong stocks that may be undervalued by the market. Key metrics include Earnings Per Share (EPS), Price-to-Earnings (P/E) ratio, Debt-to-Equity ratio, and Return on Equity (ROE). For Indian companies listed on NSE and BSE, understanding sector-specific dynamics and regulatory changes by SEBI is also vital.
Technical Analysis: Reading the Price Charts
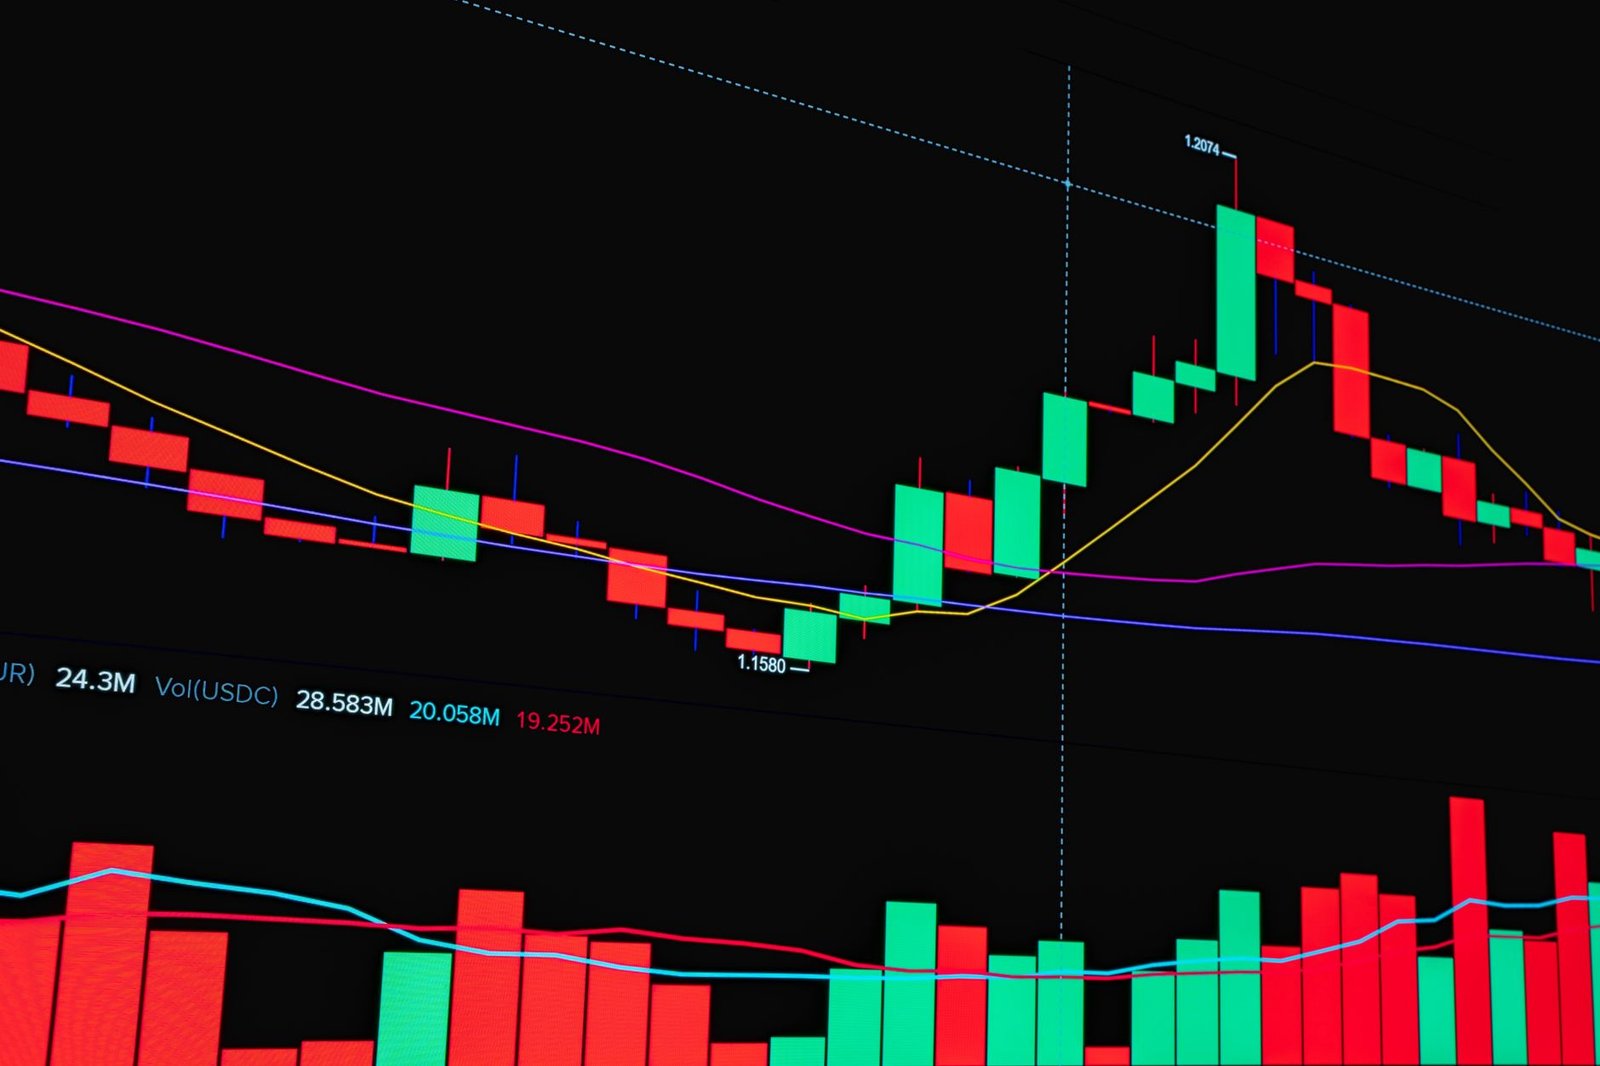
Technical analysis focuses on studying historical price and volume data to predict future price movements. It assumes that all known information is already reflected in the stock price. Traders use chart patterns (like head and shoulders, triangles), trendlines, support and resistance levels, and technical indicators (like Moving Averages, RSI, MACD) to identify entry and exit points. Advanced tools, like a custom TradingView indicator, can streamline this process.
How to Perform Fundamental Analysis
- Understand Financial Statements: Analyse the Balance Sheet, Profit & Loss Statement, and Cash Flow Statement for key financial health indicators.
- Evaluate Management Quality: Assess the experience, integrity, and track record of the company’s leadership team.
- Industry and Competitive Analysis: Research the industry outlook, market share, and competitive advantages of the company.
- Economic and Regulatory Factors: Consider macroeconomic trends (GDP growth, inflation, interest rates) and SEBI regulations impacting the sector.
- Valuation Ratios: Calculate and compare P/E, EPS, ROE, and other ratios against industry peers and historical averages.
- Future Growth Prospects: Identify potential catalysts for growth, such as new product launches, market expansion, or technological advancements.
- Read Analyst Reports: Supplement your research with reports from reputable financial analysts, but form your own conclusions.
How to Perform Technical Analysis
- Choose Your Timeframe: Decide whether you are day trading, swing trading, or investing long-term, and select charts accordingly (e.g., 5-minute, daily, weekly).
- Identify Trends: Use trendlines and moving averages to determine if the market is in an uptrend, downtrend, or sideways consolidation.
- Recognize Chart Patterns: Learn to spot common continuation and reversal patterns that can signal future price direction.
- Utilize Indicators: Apply oscillators (RSI, Stochastic) for overbought/oversold conditions and momentum indicators (MACD) for trend confirmation.
- Set Support and Resistance Levels: Pinpoint price levels where buying or selling pressure has historically caused a price reversal.
- Manage Risk: Define stop-loss levels to limit potential losses and take-profit targets to secure gains.
- Backtest Your Strategy: Test your trading approach on historical data to gauge its effectiveness before risking real capital.
What is Market Sentiment Analysis?
Market sentiment analysis gauges the overall attitude of investors towards a particular security or the market as a whole. It helps understand whether investors are feeling optimistic (bullish) or pessimistic (bearish), influencing short-term price movements.
Factors Influencing Indian Market Sentiment
Several factors influence market sentiment in India. These include corporate earnings announcements, government policy changes (e.g., budget announcements, RBI monetary policy), global economic news, geopolitical events, and even social media trends. Tracking news flow from sources like The Economic Times, Business Standard, and official statements from NSE and BSE can provide insights. For instance, positive GDP growth figures often boost overall market sentiment.
Leveraging Tools for Smarter Analysis
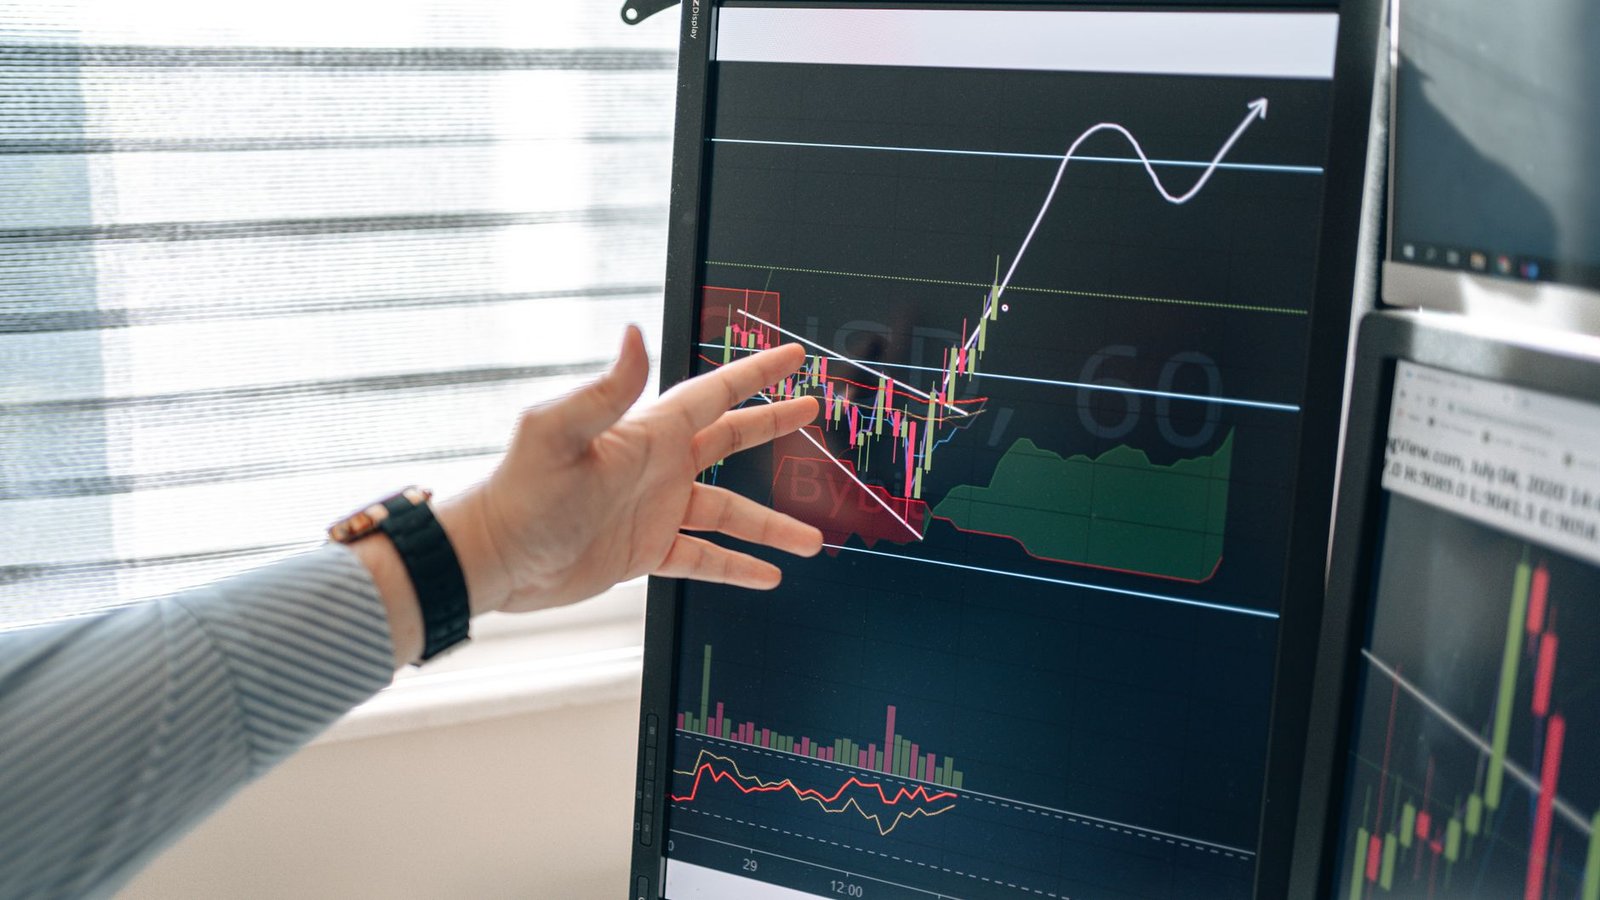
Modern traders and investors can leverage various tools to enhance their analysis. This includes advanced charting platforms, financial news aggregators, stock screeners, and quantitative analysis software. Platforms like Finovatives offer sophisticated tools designed for the Indian market, including proprietary indicators that can help identify potential trading opportunities. A free trial can give you hands-on experience with these powerful resources.
How to Develop a Trading Plan
- Define Your Goals: Clearly state your investment objectives and risk tolerance.
- Choose Your Strategy: Select a trading style (e.g., value investing, growth investing, day trading) that aligns with your personality and goals.
- Market Selection: Decide which markets or sectors you will focus on (e.g., Nifty 50 stocks, specific industry groups).
- Entry and Exit Criteria: Establish precise rules for when to enter a trade and when to exit, both for profit and loss.
- Risk Management Rules: Determine position sizing and stop-loss levels to control potential downside.
- Review and Adapt: Regularly review your trading performance and be prepared to adjust your plan based on market conditions and your results.
Frequently Asked Questions
What is the difference between fundamental and technical analysis?
Fundamental analysis looks at a company’s intrinsic value and financial health, while technical analysis studies price charts and patterns to predict future movements based on historical data.
How often should I analyze the market?
For active traders, daily analysis is common. Long-term investors might analyze weekly or monthly, with periodic deep dives into fundamentals.
Can I rely solely on technical indicators?
While technical indicators are powerful tools, they are most effective when used in conjunction with other forms of analysis and robust risk management strategies.
What role does news play in market analysis?
News can significantly impact market sentiment and trigger price movements. Staying informed about economic, political, and corporate news is essential for a comprehensive analysis.
Is it possible to predict the stock market with certainty?
No, it’s impossible to predict the stock market with absolute certainty. Analysis aims to increase the probability of making profitable decisions by understanding trends and risks.
Key Takeaways
- Combine fundamental and technical analysis for a holistic view of potential investments.
- Understand market sentiment to anticipate short-term price fluctuations.
- Utilize data-driven tools and platforms to enhance your analytical capabilities.
- Develop and strictly adhere to a well-defined trading plan.
- Continuous learning and adaptation are critical for long-term success in the Indian stock market.
- Risk management is paramount; always protect your capital.
Trading in securities is subject to market risks. Please read all related documents carefully before investing.




 Finovatives