TL;DR: Effective intraday trading strategies for the Indian stock market involve identifying short-term price trends, managing risk meticulously, and executing trades swiftly using tools like technical indicators and order flow analysis, with common approaches including scalping, momentum trading, and range trading.
Key Stats at a Glance:
- NSE average daily turnover in equity segment: ₹75,000+ Crore (as of recent reports)
- Nifty 50 volatility index (India VIX) often exceeds 20 during periods of uncertainty
- More than 2,500 companies listed on the NSE
- Successful intraday traders often aim for 1-3% daily profit targets
- Average spread in liquid large-cap stocks: 0.05% – 0.15%
What are the top intraday trading strategies for the Indian stock market?
The most effective intraday trading strategies for the Indian stock market focus on capturing small price movements within a single trading session, employing methods like scalping, momentum trading, and range trading, all underpinned by strict risk management and technical analysis.
1. Scalping: The Art of Quick Profits
Scalping is an intraday strategy focused on making numerous small profits from small price changes throughout the day. Scalpers typically hold positions for seconds to minutes, aiming to profit from bid-ask spreads or small price movements. This requires extreme focus, rapid execution, and a high win rate to be profitable, as individual trade profits are minimal. Key tools include Level 2 data, order book analysis, and very short-term moving averages (e.g., 5-minute or 15-minute charts).
How to Implement Scalping
- Identify highly liquid stocks with tight bid-ask spreads.
- Use a fast execution platform and low brokerage charges.
- Set very tight stop-losses (e.g., 0.1% – 0.2%).
- Aim for small, consistent profits on each trade.
- Focus on one or two highly liquid scrips.
- Utilize indicators like Stochastic or RSI for overbought/oversold signals.
- Enter and exit trades within minutes.
2. Momentum Trading: Riding the Trend Wave
Momentum trading involves identifying stocks that are exhibiting strong upward or downward price trends and entering trades in the direction of the momentum. Traders aim to ride the trend as long as it continues, exiting when signs of reversal appear. This strategy is best suited for trending markets, which can occur frequently on the NSE and BSE. Indicators like MACD, RSI, and Moving Average Crossovers are commonly used to confirm momentum.
How to Implement Momentum Trading
- Identify stocks with significant price movement on high volume.
- Use indicators like MACD or RSI to confirm the strength and direction of the trend.
- Enter a trade when the momentum is confirmed and the price breaks a key resistance or support level.
- Set a trailing stop-loss to protect profits as the price moves favorably.
- Exit the trade when momentum indicators show signs of weakening or divergence.
- Monitor news and events that could impact the stock’s momentum.
- Consider using a TradingView indicator for real-time momentum analysis.
3. Range Trading: Profiting from Sideways Markets
Range trading strategies are employed when a stock’s price is moving within a defined horizontal channel, bouncing between support and resistance levels. Traders buy near the support level and sell near the resistance level, expecting the price to revert to the mean within the range. This strategy requires patience and accurate identification of the support and resistance boundaries. Indicators like Bollinger Bands or the Average True Range (ATR) can help identify the range and potential breakout points.
How to Implement Range Trading
- Identify stocks trading within a clear, defined price channel on intraday charts (e.g., 15-minute or 30-minute).
- Use technical indicators like RSI or Stochastic to confirm overbought conditions near resistance and oversold conditions near support.
- Buy when the price approaches the support level and shows signs of bouncing.
- Sell (or short-sell) when the price approaches the resistance level and shows signs of reversing.
- Set stop-losses just outside the identified support or resistance levels to manage risk in case of a breakout.
- Be prepared to exit if a strong breakout occurs, as this indicates the range may have ended.
What is the importance of technical analysis in intraday trading?
Technical analysis is paramount for intraday traders as it provides the framework for identifying short-term trading opportunities based on price patterns, volume, and technical indicators, enabling informed decisions on entry, exit, and risk management within the volatile intraday environment.
4. Breakout Trading: Capitalizing on Volatility
Breakout trading aims to profit from the significant price movement that often occurs when a stock price breaks through a key support or resistance level, or a chart pattern (like a triangle or flag). Traders enter a position once the breakout is confirmed, expecting the price to continue in the direction of the breakout. This strategy can be highly profitable but also carries the risk of false breakouts.
How to Implement Breakout Trading
- Identify key support and resistance levels or chart patterns on intraday charts.
- Wait for a decisive price move that breaks through these levels, ideally accompanied by increased volume.
- Confirm the breakout using indicators like RSI or MACD, looking for confirmation signals.
- Enter a trade in the direction of the breakout.
- Place a stop-loss order just below the broken resistance (for an upside breakout) or above the broken support (for a downside breakout).
- Be aware of potential false breakouts and have a plan to exit quickly if the price reverses.
- Consider using a Trend Traders Tool to identify potential breakout setups.
5. Moving Average Crossovers
This strategy uses two or more moving averages (typically of different periods, e.g., 9-period and 21-period) plotted on an intraday chart. A buy signal is generated when a shorter-term moving average crosses above a longer-term moving average, suggesting upward momentum. Conversely, a sell signal occurs when the shorter-term average crosses below the longer-term average, indicating downward momentum. It’s a straightforward method for trend identification.
6. Support and Resistance Trading
This fundamental strategy involves identifying key price levels where a stock has historically found buying interest (support) or selling pressure (resistance). Intraday traders look to buy near support levels, anticipating a bounce, and sell or short-sell near resistance levels, expecting a pullback. Accurate identification of these levels on intraday charts is crucial.
7. Candlestick Patterns
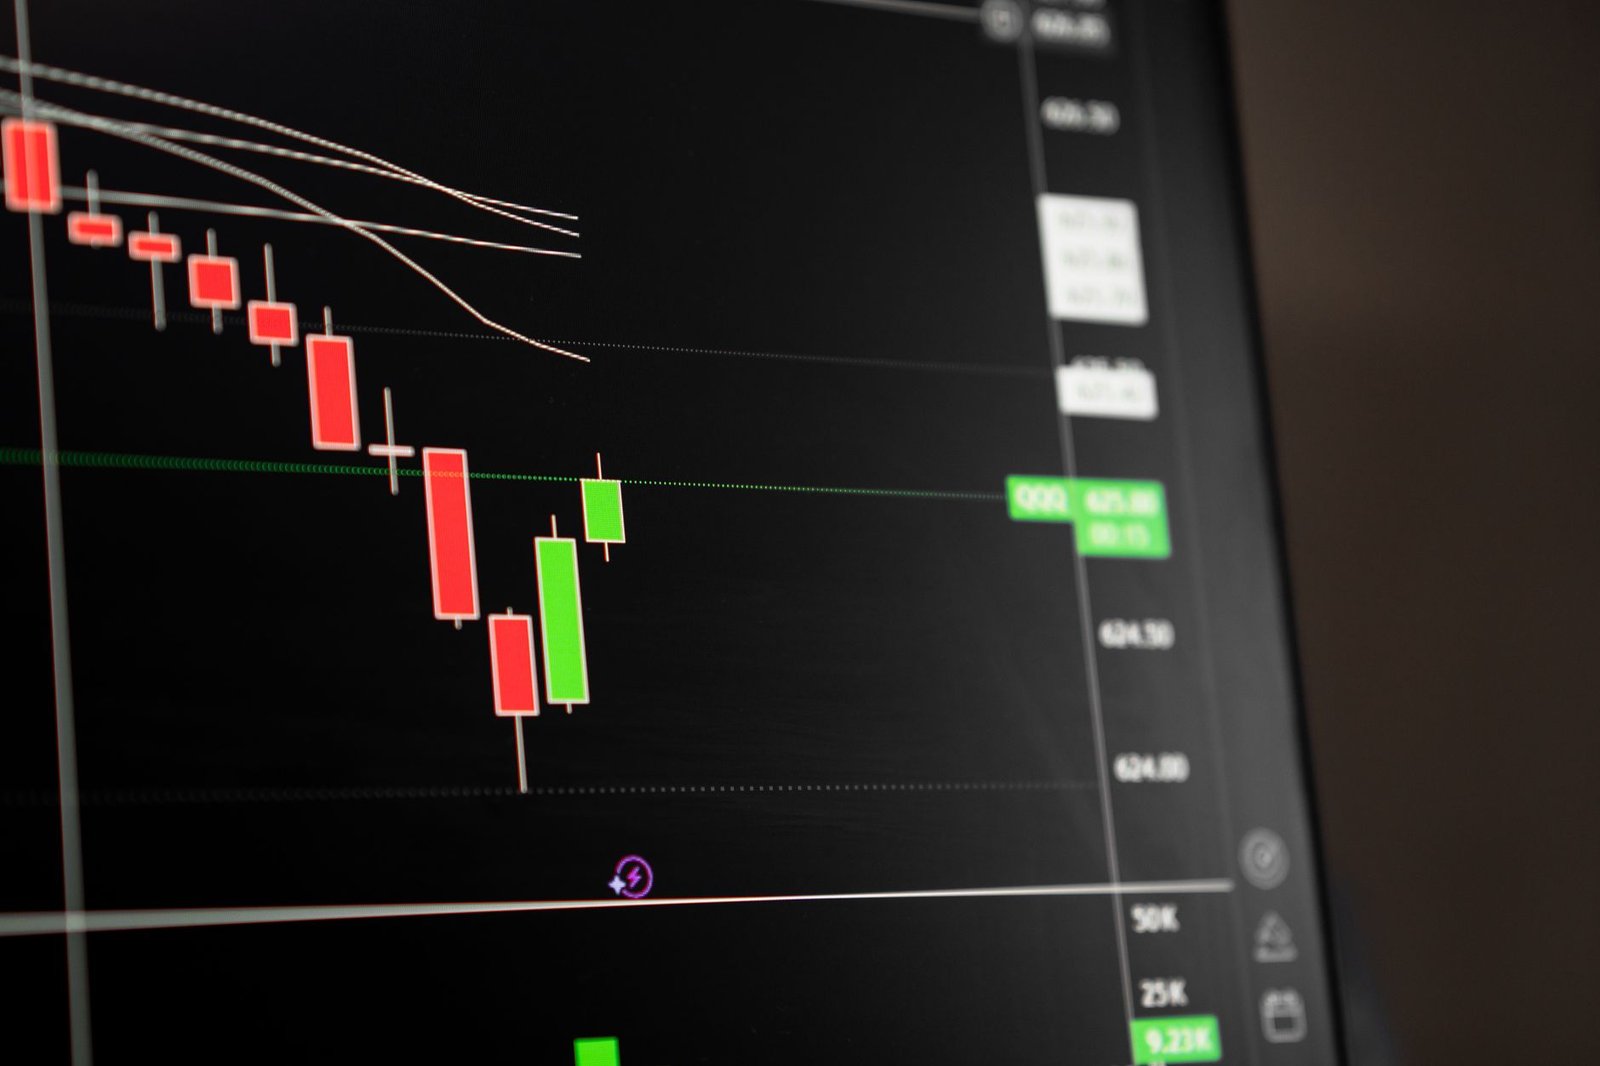
Specific candlestick formations on intraday charts (e.g., Doji, Hammer, Engulfing patterns) can signal potential reversals or continuations of price trends. Traders use these patterns in conjunction with other indicators to confirm trading signals and make entry or exit decisions.
8. Volume Analysis
Volume analysis complements other strategies by confirming the strength of price movements. A significant price move accompanied by high volume is generally considered more reliable than one with low volume, suggesting stronger conviction from market participants.
How to build a successful intraday trading plan?
Developing a successful intraday trading plan involves defining clear objectives, selecting appropriate strategies, meticulously managing risk, and maintaining discipline, while leveraging analytical tools and continuous learning.
- Define Your Goals: Set realistic daily or weekly profit targets and acceptable loss limits.
- Choose Your Strategy: Select one or two intraday strategies (e.g., momentum, breakout) that suit your risk tolerance and personality.
- Select Your Instruments: Focus on highly liquid stocks or indices like Nifty or Bank Nifty that offer sufficient intraday movement.
- Determine Entry/Exit Criteria: Clearly define the technical indicators, chart patterns, or price levels that will trigger your trades.
- Implement Strict Risk Management: Decide on your maximum risk per trade (e.g., 1% of capital) and set stop-loss orders for every trade.
- Plan Your Capital Allocation: Determine how much capital you will allocate to each trade.
- Schedule Your Trading Time: Allocate specific hours for trading, focusing on high-activity periods.
- Review and Adapt: Regularly review your trading performance, identify mistakes, and adjust your plan as needed.
Frequently Asked Questions
What is the best time for intraday trading in India?
The best time for intraday trading in India is typically between 9:15 AM and 11:00 AM, and again from 2:00 PM to 3:30 PM IST, as these periods often exhibit higher volatility and trading volumes following the market opening and before the closing bell.
How much capital is needed for intraday trading?
While it’s possible to start with a smaller amount (e.g., ₹10,000 – ₹20,000), having capital of at least ₹50,000 – ₹1,00,000 allows for better diversification, management of margin requirements, and absorbing smaller losses, especially when trading in liquid stocks or derivatives on NSE/BSE.
What are the risks involved in intraday trading?
Intraday trading carries significant risks due to high leverage, market volatility, and the potential for rapid losses if trades move against the trader. Mistakes in execution or strategy can quickly erode capital.
Which indicator is best for intraday trading?
There isn’t a single ‘best’ indicator, but popular and effective ones for intraday trading include Moving Averages, RSI, MACD, Bollinger Bands, and Volume. Often, a combination of indicators provides more reliable signals.
Can I use intraday strategies for options trading?
Yes, intraday strategies can be adapted for options trading, focusing on the fast-moving underlying asset’s price action and volatility. However, options trading involves additional complexities and risks due to time decay (theta) and implied volatility changes.
How to minimize losses in intraday trading?
Minimizing losses involves strictly adhering to a trading plan, setting tight stop-loss orders for every trade, avoiding excessive leverage, trading only high-conviction setups, and never chasing losses by deviating from the strategy.

Key Takeaways:
- Scalping, momentum, and range trading are popular intraday strategies for the Indian market.
- Technical analysis, using indicators and chart patterns, is crucial for identifying trade setups.
- Strict risk management, including stop-losses, is essential for survival and profitability.
- A well-defined trading plan and disciplined execution are non-negotiable.
- Market hours between 9:15 AM – 11:00 AM and 2:00 PM – 3:30 PM IST are often most active.
- Understanding and managing leverage is critical due to its amplification of both profits and losses.
- Continuous learning and adaptation are key to long-term success in intraday trading.
Trading in the Indian securities market is subject to market risks. Please read all the related documents carefully before investing.




 Finovatives