

TL;DR: Moving average crossover strategies involve using two or more moving averages to signal potential buy or sell opportunities in Indian stocks when they cross each other, helping traders identify trend changes.
Key Stats at a Glance:
- Nifty 50 has witnessed an average annual return of approximately 12-14% over the last decade.
- BSE Sensex comprises 30 large-cap companies, offering a benchmark for Indian equity performance.
- Over 5,000 stocks are listed across NSE and BSE combined, providing vast trading opportunities.
- A simple moving average (SMA) calculation involves summing up prices over a period and dividing by the number of periods.
- Exponential Moving Average (EMA) gives more weight to recent prices, reacting faster to market changes.
What is a Moving Average Crossover Strategy?
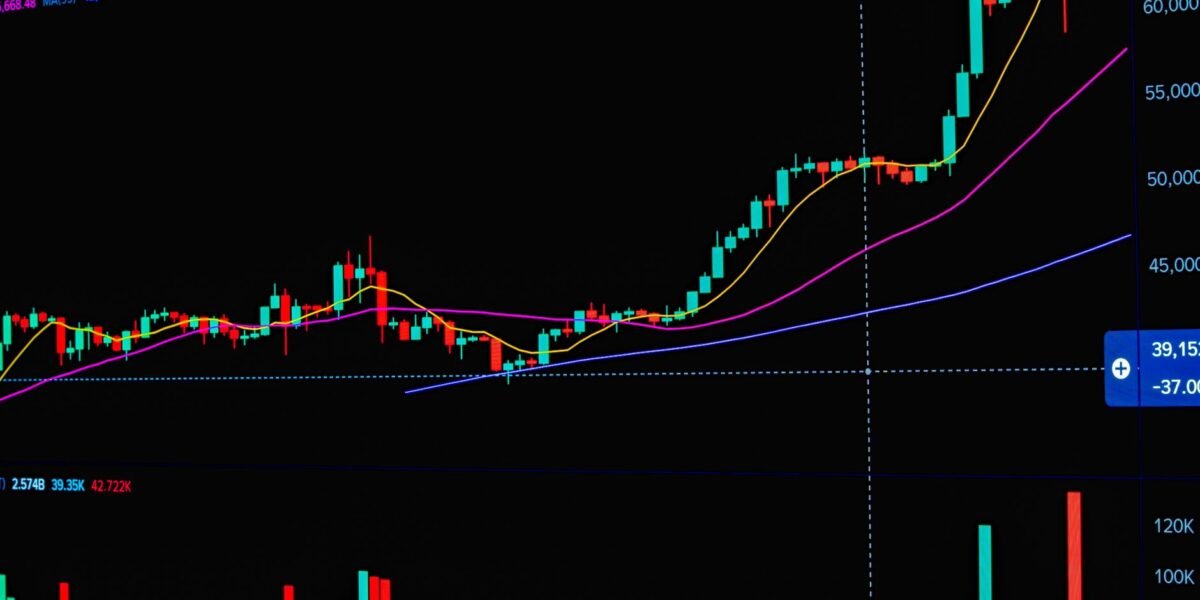
A moving average crossover strategy is a technical analysis technique used by traders to generate buy and sell signals based on the intersection of two or more moving averages with different time periods.
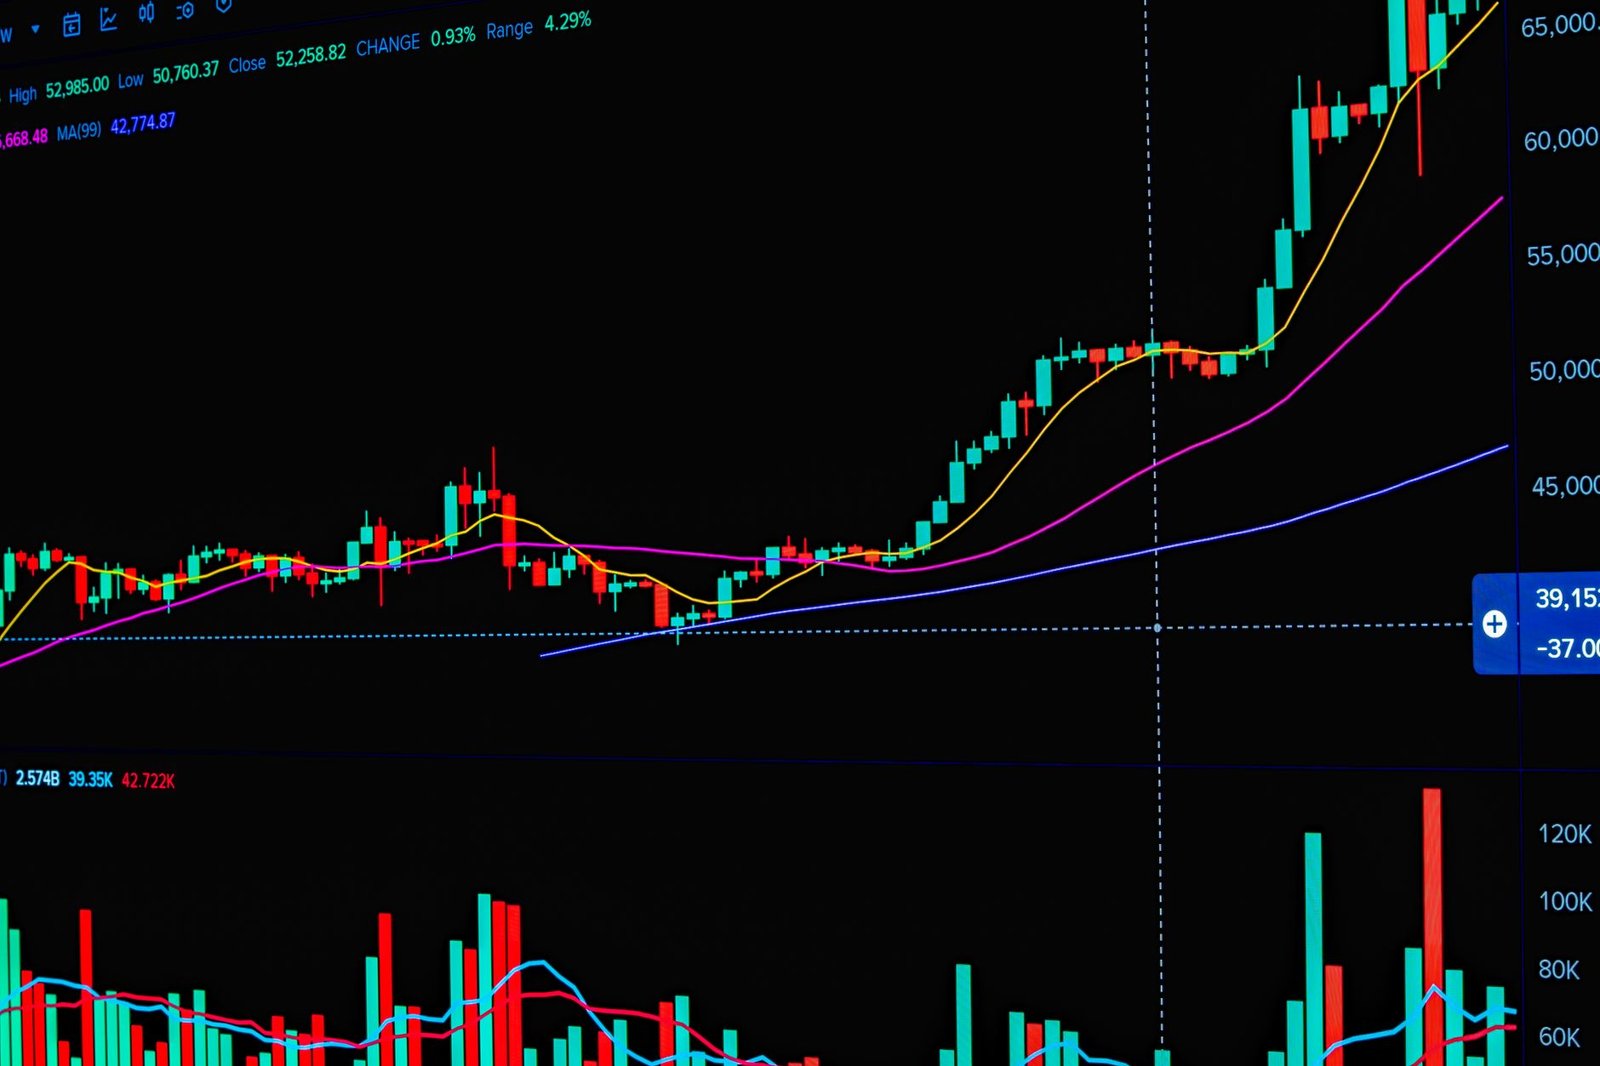
The core principle is that when a shorter-term moving average crosses above a longer-term moving average, it suggests an upward momentum or a potential buy signal. Conversely, when a shorter-term moving average crosses below a longer-term moving average, it indicates downward momentum or a potential sell signal.
These strategies are particularly popular among Indian retail traders because they are relatively easy to understand and implement, offering a clear framework for making trading decisions in the dynamic NSE and BSE markets. The effectiveness often depends on the chosen timeframes for the moving averages and the specific market conditions.
How to Implement Moving Average Crossover Strategies in Indian Stock Trading?
Implementing moving average crossover strategies involves selecting the right moving averages, identifying the crossover points, and acting upon them with a defined risk management plan.
The most common setup involves using a short-term moving average (like a 10-day or 20-day SMA/EMA) and a long-term moving average (like a 50-day or 200-day SMA/EMA). For instance, a trader might use a 20-day SMA and a 50-day SMA. A buy signal is generated when the 20-day SMA crosses above the 50-day SMA, indicating that recent price momentum is stronger than the longer-term trend. A sell signal is generated when the 20-day SMA crosses below the 50-day SMA, suggesting that the short-term trend is weakening relative to the long-term trend.
Choosing the Right Moving Averages
The choice between Simple Moving Average (SMA) and Exponential Moving Average (EMA) depends on a trader’s preference for responsiveness. EMAs react faster to price changes due to their weighting of recent data, which can be beneficial in volatile markets. SMAs provide a smoother average and can help filter out short-term noise, making them suitable for identifying longer-term trends. Many traders in India experiment with different combinations, such as 10-EMA/20-EMA for short-term trading or 50-SMA/200-SMA for longer-term trend identification.

Identifying Crossover Signals
Crossover signals are visually represented on a price chart where the lines of the two moving averages intersect. A bullish crossover occurs when the faster (shorter-term) MA line moves from below to above the slower (longer-term) MA line. A bearish crossover happens when the faster MA line moves from above to below the slower MA line. Platforms like TradingView offer readily available moving average indicators that highlight these crossovers automatically.
Setting Stop-Loss and Take-Profit Levels
Crucially, any trading strategy, including moving average crossovers, must incorporate robust risk management. Before entering a trade based on a crossover signal, traders should define their stop-loss levels. For a bullish crossover, a stop-loss might be placed just below the recent swing low or below the longer-term moving average. For a bearish crossover, it might be placed above the recent swing high or above the longer-term moving average. Similarly, take-profit targets can be set based on predefined risk-reward ratios or by anticipating further price movement until an opposite crossover signal occurs.
What are the Popular Moving Average Crossover Combinations?
Popular moving average crossover strategies often involve combinations of short, medium, and long-term averages to suit different trading styles and market conditions on NSE and BSE.
The ‘Golden Cross’ and ‘Death Cross’ are well-known examples, typically using the 50-day and 200-day moving averages. A Golden Cross, a bullish signal, occurs when the 50-day MA crosses above the 200-day MA, often interpreted as the start of a significant uptrend. A Death Cross, a bearish signal, happens when the 50-day MA crosses below the 200-day MA, suggesting a potential downtrend. These are generally used for longer-term trend analysis.
[IMAGE_PLACE_HOLDER_3]
For shorter-term trading, traders might use faster EMAs, such as a 9-period EMA crossing a 21-period EMA. This combination reacts more quickly to price fluctuations and can generate more frequent signals, though they may also produce more false signals (whipsaws) in sideways markets. The effectiveness of any combination is highly dependent on the underlying asset’s volatility and the prevailing market trend.
The 5-Day and 20-Day Crossover
This is a very short-term strategy. A bullish signal occurs when the 5-day MA crosses above the 20-day MA, and a bearish signal occurs when the 5-day MA crosses below the 20-day MA. This is best suited for very active traders or those looking to capture quick price movements, often requiring constant market monitoring.
The 20-Day and 50-Day Crossover
This is a popular medium-term strategy. The 20-day MA crossing above the 50-day MA generates a buy signal, while the 20-day MA crossing below the 50-day MA generates a sell signal. This combination balances responsiveness with trend confirmation and is widely used by many day traders and swing traders.
The 50-Day and 200-Day Crossover (Golden/Death Cross)
As mentioned, this is a longer-term strategy. The 50-day MA crossing above the 200-day MA (Golden Cross) is a strong bullish signal, often indicating a sustained uptrend. The 50-day MA crossing below the 200-day MA (Death Cross) is a strong bearish signal, indicating a potential sustained downtrend. This is more relevant for investors and positional traders.
How Does Market Volatility Affect Crossover Strategies?
Market volatility significantly impacts the effectiveness and reliability of moving average crossover strategies, particularly in the Indian stock market.
In trending markets (either up or down), moving average crossovers tend to perform well. The moving averages can effectively capture the direction of the trend, and crossovers provide timely entry and exit signals. For instance, during a strong bull run on the Nifty 50, a Golden Cross between the 50-day and 200-day MAs could signal a long-term upward trend, allowing investors to stay invested for significant gains.
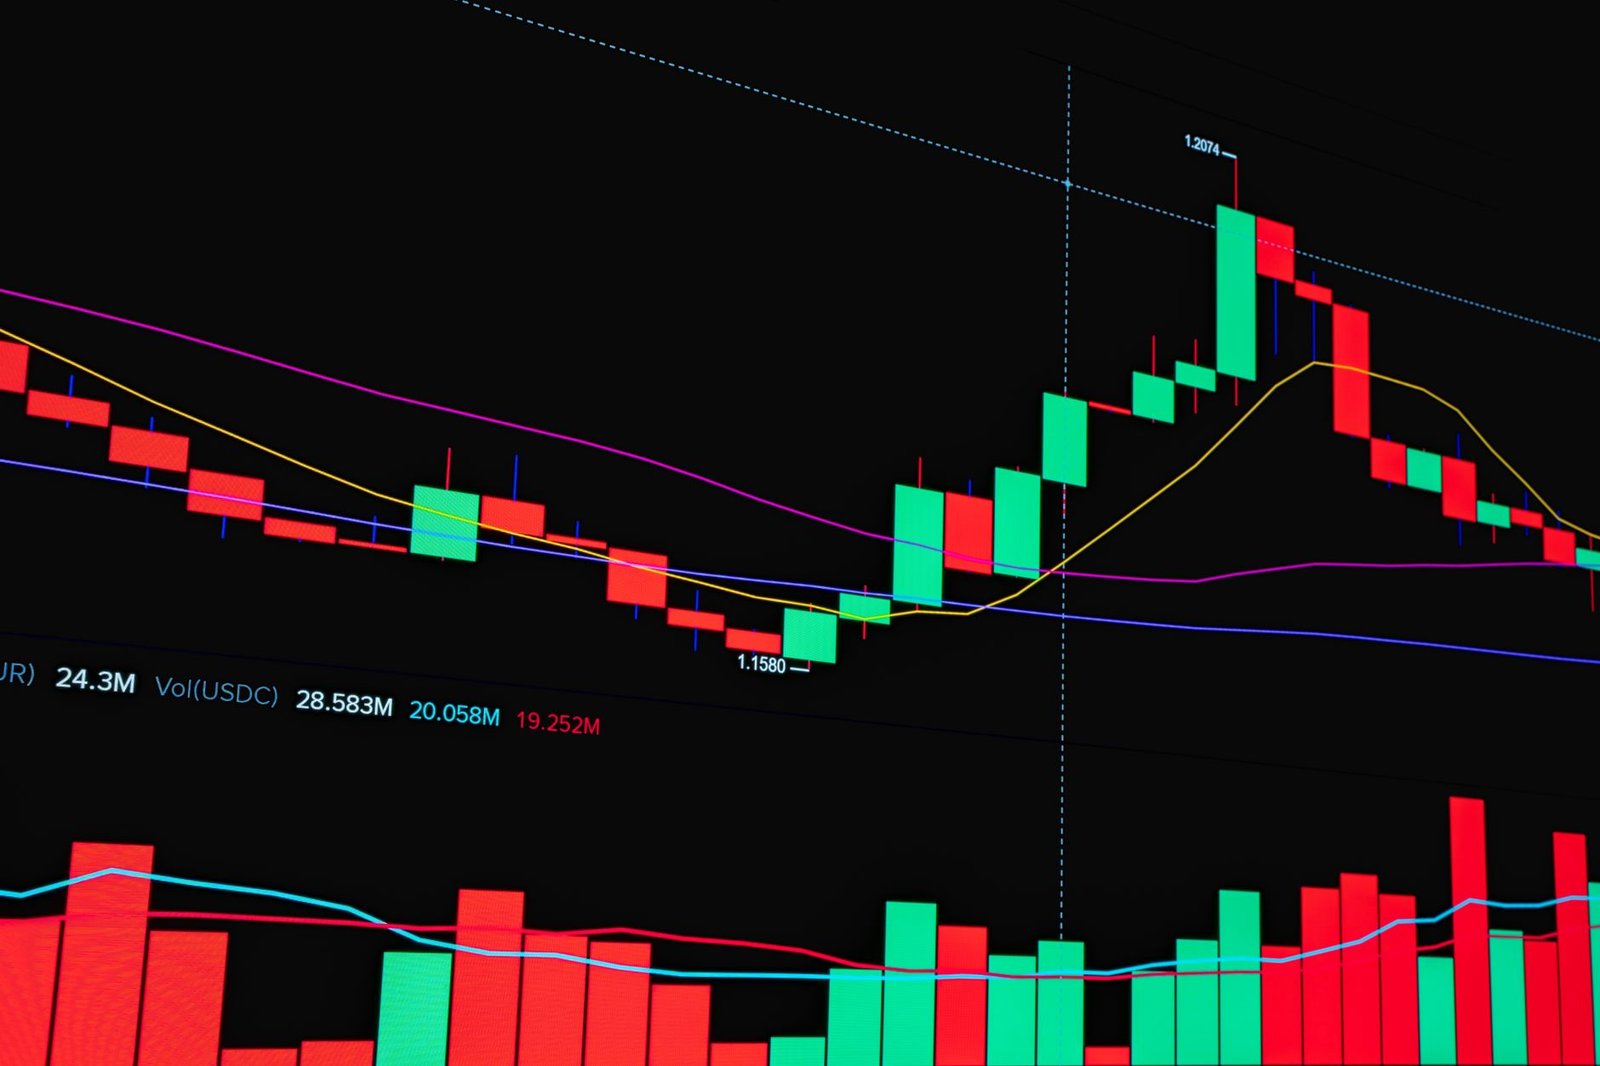
However, in highly volatile or sideways (ranging) markets, moving average crossovers can generate numerous false signals, leading to ‘whipsaws’. This occurs because the price action frequently crosses the moving averages back and forth, causing the shorter-term MA to frequently cross the longer-term MA without a sustained trend developing. This can result in traders entering and exiting positions repeatedly, incurring losses. To mitigate this, traders often combine crossover signals with other indicators like the Relative Strength Index (RSI) or MACD, or they might wait for confirmation from price action before acting on a signal.
How to Use Moving Average Crossovers with Other Indicators?
Combining moving average crossovers with other technical indicators can significantly improve the accuracy and reliability of trading signals, reducing false positives and enhancing profitability for Indian traders.
For instance, a bullish crossover signal (e.g., 20-day SMA crossing above 50-day SMA) could be confirmed by a momentum indicator like the RSI moving above 50 or showing bullish divergence. If the RSI is already in overbought territory (above 70) when the crossover occurs, it might signal a weaker buy signal or a potential reversal soon. Conversely, a bearish crossover could be confirmed if the RSI falls below 50 or shows bearish divergence.
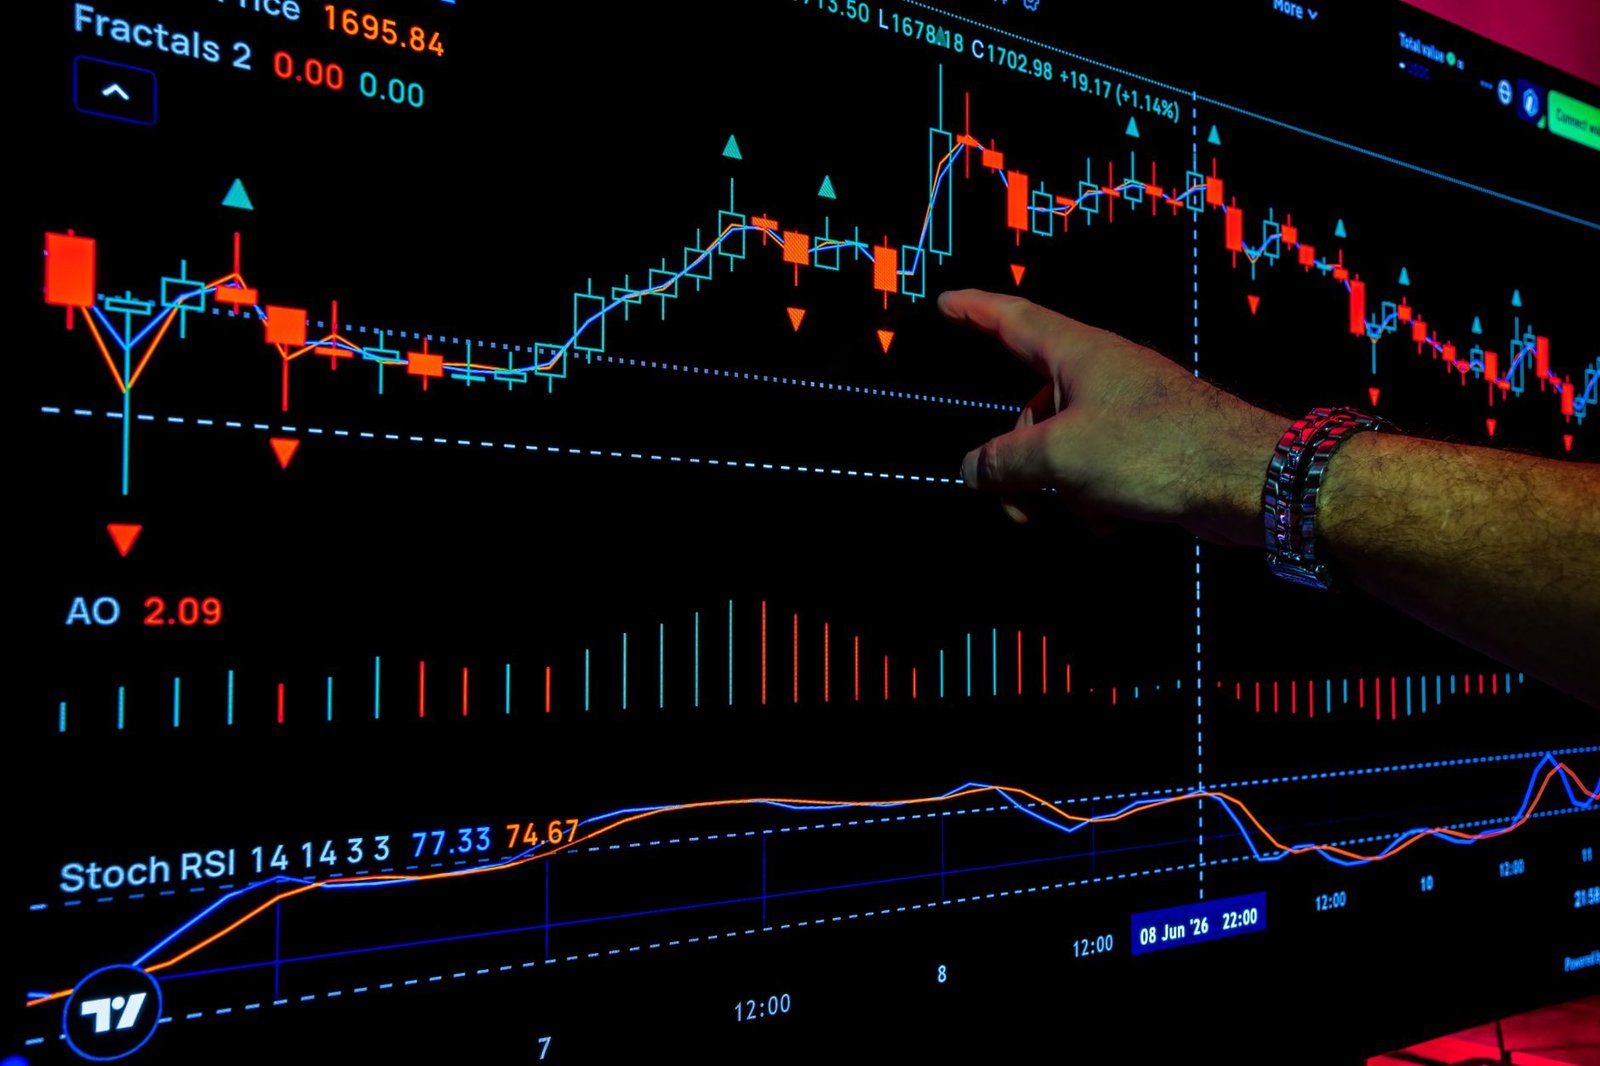
Another powerful combination is with the MACD (Moving Average Convergence Divergence). When a bullish moving average crossover occurs, traders might look for confirmation from the MACD line crossing above its signal line, and for the MACD histogram bars to turn positive. This confluence of signals provides a higher probability trade setup. Similarly, for a bearish crossover, confirmation would involve the MACD line crossing below its signal line and the histogram turning negative. The Trend Traders Tool on Finovatives.com can help identify such confluence points.
Frequently Asked Questions
What is the best moving average crossover strategy for beginners?
For beginners, the 50-day and 200-day moving average crossover (Golden Cross/Death Cross) is often recommended for understanding long-term trends. For shorter-term trading, the 20-day and 50-day crossover provides a balance between responsiveness and reliability.
Are moving average crossovers effective in all market conditions?
Moving average crossovers are most effective in trending markets. In sideways or choppy markets, they tend to generate more false signals (whipsaws). It’s crucial to combine them with other indicators or price action analysis.
Should I use SMA or EMA for crossovers?
EMAs are more responsive to recent price changes, making them suitable for shorter-term strategies or volatile markets. SMAs provide a smoother average, better for identifying longer-term trends and filtering noise. The choice depends on your trading style and the asset being traded.
How often do moving average crossovers occur?
The frequency of crossovers depends on the chosen time periods for the moving averages and the volatility of the stock or index. Shorter-term MAs (e.g., 5-day, 10-day) will cross more frequently than longer-term MAs (e.g., 50-day, 200-day).
Can moving average crossovers predict future prices?
Moving average crossovers do not predict future prices but rather indicate current trends and potential shifts based on historical price data. They are tools to help identify probable future movements, not guarantees.
What is a ‘whipsaw’ in moving average crossovers?
A whipsaw occurs when a moving average crossover signal is quickly reversed, resulting in a loss for traders who acted on the initial signal. This is common in non-trending or volatile markets.
How to Master Moving Average Crossover Strategies
- Understand the Basics: Learn the difference between Simple Moving Average (SMA) and Exponential Moving Average (EMA) and how they are calculated.
- Select Your Timeframes: Choose moving average periods that align with your trading style – shorter for day trading, longer for investing. Experiment with combinations like 10/20, 20/50, or 50/200.
- Identify Crossover Signals: Watch for the faster MA crossing above the slower MA (bullish signal) or below it (bearish signal) on your chosen charts.
- Incorporate Risk Management: Always define your stop-loss points before entering a trade based on a crossover signal to limit potential losses.
- Add Confirmation Indicators: Use other technical indicators like RSI, MACD, or support/resistance levels to validate crossover signals and reduce false positives.
- Backtest Your Strategy: Test your chosen crossover strategy on historical data for Indian stocks to understand its performance and identify optimal settings. Many platforms offer a free trial for this.
- Paper Trade: Practice your strategy in a simulated trading environment (paper trading) before risking real capital.
- Review and Adapt: Continuously monitor your strategy’s performance and be prepared to adapt your approach based on changing market conditions.
Moving average crossover strategies offer a systematic approach to trading Indian stocks. While simple, their effectiveness can be significantly enhanced through careful selection of parameters, confirmation with other indicators, and disciplined risk management. Mastering these strategies can provide a valuable edge in navigating the complexities of the NSE and BSE.
Key Takeaways:
- Moving average crossovers generate signals when short-term averages intersect with long-term averages.
- Bullish crossovers suggest potential upward price movement; bearish crossovers suggest downward movement.
- Popular combinations include 20/50-day and 50/200-day moving averages.
- Strategies are most effective in trending markets and can produce false signals in volatile or sideways markets.
- Combining crossovers with other indicators like RSI or MACD enhances signal accuracy.
- Strict risk management, including stop-losses, is essential for all crossover strategies.
- Backtesting and paper trading are crucial steps before deploying real capital.
Trading in the stock market involves inherent risks, and past performance is not indicative of future results. Investors are advised to conduct their own research and consult with a financial advisor before making any investment decisions.





 Finovatives