TL;DR: Market cycles on the BSE and NSE refer to the recurring phases of expansion, contraction, and consolidation that influence asset prices, and understanding them is crucial for adapting trading strategies to maximise profits and minimise losses.
Key Stats at a Glance:
- Nifty 50 has historically shown average annual returns ranging from 10-15% over extended periods, though this varies significantly with market cycles.
- The average duration of a bull market in India has been approximately 3-5 years, while bear markets can last 1-2 years.
- Over 7,000+ listed companies trade on BSE and NSE combined, each influenced differently by market cycles.
- Volatilty (as measured by India VIX) often spikes during bear markets and periods of uncertainty.
- Indian equity markets have witnessed multiple boom-and-bust cycles since liberalisation in 1991.
What are Market Cycles in Indian Stock Markets?
Market cycles are the recurring, though not perfectly predictable, patterns of upward and downward price movements that occur in financial markets like the BSE and NSE.
The Inherent Rhythms of the Market
Financial markets are not static; they ebb and flow. These fluctuations are often described as market cycles, representing periods of optimism and pessimism that drive investor behaviour and, consequently, asset prices. Understanding these cycles is fundamental to navigating the complexities of the Indian stock market, from the benchmark S&P BSE Sensex to the Nifty 50 and beyond.
Why Do Market Cycles Occur?
Market cycles are driven by a confluence of factors including macroeconomic indicators (GDP growth, inflation, interest rates), geopolitical events, corporate earnings, investor sentiment, and liquidity conditions. These elements collectively shape the psychological landscape of traders and investors, leading to periods of accumulation (buying), distribution (selling), and consolidation.
The Securities and Exchange Board of India (SEBI) oversees these markets, but the cycles themselves are a natural phenomenon driven by human behaviour and economic forces.
What are the Different Phases of a Market Cycle?
A typical market cycle is broadly divided into four phases: Accumulation, Markup (Uptrend/Bull Market), Distribution, and Markdown (Downtrend/Bear Market).
1. Accumulation Phase
This phase often occurs after a significant price decline (bear market). Smart money, or experienced investors, begin to quietly buy assets at lower prices, anticipating a future recovery. Prices may trade sideways with low volatility.
2. Markup Phase (Bull Market)
As more buying interest emerges, prices begin to trend upwards. This is the classic bull market, characterised by increasing investor confidence, positive news flow, and rising asset values. Momentum traders and the general investing public often enter the market during this phase.
3. Distribution Phase
This phase happens at or near the market top. Investors who bought during the accumulation and early markup phases start selling their holdings to book profits. High volatility and indecision can be seen as buying and selling pressures balance out.
4. Markdown Phase (Bear Market)
Following distribution, selling pressure overwhelms buying interest, leading to a sustained price decline. This is the bear market, often accompanied by negative news, fear, and panic selling. Prices fall until demand at lower levels eventually re-emerges, potentially starting a new accumulation phase.

How to Identify Market Cycles on the BSE and NSE?
Identifying the current phase of a market cycle requires a combination of technical analysis, fundamental analysis, and sentiment indicators.
Using Technical Indicators
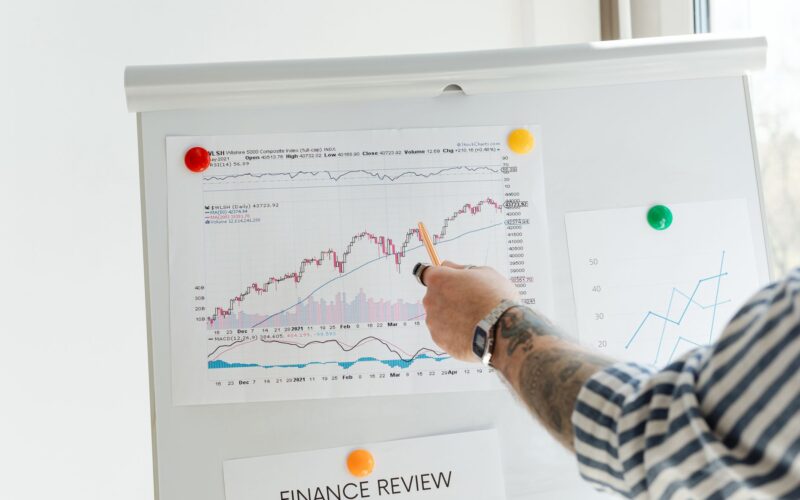
Traders often employ technical indicators to gauge the market’s direction and momentum. Moving averages (like the 50-day and 200-day moving averages) can signal trend changes. The Relative Strength Index (RSI) can indicate overbought or oversold conditions, while MACD (Moving Average Convergence Divergence) helps identify shifts in momentum.
The Role of Chart Patterns
Recognising chart patterns such as higher highs and higher lows (bullish) or lower highs and lower lows (bearish) is crucial. Support and resistance levels also provide vital clues about potential turning points.
Fundamental Analysis Insights
Monitoring macroeconomic data releases from the Reserve Bank of India (RBI), government policy announcements, and corporate earnings reports can offer insights into the underlying economic health, which drives longer-term cycle trends.
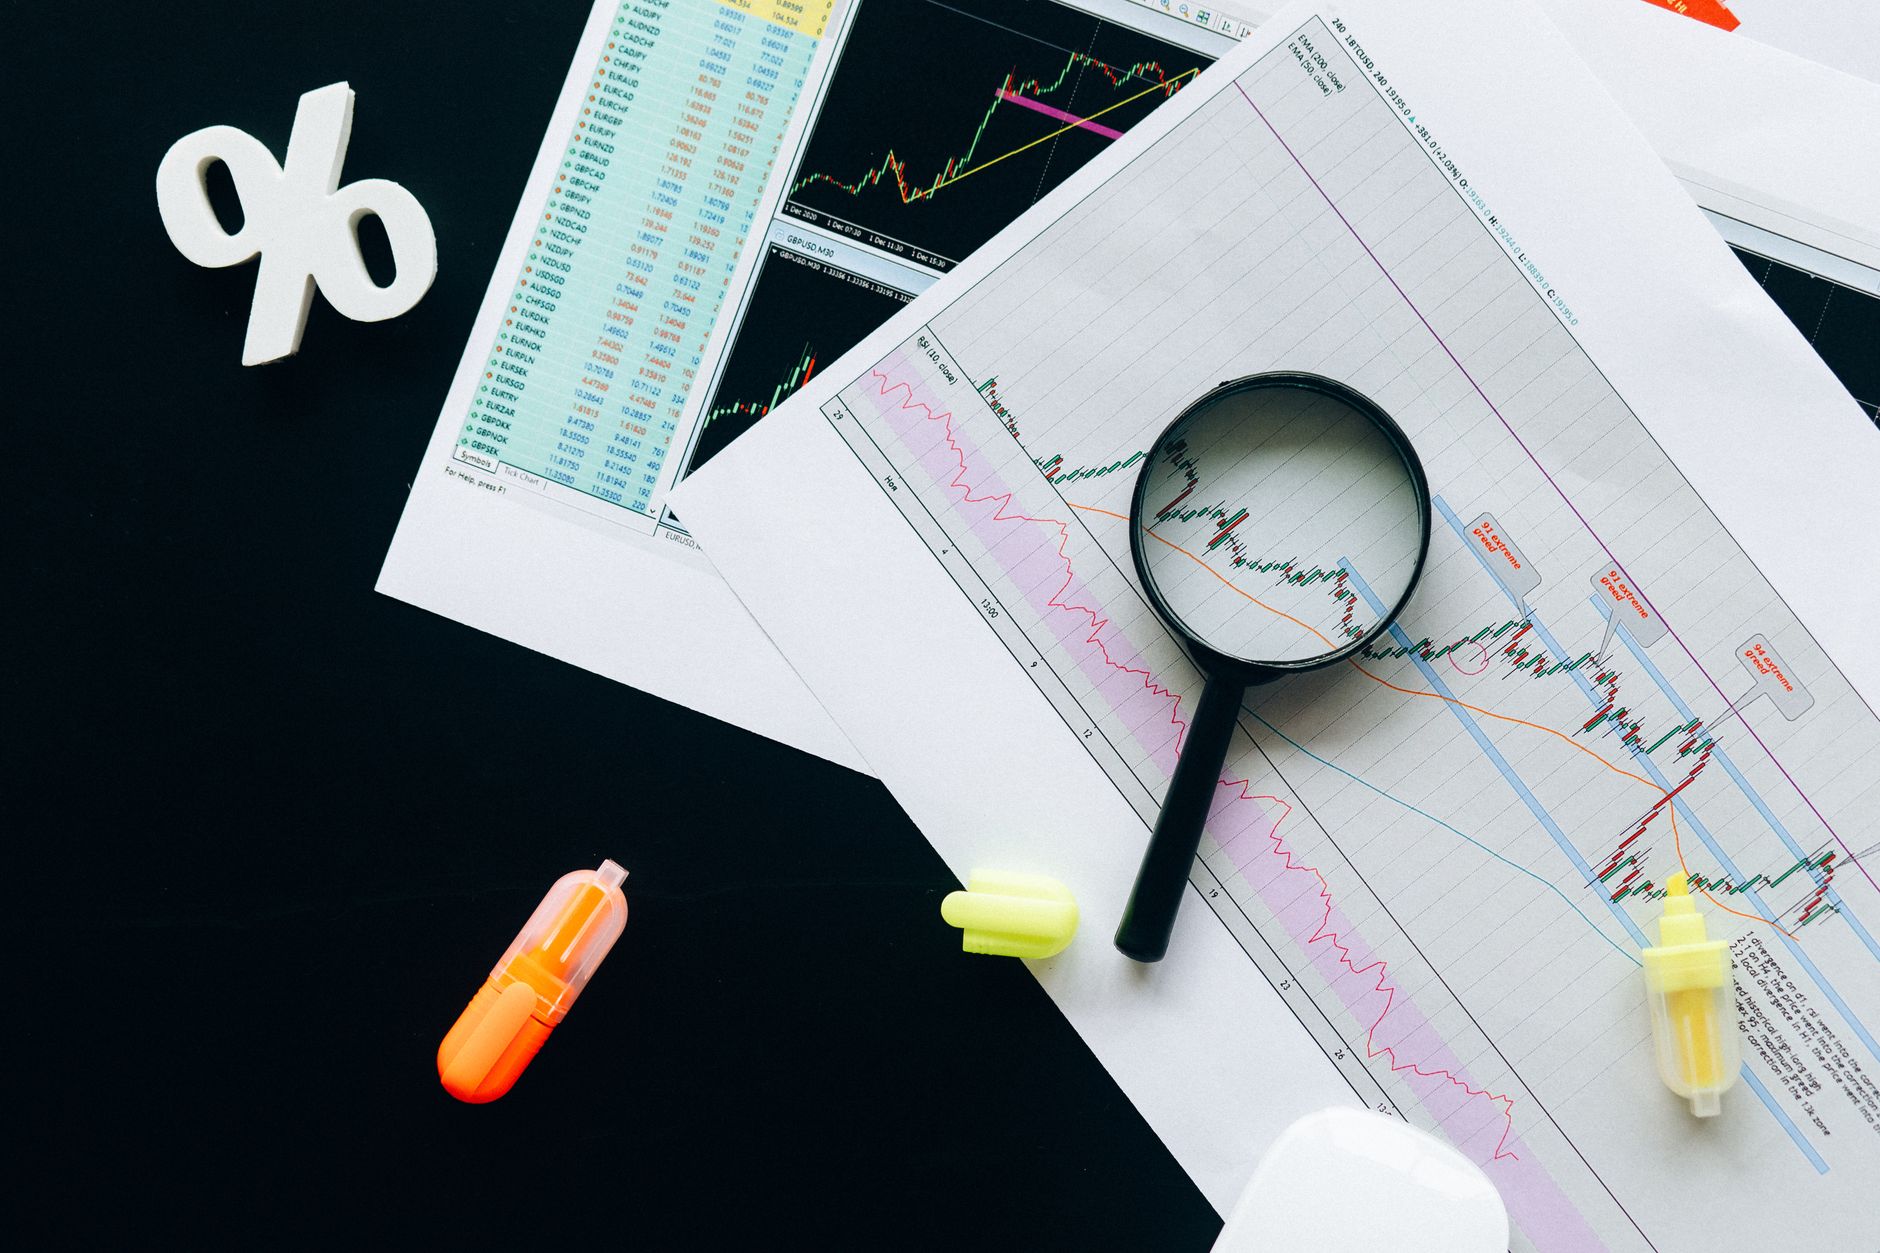
Sentiment Analysis
Gauging investor sentiment through tools like the India VIX (volatility index), put-call ratios, and news headlines can help determine the prevailing mood – whether it’s overly optimistic (potentially signalling distribution) or excessively fearful (potentially signalling accumulation).
“The most important thing in investing is not to follow the herd, especially when the herd is panicked or euphoric. Understanding market cycles helps you stay rational.”
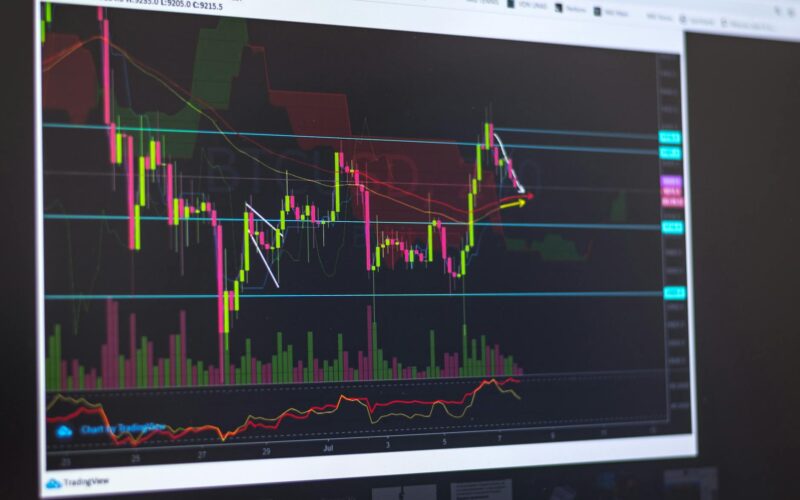
A seasoned trader might use a combination of a custom TradingView indicator and fundamental data to pinpoint entry and exit points within a cycle.
How Can Traders Profit from Market Cycles?
Profiting from market cycles involves adapting trading strategies to the prevailing phase and understanding risk management.
Strategies for Bull Markets
In bull markets, a “buy and hold” strategy or a trend-following approach is often effective. Focus on fundamentally strong stocks with good growth prospects. Consider using indicators that confirm upward momentum.
Strategies for Bear Markets
Bear markets require a more defensive approach. Short selling, investing in defensive sectors (like FMCG or pharmaceuticals), or focusing on capital preservation can be strategies. Some traders use the Trend Traders Tool to identify potential downtrends and manage risk.
Navigating Sideways Markets (Accumulation/Distribution)
Range-bound or sideways markets require patience. Traders might use range-trading strategies, focusing on buying near support and selling near resistance. Volatility can also be exploited using options strategies, but this is generally for experienced traders.
Risk Management is Key
Regardless of the market cycle phase, robust risk management is paramount. This includes setting stop-losses, position sizing appropriately, and diversifying your portfolio to mitigate sector-specific or company-specific risks.
How to Adapt Your Trading Plan to Market Cycles
A dynamic trading plan that can adapt to different market cycle phases is essential for long-term success on the NSE and BSE.
- Define Your Objective: Are you looking for capital appreciation, income, or capital preservation? Your objective will influence your strategy.
- Understand Current Market Conditions: Use technical and fundamental analysis to determine if the market is in an uptrend, downtrend, or sideways range.
- Select Appropriate Strategies: Choose trading strategies that align with the identified market phase (e.g., trend-following in bull markets, defensive in bear markets).
- Implement Risk Management: Define your risk tolerance and set strict stop-loss levels for every trade. Never risk more than a small percentage of your capital on a single trade.
- Monitor and Adjust: Continuously monitor your open positions and the overall market conditions. Be prepared to adjust your strategy as the cycle evolves.
- Avoid Emotional Decisions: Base your trading decisions on your analysis and plan, not on fear or greed, which are amplified during market cycle extremes.
- Continuous Learning: Stay updated on market dynamics, economic news, and new trading techniques. Resources like Finovatives.com offer tools and insights to aid your journey.
Frequently Asked Questions
What is the most important factor in identifying market cycles?
A combination of technical indicators (moving averages, RSI, MACD), chart patterns (support/resistance, trendlines), and macroeconomic data provides the most reliable framework for identifying market cycles.
Can market cycles be predicted with certainty?
No, market cycles cannot be predicted with absolute certainty. They are patterns influenced by numerous variables and human psychology. However, their historical tendencies can be recognised and analysed.
How do market cycles affect different asset classes?
Different asset classes react differently. Equities are generally more sensitive to economic cycles, while bonds might perform differently depending on interest rate movements. Commodities are influenced by supply/demand and economic growth.
Is it possible to time the market perfectly using cycle analysis?
Timing the market perfectly is exceptionally difficult, even for seasoned professionals. Cycle analysis aims to improve the probability of favourable trades rather than guaranteeing perfect entry and exit points.
What is the role of investor sentiment in market cycles?
Investor sentiment plays a crucial role. Euphoria often marks tops (distribution), while extreme fear signals bottoms (accumulation), driving price extremes within cycles.

How can a beginner start trading based on market cycles?
Beginners should start by studying historical cycles, paper trading to practice identifying phases, and focusing on risk management. Gradually increase capital allocation as understanding and confidence grow.
Key Takeaways:
- Market cycles (Accumulation, Markup, Distribution, Markdown) are recurring patterns on BSE and NSE driven by economic factors and investor sentiment.
- Technical indicators, chart patterns, fundamental analysis, and sentiment analysis are tools for identifying the current market phase.
- Adapting trading strategies to the specific cycle phase (bull, bear, sideways) is crucial for profitability.
- Robust risk management, including stop-losses and position sizing, is essential in all market conditions.
- A dynamic trading plan that accounts for evolving market cycles enhances long-term success.
- While perfect market timing is elusive, understanding cycles improves decision-making probability.
Investing in the stock market involves risks, and past performance is not indicative of future results. Consult with a qualified financial advisor before making investment decisions.