


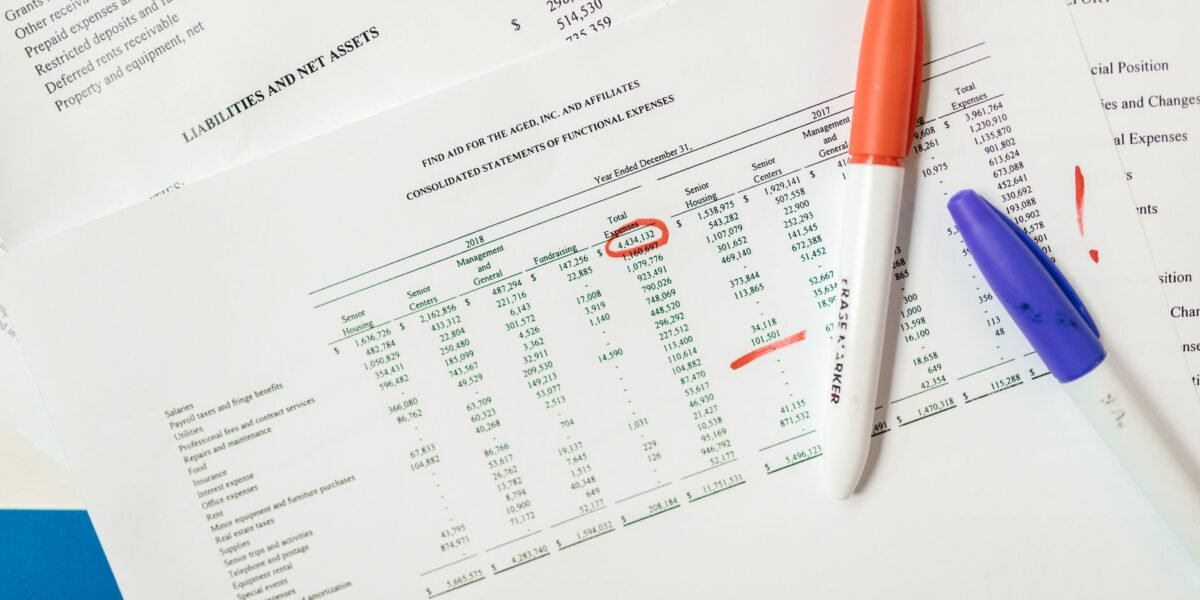
TL;DR: Reading financial statements of Indian companies involves analysing the Balance Sheet, Income Statement, and Cash Flow Statement to assess profitability, solvency, and operational efficiency, enabling informed investment decisions.
Key Stats at a Glance:
- The NSE lists over 2,000 companies, each with publicly available financial reports.
- Companies listed on BSE and NSE must file financial results quarterly and annually with SEBI.
- Net Profit Margin for Nifty 500 companies averaged 10.5% in FY23.
- Debt-to-Equity ratios vary significantly by sector, with manufacturing often showing higher leverage.
- Operating Cash Flow is a vital indicator, with a positive trend indicating healthy core business operations.
What are Financial Statements?
Financial statements are formal records of a company’s financial activities, providing a comprehensive overview of its economic health and performance over a specific period.
These reports are fundamental tools for investors, creditors, and management to understand a company’s profitability, liquidity, solvency, and operational efficiency. In India, companies listed on stock exchanges like the NSE and BSE are mandated by SEBI regulations to publish these statements regularly, typically quarterly and annually. The three primary financial statements are the Balance Sheet, the Income Statement (also known as the Profit and Loss Statement), and the Cash Flow Statement.
The Balance Sheet: A Snapshot of Financial Position
The Balance Sheet provides a snapshot of a company’s assets, liabilities, and shareholders’ equity at a specific point in time. It follows the fundamental accounting equation: Assets = Liabilities + Shareholders’ Equity.
Understanding the components of the Balance Sheet is key. Assets represent what the company owns (e.g., cash, inventory, property, plant, and equipment). These are typically divided into current assets (expected to be converted to cash within a year) and non-current assets (long-term assets). Liabilities represent what the company owes to others (e.g., loans, accounts payable). These are also divided into current liabilities (due within a year) and non-current liabilities (long-term obligations). Shareholders’ Equity represents the owners’ stake in the company, comprising share capital and retained earnings. Analysing trends in these components can reveal how a company finances its operations and manages its obligations.
The Income Statement: Measuring Profitability
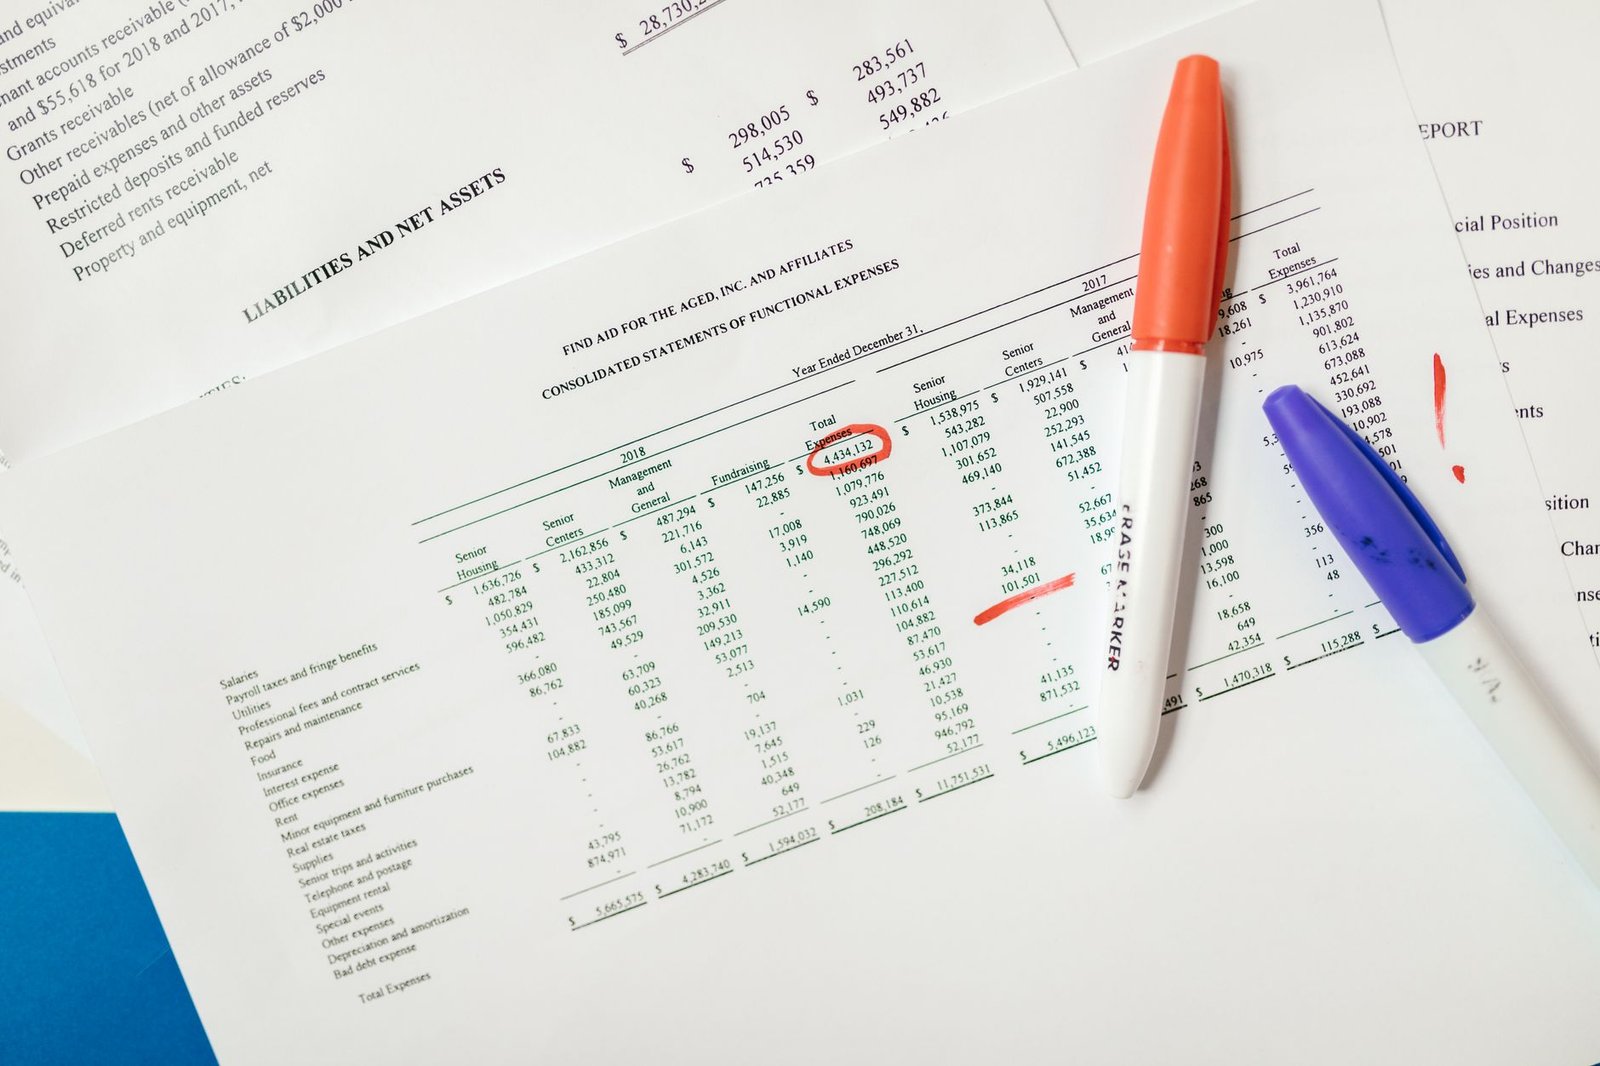
The Income Statement (or Profit and Loss Statement) details a company’s revenues, expenses, and profits over a specific period, such as a quarter or a fiscal year.
This statement is crucial for assessing a company’s ability to generate earnings. It begins with Revenue (or Sales), the total income generated from its primary business activities. From this, Cost of Goods Sold (COGS) and Operating Expenses (like salaries, rent, marketing) are deducted to arrive at Operating Income (or EBIT – Earnings Before Interest and Taxes). Interest expenses and taxes are then subtracted to reach the Net Income (or Net Profit), which is the bottom line. Investors look for consistent revenue growth and healthy profit margins, while also scrutinising expense management.
How to Read Financial Statements: A Step-by-Step Approach
Reading financial statements effectively requires a systematic approach to extract meaningful insights. By following a structured process, investors can move beyond raw numbers to understand a company’s underlying performance and potential.
Here’s how to approach reading financial statements:
- Identify the Reporting Period: Always note the period the statement covers (e.g., quarter ended March 31, 2024, or fiscal year ended March 31, 2024). Consistency in comparison periods is vital.
- Start with the Income Statement: Review revenue trends, gross profit margins, operating profit margins, and net profit margins. Look for growth drivers and expense control.
- Analyse the Balance Sheet: Examine the company’s asset base, debt levels (debt-to-equity ratio), and working capital (current assets minus current liabilities). Assess solvency and liquidity.
- Scrutinise the Cash Flow Statement: This is critical. Check cash flow from operations – a positive and growing figure is a strong sign. Analyse investing activities (capital expenditure) and financing activities (debt repayment, dividends).
- Calculate Key Ratios: Use the data from the statements to compute ratios like ROE (Return on Equity), ROCE (Return on Capital Employed), Current Ratio, and Quick Ratio. Compare these against industry averages and historical performance.
- Look for Red Flags: Pay attention to declining revenues, shrinking margins, increasing debt, negative operating cash flow, or significant one-off items.
- Read the Management Discussion and Analysis (MD&A): This section, usually part of the annual report, provides management’s perspective on the company’s performance, risks, and future outlook.
- Compare with Peers and History: Benchmarking against competitors and analysing year-over-year trends provides crucial context for evaluating the company’s performance.

The Cash Flow Statement: Tracking Cash Movements
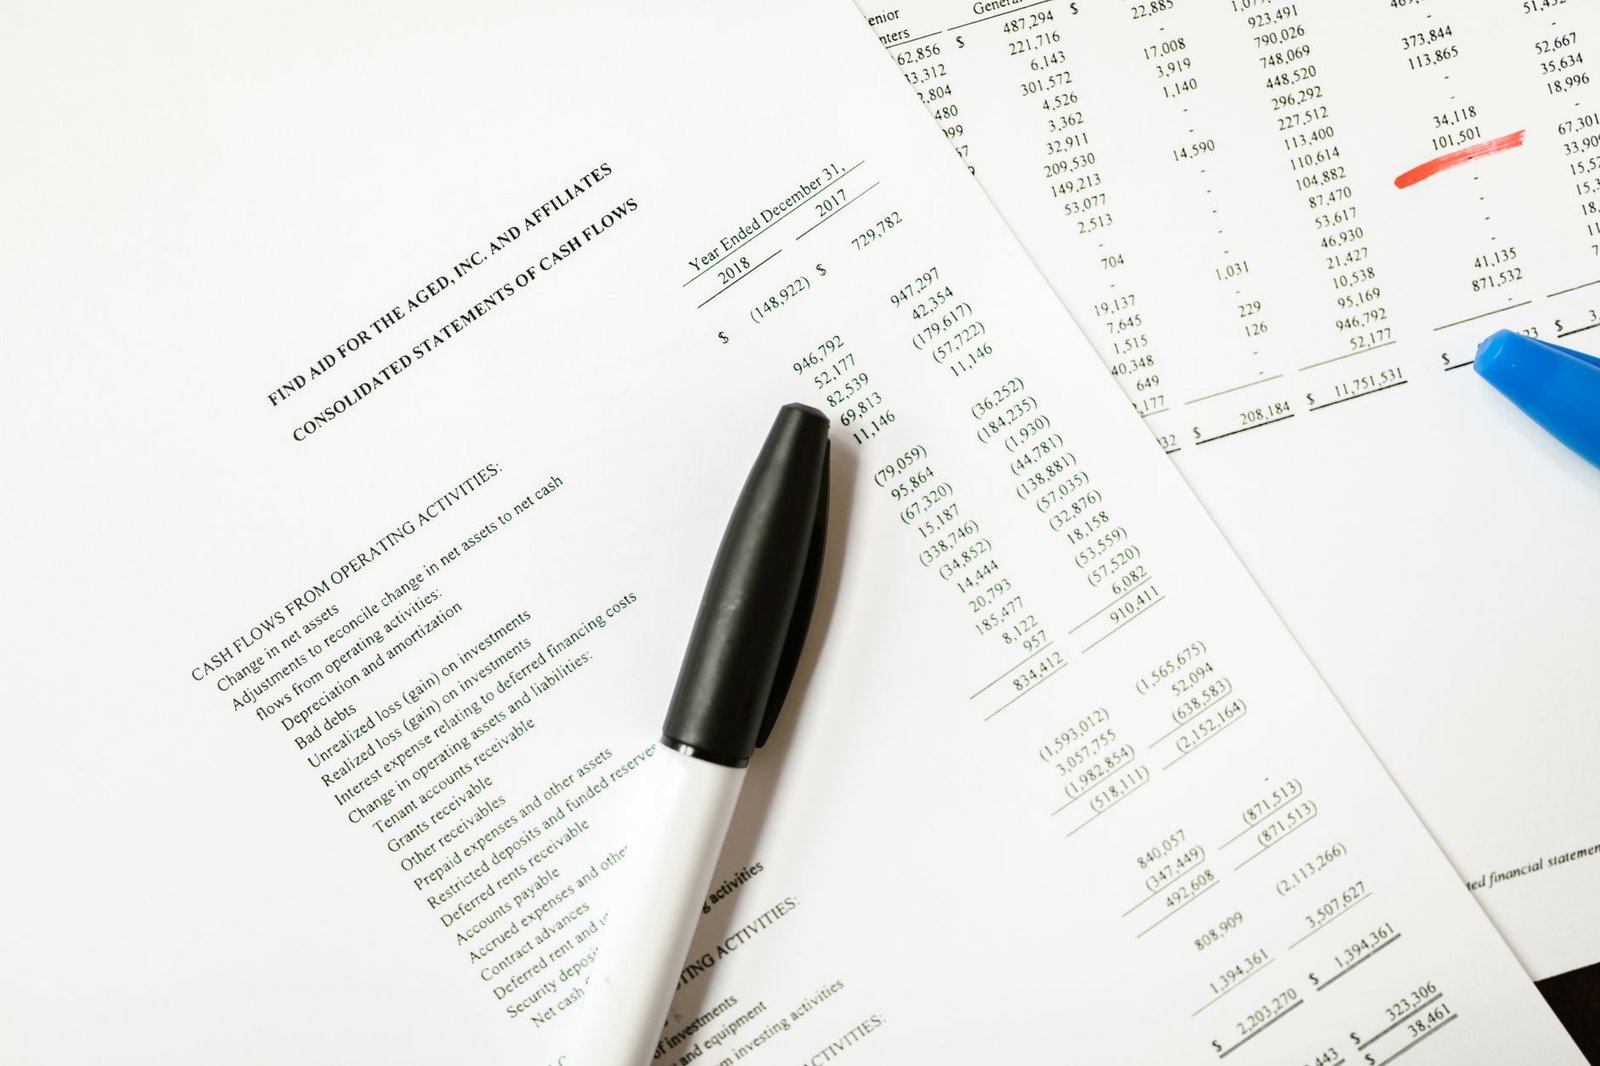
The Cash Flow Statement tracks the movement of cash into and out of a company over a period, categorising it into operating, investing, and financing activities.
This statement is vital because profit on the Income Statement doesn’t always translate directly into cash. Cash Flow from Operations shows the cash generated from the company’s core business activities. Cash Flow from Investing details cash spent on or received from long-term assets like property and equipment. Cash Flow from Financing reflects cash flows related to debt, equity, and dividends. A consistently positive cash flow from operations is a robust indicator of a healthy business. For instance, a company might show a profit but have negative operating cash flow due to aggressive inventory build-up or delayed customer payments, which is a warning sign.
Interpreting Key Financial Ratios
Financial ratios are powerful tools that allow investors to standardise financial data and make meaningful comparisons. They provide insights into a company’s performance, efficiency, and risk profile.
Several key ratios derived from these statements are essential for Indian investors. The Current Ratio (Current Assets / Current Liabilities) measures short-term liquidity. A ratio above 1 is generally preferred, indicating the company can meet its short-term obligations. The Debt-to-Equity Ratio (Total Debt / Shareholders’ Equity) assesses financial leverage; a high ratio suggests higher risk. Return on Equity (ROE) (Net Income / Shareholders’ Equity) indicates how effectively a company uses shareholder investments to generate profits. Observing the trend of these ratios over time, and comparing them with industry benchmarks provided by sources like AMFI or financial news outlets, offers a deeper understanding of a company’s financial health.
What are Common Pitfalls When Reading Financial Statements?
While financial statements offer invaluable insights, several common pitfalls can lead to misinterpretations if not carefully avoided. Being aware of these traps helps investors make more accurate assessments.
One common pitfall is focusing solely on one statement, like the Income Statement, without corroborating it with the Balance Sheet and Cash Flow Statement. For example, a company might show increasing profits, but if its debt is also rising rapidly and its cash flow from operations is weak, it could be a sign of underlying financial distress. Another mistake is neglecting to compare current data with historical trends and industry averages. A company might appear profitable, but if its growth is slowing relative to its peers or its own past performance, it warrants closer scrutiny. Understanding one-time gains or losses (e.g., from asset sales) and their impact on net income is also crucial to gauge the sustainability of earnings. Users of advanced tools like the Trend Traders Tool can often spot these anomalies more quickly.
How to Analyse Trends and Comparisons
Analysing trends and performing comparative analysis are critical for moving beyond a static view of financial data. These techniques help identify patterns, assess growth trajectories, and benchmark performance against relevant entities.
Trend analysis involves examining financial data over multiple periods (e.g., 3-5 years) to identify patterns and predict future performance. For instance, consistently increasing revenue and net profit, coupled with stable or improving margins, suggests a healthy growth trend. Conversely, declining revenues or erratic profit figures might indicate challenges. Comparative analysis involves benchmarking a company’s financial performance against its competitors or industry averages. This helps determine if the company is outperforming, underperforming, or performing in line with its peers. Organisations like NSE and BSE provide data that facilitates such comparisons, helping investors identify leaders and laggards in specific sectors.
Frequently Asked Questions
What is the most important financial statement for a beginner investor?
While all three are important, the Cash Flow Statement is often considered most crucial for beginners as it reveals the actual cash a company generates from its operations, which is the lifeblood of any business.
How often should I check a company’s financial statements?
For actively traded stocks, reviewing quarterly results as soon as they are released is recommended. For long-term investments, an annual review of audited financial statements is essential, supplemented by quarterly updates.
Can I find financial statements easily for Indian companies?
Yes, financial statements for companies listed on NSE and BSE are readily available on their respective websites, as well as on the websites of the companies themselves, and through financial data aggregators.
What does a declining Net Profit Margin signify?
A declining Net Profit Margin can indicate that a company is facing increased competition, rising costs, or inefficiencies in its operations, leading to a smaller portion of revenue translating into profit.
How does leverage affect a company’s financial statements?
High leverage (significant debt) increases financial risk. It shows up as higher interest expenses on the Income Statement and increased liabilities on the Balance Sheet, making the company more vulnerable to economic downturns.
Is it better to have more cash on the Balance Sheet?
While a healthy cash balance is good, an excessively large cash hoard without a clear plan for deployment might indicate inefficient capital allocation. The optimal amount depends on the company’s industry and strategic needs.
Key Takeaways:
- Financial statements (Balance Sheet, Income Statement, Cash Flow) are essential for assessing a company’s health.
- The Balance Sheet shows Assets = Liabilities + Equity at a point in time.
- The Income Statement reveals profitability over a period.
- The Cash Flow Statement tracks cash movements from operations, investing, and financing.
- Key ratios (Current Ratio, Debt-to-Equity, ROE) provide comparative insights.
- Analysing trends and comparing against peers is crucial for context.
- Always look for consistency and avoid focusing on just one statement.
Investing in the stock market involves inherent risks. Please consult with a qualified financial advisor before making any investment decisions.





 Finovatives