TL;DR: Market breadth indicators analyse the participation of individual stocks in market movements, helping traders identify underlying strength or weakness beyond just headline index performance, leading to more robust trading decisions.
Key Stats at a Glance:
- Nifty 50 constituent stocks: 50
- BSE Sensex constituent stocks: 30
- Average daily trading volume on NSE (April 2024): ~₹1.1 Lakh Crore
- Advance-Decline Ratio significance: Often considered bullish if above 1.5-2.0, bearish if below 0.7-1.0
- Volume Spike indicator: Can signal increased institutional interest or significant news events
What are Market Breadth Indicators?
Market breadth indicators measure the extent to which individual stocks are participating in a market’s overall move (up or down), providing a deeper insight into market sentiment and underlying strength.
While headline indices like the Nifty 50 or BSE Sensex give you the ‘what’ – the overall market direction – market breadth indicators tell you the ‘how’ and ‘why’. They help you understand if the market’s movement is broad-based and sustainable or if it’s being driven by a few large-cap stocks, potentially masking underlying weakness. Essentially, they gauge the ‘health’ of the market by looking at the number of advancing stocks versus declining stocks, trading volumes, and new highs versus new lows.
Why are Market Breadth Indicators Important for Indian Traders?
These indicators are crucial because they can provide early warnings of potential trend reversals and confirm the strength of existing trends, helping Indian traders make more timely and confident decisions.
In the dynamic Indian stock market, relying solely on price charts can sometimes be misleading. A rising Nifty might be propped up by just a handful of heavyweights, while the majority of stocks are actually declining. Breadth indicators like the Advance-Decline (A-D) Line or the New Highs-New Lows Index can reveal this divergence. For instance, if the Nifty is making new highs but the A-D Line is declining, it signals a weakening market, potentially a precursor to a correction. This information is invaluable for traders looking to enter or exit positions strategically, avoiding being caught on the wrong side of a reversal. Understanding these nuances can significantly improve risk management and profitability, especially for retail investors navigating NSE and BSE.
Identifying Trend Strength
Strong market breadth indicates a healthy uptrend, with a large number of stocks participating and driving prices higher, suggesting sustainability.
Spotting Divergences and Reversals
When the index moves in one direction but breadth indicators move in the opposite direction, it often signals a potential trend reversal is brewing.
Confirming Price Action
Breadth indicators can serve as a confirmation tool. If the index is rising and breadth is also strong, it reinforces the bullish sentiment.
Key Market Breadth Indicators to Watch
Several key indicators help gauge market breadth, each offering a unique perspective on stock participation and market sentiment.
1. Advance-Decline (A-D) Line
The A-D Line is one of the most fundamental breadth indicators. It’s calculated by summing the net difference between advancing and declining stocks each day. A rising A-D Line suggests more stocks are going up than down, indicating bullish sentiment, while a falling line indicates bearish sentiment. Divergences between the A-D Line and the index are significant signals.
2. Volume Analysis
While not strictly a breadth indicator, volume provides critical context. High volume accompanying a price move suggests strong conviction. Traders often look at the Advance-Decline Volume or Volume on Up/Down Days to see if buying or selling pressure is dominant on a broad scale.
3. New Highs-New Lows Index
This indicator compares the number of stocks reaching 52-week highs against those reaching 52-week lows. A high number of new highs suggests a strong bullish market, while a high number of new lows indicates weakness. A significant divergence between this index and the main market indices can signal an impending trend change.
4. Percentage of Stocks Above Moving Averages
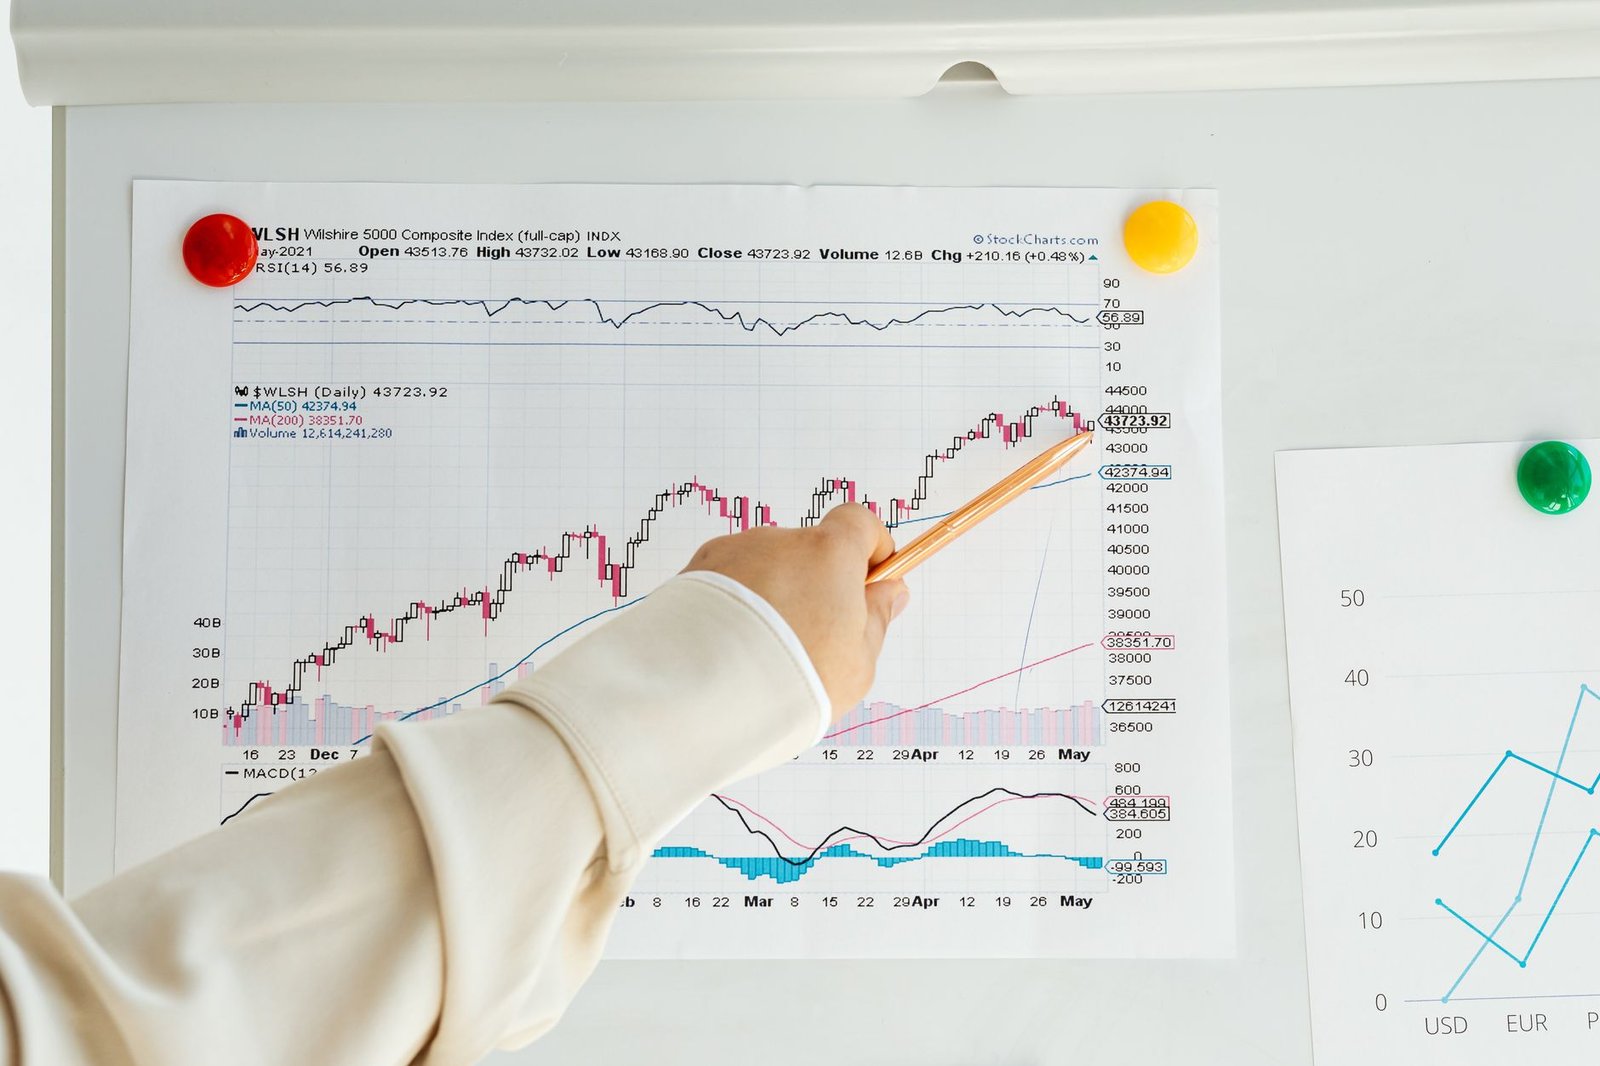
This indicator shows the percentage of stocks within an index (like Nifty 500) that are trading above their 50-day or 200-day moving average. A higher percentage suggests broad market strength, while a declining percentage can indicate weakening participation.
How to Interpret Market Breadth Indicators
Interpreting these indicators involves looking for trends, divergences, and confirmation signals in conjunction with price action and other technical tools.
Effective interpretation requires practice and a holistic view. Don’t rely on a single indicator; use them together with your preferred charting techniques, perhaps even enhancing your analysis with a custom TradingView indicator. For example, if the Nifty is trending upwards, and simultaneously, the A-D Line is also making higher highs, and the Percentage of Stocks Above 50-DMA is above 70%, these are strong confirming signals of a healthy uptrend. Conversely, if the Nifty hits a new high, but the A-D Line makes a lower high, and the number of new 52-week lows starts increasing, it’s a bearish divergence, signalling caution. Understanding these confluence points is key.
Reading Divergences
A divergence occurs when the market index moves in one direction, but a breadth indicator moves in the opposite direction. For instance, if the Nifty 50 makes a new high, but the A-D Line fails to make a new high, it’s a bearish divergence, suggesting the underlying market strength is waning.
Confirming Trends
When the market index and breadth indicators move in tandem, it confirms the prevailing trend. Rising index with a rising A-D Line and increasing new highs validates a bull market.
Gauging Extremes
Some breadth indicators can help identify overbought or oversold conditions on a broader market scale, suggesting potential turning points.
How to Use Market Breadth Indicators for Trading Decisions
Integrating market breadth analysis into your trading strategy can lead to more informed entry and exit points, as well as better risk management.
- Select Key Indicators: Choose 2-3 breadth indicators that resonate with your trading style (e.g., A-D Line, New Highs-New Lows).
- Monitor Daily: Track these indicators daily, especially in relation to the major Indian indices (Nifty, Sensex).
- Look for Divergences: Pay close attention when the index and your chosen breadth indicators are moving in opposite directions. These are often early warning signs.
- Confirm Trends: Use breadth indicators to confirm the strength of an ongoing trend. Strong breadth supports the existing price action.
- Identify Reversals: A divergence combined with other technical signals (like candlestick patterns or support/resistance breaks) can help pinpoint potential trend reversals.
- Manage Risk: Use breadth signals to adjust your position sizing or stop-loss levels. Weakening breadth might warrant a more cautious approach.
- Integrate with Other Tools: Combine breadth analysis with your preferred charting tools and fundamental analysis for a comprehensive view.

Common Pitfalls to Avoid
While powerful, market breadth indicators can be misinterpreted. Awareness of common pitfalls can prevent trading errors.
Over-reliance on a Single Indicator
No indicator is perfect. Relying solely on one breadth indicator without considering price action or other market factors can lead to false signals.
Ignoring Timeframes
Breadth indicators can provide signals on different timeframes. Ensure you are interpreting them within the context of your trading horizon (e.g., short-term vs. long-term).
Misinterpreting Divergences
Divergences are not guarantees of a reversal. They are warnings that require further confirmation before acting upon them.
Not Considering Market Cap or Sector
Some breadth indicators might be heavily influenced by large-cap stocks. Consider using sector-specific breadth or indicators that account for market capitalization differences for a more nuanced view.
Frequently Asked Questions
What is the most important market breadth indicator?
The Advance-Decline Line is often considered the most fundamental and widely used market breadth indicator due to its simplicity and effectiveness in showing the overall participation trend.
Can market breadth indicators predict the future?
While they offer valuable insights into current market sentiment and potential future direction, they are not foolproof predictors. They work best when used in conjunction with other technical and fundamental analysis tools.
How often should I check market breadth indicators?
For active traders, checking these indicators daily is recommended. Longer-term investors might review them weekly or monthly to gauge the overall market health.
Are there specific breadth indicators for the Indian market?
While the core indicators like A-D Line and Volume are universal, their interpretation can be tailored to Indian indices like Nifty 50 and BSE Sensex, and specific market conditions prevailing on NSE and BSE.
What is a bullish divergence in market breadth?
A bullish divergence occurs when a stock or index makes a lower low, but its market breadth indicator makes a higher low, suggesting underlying buying strength is increasing despite the price action.
How do volume indicators complement breadth indicators?
Volume analysis quantifies the conviction behind price moves. When combined with breadth, it helps differentiate between a broad market rally on heavy volume (strong) versus a rally on light volume (weak).

Key Takeaways
- Market breadth indicators reveal the participation of individual stocks in market movements, offering a deeper view than index levels alone.
- Key indicators include the Advance-Decline Line, New Highs-New Lows Index, and Percentage of Stocks Above Moving Averages.
- Divergences between breadth indicators and price indices are critical signals of potential trend reversals.
- Breadth analysis helps confirm existing trends and gauge the overall health and sustainability of market moves.
- Using breadth indicators in conjunction with other technical analysis tools provides a more robust trading strategy.
- Avoid over-reliance on a single indicator and always consider the context of your trading timeframe.
- Understanding market breadth is essential for making informed decisions in the Indian stock market.
Trading in the Indian stock market involves risks. Please consult with a SEBI-registered investment advisor before making any investment decisions.





 Finovatives