


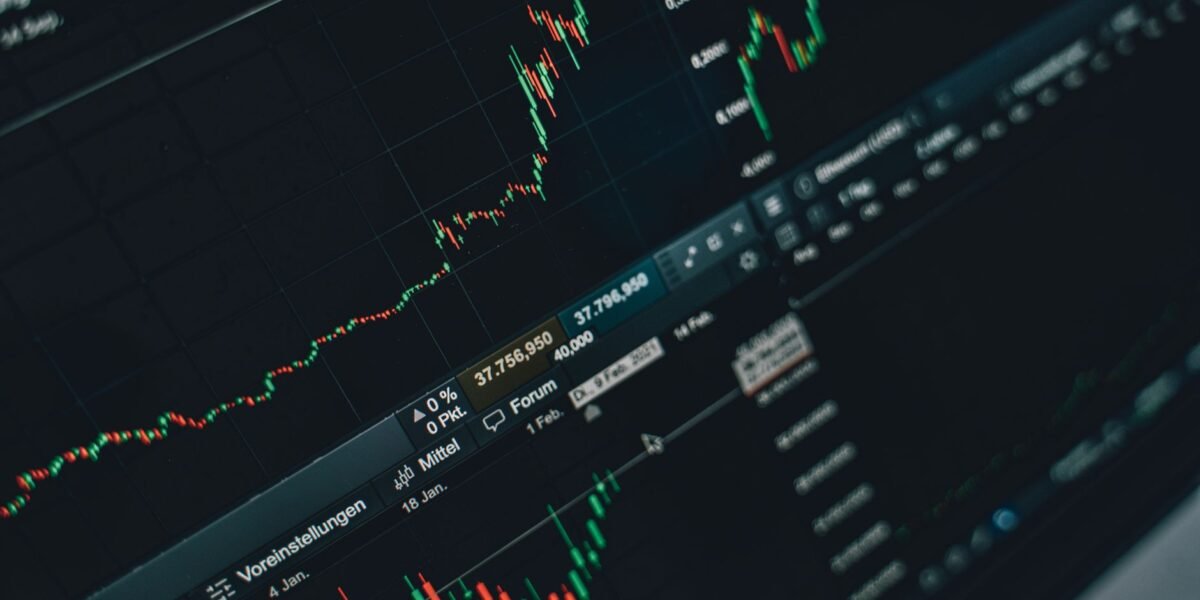
TL;DR: The most effective intraday trading strategies for the Indian stock market leverage momentum, scalping, and range-bound principles, requiring discipline, risk management, and a keen understanding of price action and technical indicators.
Key Stats at a Glance:
- Nifty 50 average daily traded volume: ₹15,000 – ₹20,000 crore
- BSE Sensex 30-day volatility: Currently averaging 8-10%
- Average retail trader success rate in intraday: Estimated below 15%
- Most traded futures & options contracts on NSE daily: Over 1 crore
- SEBI mandates: Peak margin requirements and other risk-reducing norms
What are the top intraday trading strategies for the Indian stock market?
The top intraday trading strategies for the Indian stock market include Momentum Trading, Scalping, Range-Bound Trading, and Breakout Trading, each tailored to different market conditions and trader profiles.
1. Momentum Trading
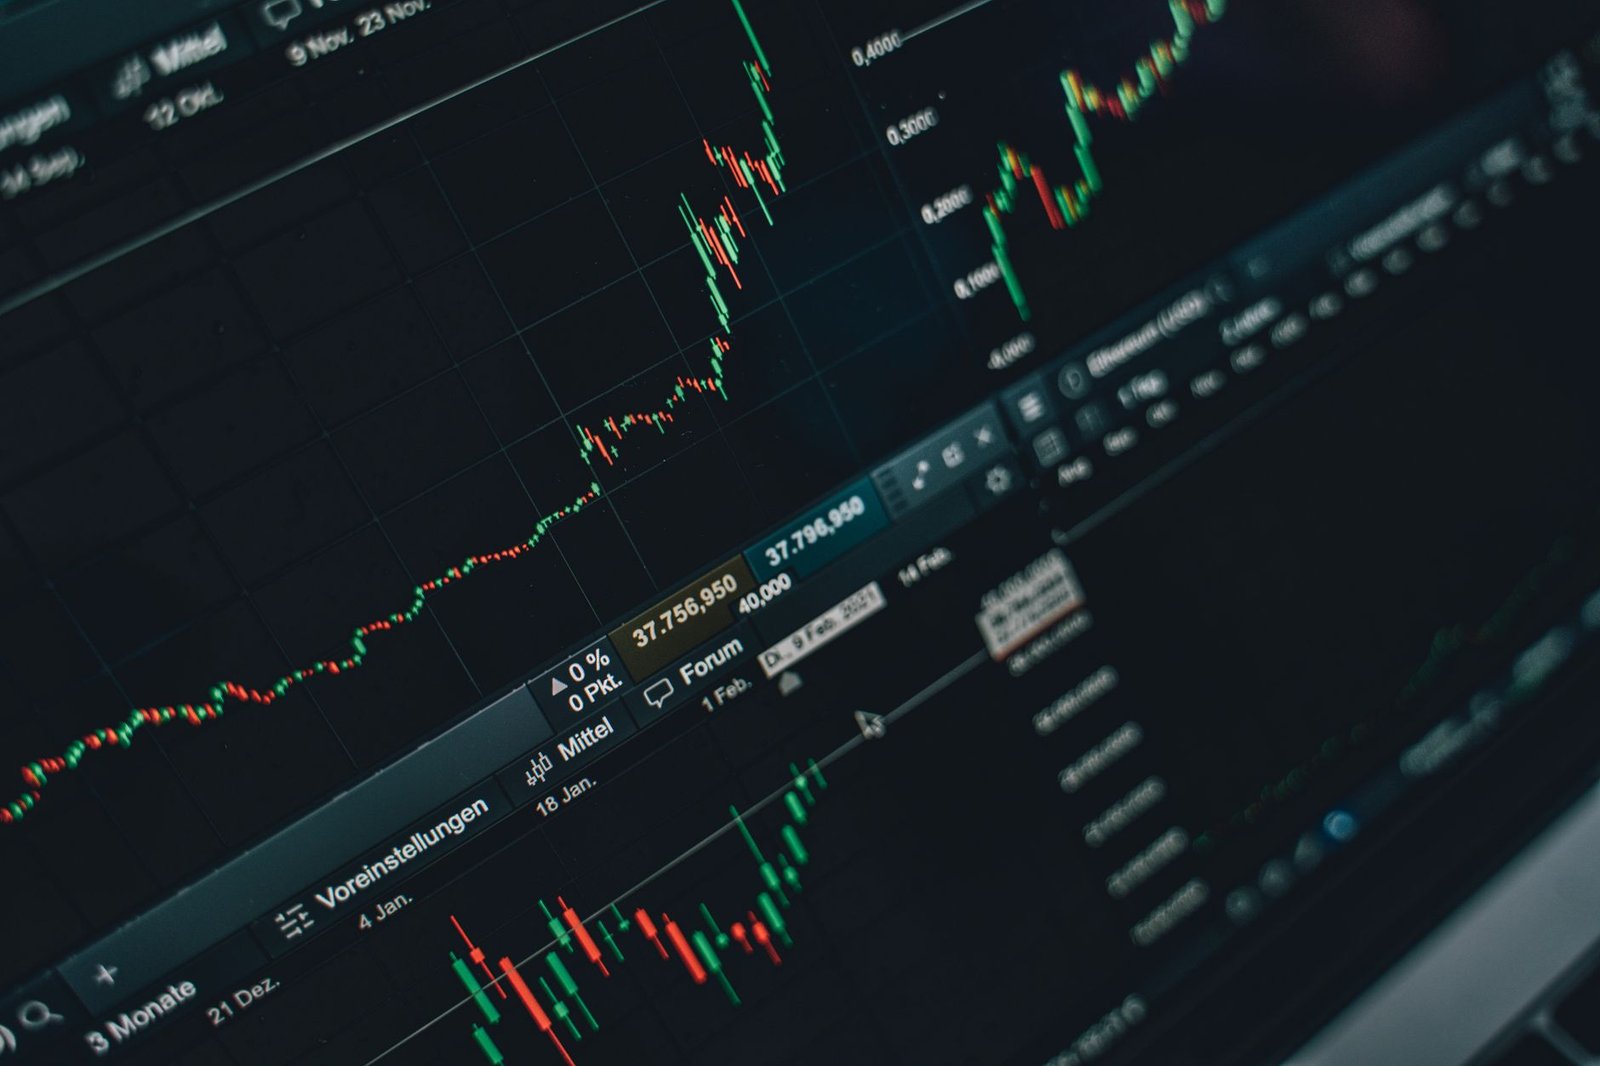
Momentum trading involves identifying stocks that are exhibiting strong upward or downward price trends and capitalizing on that existing momentum. The core idea is to buy stocks that are rising rapidly and sell stocks that are falling rapidly, with the expectation that the trend will continue for a short period. This strategy requires quick decision-making and a good understanding of technical indicators like Moving Averages (MAs), Relative Strength Index (RSI), and MACD to confirm the strength and potential longevity of the trend. Traders often set tight stop-losses to protect against sudden trend reversals.
2. Scalping
Scalping is an extremely short-term trading strategy where traders aim to make numerous small profits from small price changes throughout the trading day. Scalpers typically hold positions for seconds to minutes, looking to capture tiny gains repeatedly. This strategy requires immense focus, discipline, and a robust trading system, often relying on real-time Level 2 data, order flow, and rapid execution. Key tools for scalpers include high-frequency charts (e.g., 1-minute or 5-minute) and indicators that show immediate price action, such as the Moving Average Convergence Divergence (MACD) or Stochastic Oscillator. The success of scalping depends on the ability to execute trades quickly and efficiently, with very tight stop-losses to manage risk across multiple small trades.
3. Range-Bound Trading
Range-bound trading, also known as trading within a channel, is employed when a stock’s price is oscillating between a defined support and resistance level. Traders identify this range and buy near the support level, expecting the price to bounce back up, and sell near the resistance level, anticipating a price drop. This strategy is effective in sideways or consolidating markets where strong directional trends are absent. Technical indicators like the Bollinger Bands, RSI (looking for overbought/oversold conditions), and Stochastic Oscillator are particularly useful in identifying these trading ranges and potential reversal points. The profit targets are typically the opposite boundary of the range, and stop-losses are placed just outside the support or resistance levels to protect against a breakout.
4. Breakout Trading
Breakout trading capitalizes on the significant price movement that often occurs when a stock’s price breaks through a defined support or resistance level, or a chart pattern’s boundary. The premise is that once a price breaches a key level, it is likely to continue moving in the direction of the breakout. Traders enter a position immediately after the breakout is confirmed, anticipating a continuation of the new trend. This strategy often involves using volume as a confirmation tool; a breakout accompanied by high trading volume is generally considered more reliable. Indicators like the Average True Range (ATR) can help set appropriate stop-loss levels for breakout trades.
What are the key technical indicators for intraday trading?
Key technical indicators crucial for intraday trading in the Indian stock market include Moving Averages, Relative Strength Index (RSI), MACD, Bollinger Bands, and Volume, which help in identifying trends, momentum, overbought/oversold conditions, and potential breakouts.
1. Moving Averages (MAs)
Moving Averages smooth out price data to create a single flowing line, making it easier to identify the direction of a trend. Simple Moving Averages (SMA) and Exponential Moving Averages (EMA) are commonly used. Short-term MAs (e.g., 9-day, 20-day) are more responsive to recent price changes and are favoured by intraday traders. Crossovers between short-term and long-term MAs can signal potential trend changes. For instance, a bullish crossover occurs when a shorter-term MA crosses above a longer-term MA, suggesting an upward price movement.
2. Relative Strength Index (RSI)
The RSI is a momentum oscillator that measures the speed and change of price movements. It oscillates between 0 and 100 and is typically used to identify overbought (usually above 70) or oversold (usually below 30) conditions in a stock. For intraday traders, RSI can help in timing entries and exits, particularly in range-bound markets, by signalling potential reversals when the indicator reaches extreme levels. It can also confirm the strength of a trend when it stays within the 40-60 range.
3. Moving Average Convergence Divergence (MACD)
The MACD is a trend-following momentum indicator that shows the relationship between two exponential moving averages of a stock’s price. It consists of the MACD line, a signal line, and a histogram. A bullish signal is generated when the MACD line crosses above the signal line, and a bearish signal occurs when it crosses below. The histogram visually represents the divergence between the MACD and signal lines, with positive values indicating upward momentum and negative values indicating downward momentum. MACD is effective for identifying trend shifts and momentum strength.
4. Bollinger Bands
Bollinger Bands consist of a set of three lines plotted relative to a security’s price: a simple moving average (middle band) and two outer bands set at a specific number of standard deviations above and below the middle band. They are used to measure volatility and identify potential overbought or oversold conditions. When the bands narrow, it indicates low volatility, often preceding a significant price move. When prices repeatedly touch the upper band, the stock may be overbought, and when they touch the lower band, it may be oversold. Price movements outside the bands can signal a continuation of the trend.
5. Volume
Volume represents the number of shares traded during a specific period. For intraday traders, volume is a critical confirmation tool. An increase in volume accompanying a price move suggests strong conviction behind the move. For example, a breakout to the upside on high volume is a bullish signal, indicating strong buying interest. Conversely, a price decline on heavy volume suggests aggressive selling. Low volume during a price move can indicate a lack of conviction and a potential for trend reversal.

How to develop a successful intraday trading plan?
Developing a successful intraday trading plan involves defining clear objectives, choosing appropriate strategies, setting strict risk management rules, selecting the right stocks, and maintaining a trading journal for continuous improvement.
- Define Trading Goals: Clearly state your financial objectives, risk tolerance, and the amount of capital you are willing to allocate to intraday trading.
- Choose Your Strategy: Select one or two intraday trading strategies (e.g., momentum, scalping) that align with your personality, risk appetite, and market understanding.
- Set Risk Management Rules: Determine your maximum acceptable loss per trade (e.g., 1-2% of capital) and your overall daily loss limit. Implement strict stop-loss orders for every trade.
- Stock Selection Criteria: Define the criteria for selecting stocks for intraday trading, focusing on liquidity, volatility, and adherence to your chosen strategy. Use screening tools to identify potential candidates.
- Entry and Exit Points: Clearly define the specific conditions for entering a trade and the price levels at which you will take profits (target) and cut losses (stop-loss).
- Time Management: Allocate specific time slots for trading and stick to them. Avoid trading during volatile news events unless your strategy specifically accounts for it.
- Trading Journal: Keep a detailed record of every trade, including the stock, entry/exit points, profit/loss, strategy used, and your emotional state.
- Review and Adapt: Regularly review your trading journal to identify patterns, learn from mistakes, and refine your strategy and plan over time.
What are the risks associated with intraday trading in India?
Intraday trading in India carries significant risks, including the potential for substantial capital loss due to high volatility, the psychological pressure of rapid decision-making, the impact of leverage, and transaction costs.
1. High Volatility and Capital Loss
The Indian stock market, especially during intraday sessions, can be highly volatile. Sudden price swings can lead to rapid and substantial losses, potentially wiping out a significant portion or all of the capital invested in a single trade if not managed properly with stop-losses.
2. Emotional and Psychological Pressure
Intraday trading demands quick decisions under pressure. Fear of missing out (FOMO) and the urge to recover losses can lead to impulsive trading, deviating from the trading plan and increasing the likelihood of errors and further losses.
3. Leverage Risks
Brokers often offer leverage (margin trading) to intraday traders, allowing them to trade with more capital than they possess. While leverage can amplify profits, it equally magnifies losses. A small adverse price movement can result in margin calls or significant debt if the losses exceed the trader’s capital.
4. Transaction Costs
Intraday traders often execute multiple trades within a single day. The cumulative effect of brokerage fees, taxes (like STT, GST), and other charges on these frequent trades can erode profits significantly, especially for small gains.
5. Information Overload and Market Noise
The constant barrage of news, analyses, and real-time price fluctuations can be overwhelming. Distinguishing genuine trading signals from market noise requires a disciplined approach and a well-defined strategy to avoid confusion and poor decision-making.
Frequently Asked Questions
What is the best time for intraday trading in India?
The best time for intraday trading in India is typically the first 1.5-2 hours after market open (9:15 AM to 11:30 AM IST) and the last hour before market close (2:30 PM to 3:30 PM IST), as these periods usually exhibit higher volume and volatility.
How much capital is needed for intraday trading?
While there’s no fixed minimum, a capital of ₹20,000 – ₹50,000 is often considered a starting point for serious intraday trading in India, allowing for diversification and adequate risk management after accounting for margin and charges.
Is intraday trading profitable?
Intraday trading can be profitable for disciplined traders who follow a well-defined strategy, manage risk effectively, and have realistic expectations. However, it carries significant risk, and most new traders experience losses initially.
Can I use TradingView indicators for intraday strategies?
Yes, TradingView indicators are excellent tools for intraday trading. Many popular indicators like MAs, RSI, MACD, and Bollinger Bands are readily available on TradingView and can be customized to suit intraday timeframes and strategies.
What is a stop-loss in intraday trading?
A stop-loss is an order placed with a broker to buy or sell a security when it reaches a certain price. It’s a risk management tool used to limit an investor’s potential loss on a trade.
How important is volume in intraday trading?
Volume is extremely important in intraday trading. It confirms the strength of a price move, indicating the conviction of market participants. High volume accompanying a breakout or trend move lends credibility to the price action.
Key Takeaways
- Momentum trading, scalping, range-bound trading, and breakout trading are popular intraday strategies.
- Technical indicators like MAs, RSI, MACD, Bollinger Bands, and Volume are essential for analysis.
- A robust trading plan with strict risk management is crucial for success.
- Understanding and mitigating risks like volatility, leverage, and emotional trading is vital.
- The first and last hours of the trading session typically offer the most opportunities.
- Continuous learning and adapting based on a trading journal are key to long-term profitability.
Trading in the Indian stock market involves risks, including the potential loss of capital. Past performance is not indicative of future results.


 Finovatives