TL;DR: Support and resistance levels are price points where a stock’s trend is likely to pause or reverse, with support acting as a floor and resistance as a ceiling, offering crucial insights for Indian traders to make informed buy/sell decisions.
Key Stats at a Glance:
- Nifty 50 has historically shown clear support/resistance patterns in intraday and swing trading.
- Over 80% of price movements can be explained by the interplay of supply and demand, visualized via S/R.
- A breakout above a resistance level can signal a new uptrend, potentially increasing by 10-20% or more.
- A breakdown below support can indicate a downtrend, often leading to further declines.
- NSE data shows that significant volume often accompanies tests of major support and resistance zones.
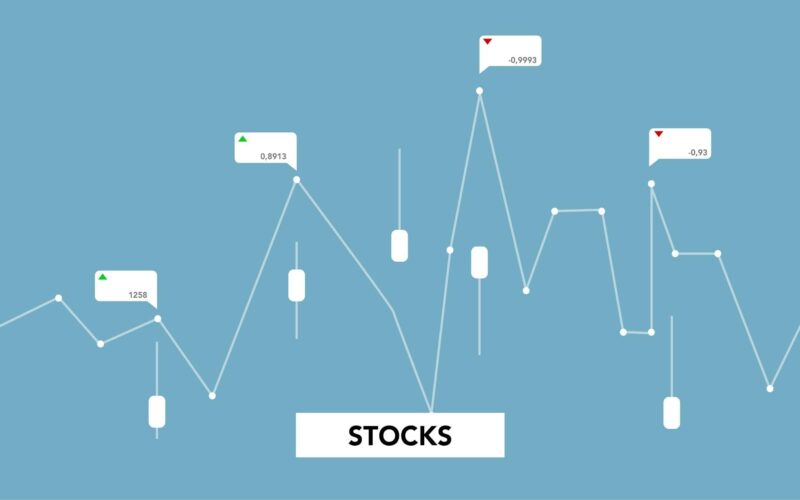
What are Support and Resistance Levels?
Support and resistance levels are price areas on a chart where a security’s price has historically had trouble breaking through in one direction or the other.
Defining Support
Support is a price level where demand is strong enough to overcome supply, causing a downtrend to pause or reverse. It acts as a ‘floor’ for the price.
Defining Resistance
Resistance is a price level where supply exceeds demand, causing an uptrend to pause or reverse. It acts as a ‘ceiling’ for the price.
The Psychology Behind These Levels
These levels are rooted in market psychology, where traders and investors remember previous price points. When a stock approaches a prior support level, buyers who missed out previously may step in, expecting a bounce. Conversely, at a prior resistance level, sellers who are underwater might exit their positions, or new sellers may enter, anticipating a price drop.
Why are Support and Resistance Crucial for Indian Traders?
Support and resistance levels are fundamental tools for Indian stock market participants because they help identify potential turning points in price trends, thereby guiding trading decisions.
Identifying Entry and Exit Points
Traders use support levels to find potential buy entry points, anticipating a price bounce. Conversely, resistance levels are used to identify potential sell exit points for long positions or to initiate short positions, expecting a price decline.
Risk Management
These levels are vital for setting stop-loss orders. A stop-loss is typically placed just below a support level for a long position or just above a resistance level for a short position, limiting potential losses if the price moves against the trade.
Trend Confirmation
When a stock price repeatedly bounces off a support or resistance level, it confirms the strength of that level and the prevailing trend. A breakout from these levels can signal a significant shift in momentum.
Forecasting Potential Price Targets
Once a breakout occurs, the distance from the previous support/resistance level to the point of breakout can sometimes indicate the potential magnitude of the subsequent move, helping traders set profit targets.
The interplay of supply and demand, visualized through price action at support and resistance, is a core element of technical analysis taught by numerous financial education platforms in India.
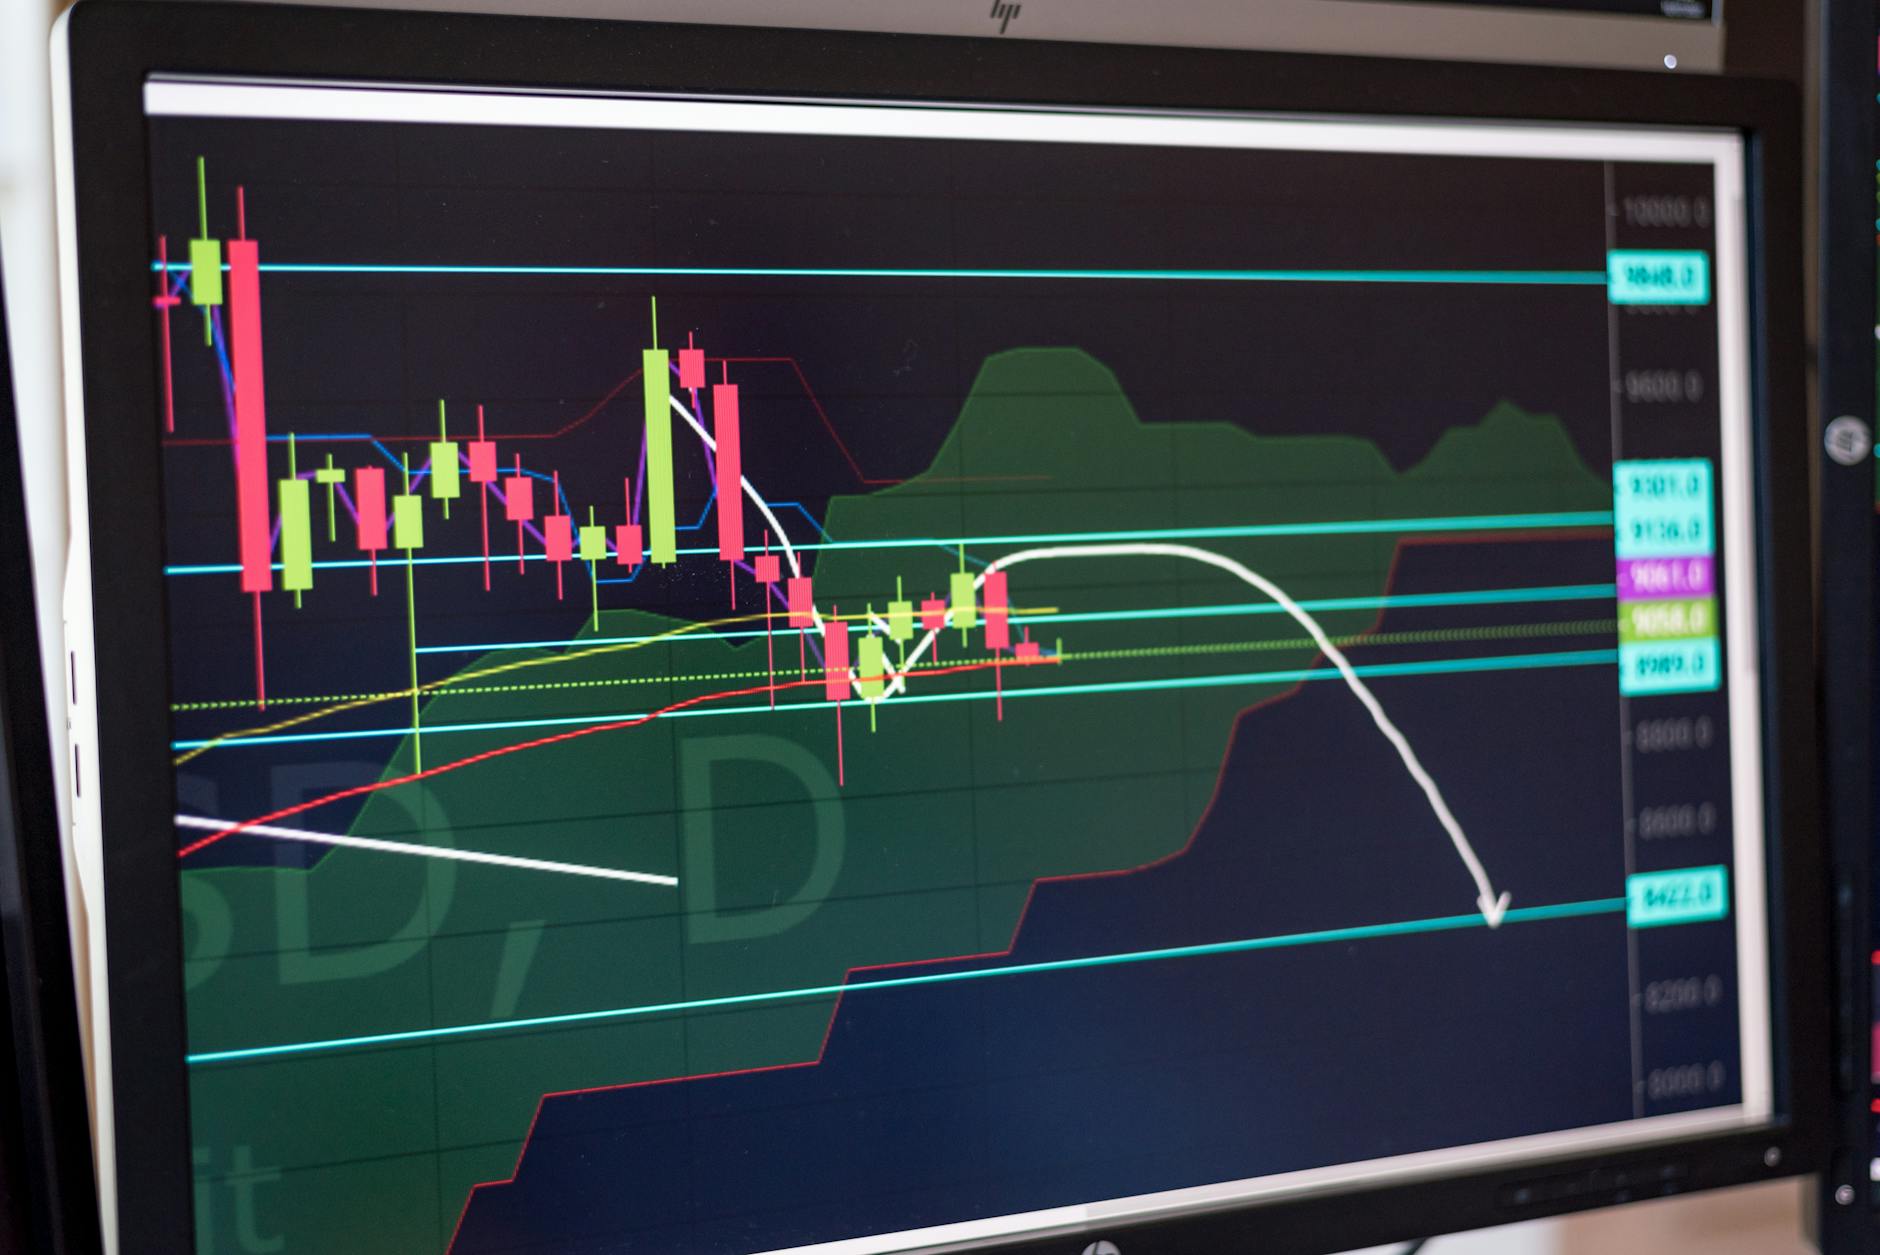
How to Identify Support and Resistance Levels
Identifying these key levels involves looking at historical price action on stock charts, employing various methods to pinpoint significant price points.
Historical Price Peaks and Troughs
The simplest method is to look at past price charts and identify significant swing highs (resistance) and swing lows (support). These are points where the price reversed direction decisively.
Trendlines
Uptrends are often supported by an upward-sloping trendline connecting a series of higher lows. Downtrends are characterized by a downward-sloping trendline connecting a series of lower highs.
Moving Averages
Commonly used moving averages, such as the 50-day, 100-day, or 200-day Moving Average, can act as dynamic support or resistance levels. As the price moves, these averages adjust, providing a fluid S/R zone.
Psychological Levels (Round Numbers)
Round numbers, like ₹100, ₹500, or ₹1000, often act as psychological support or resistance levels due to their significance in traders’ minds.
Volume Analysis
High trading volume at a particular price level can indicate strong interest from buyers or sellers, reinforcing that level as significant support or resistance.
Trading Strategies Using Support and Resistance
Several trading strategies leverage the principles of support and resistance to capitalize on market movements.
The Bounce Strategy
This involves buying near a support level, expecting the price to bounce upwards, or selling near a resistance level, expecting the price to fall. A stop-loss is placed just beyond the S/R level.
The Breakout Strategy
Traders look for a decisive break of a support or resistance level, often accompanied by increased volume. A breakout above resistance signals a potential long entry, while a breakdown below support suggests a potential short entry. The Finovatives Trend Traders Tool can be invaluable here.
The Breakdown/Break-Back-Test Strategy
After a breakout, the broken level often flips its role. If resistance is broken, it may become support. If support is broken, it may become resistance. Traders can enter a position on the retest of this new S/R level.
How to Implement the Breakout Strategy
- Identify a clear support or resistance level on your chart.
- Wait for the price to decisively break through this level, ideally with increased trading volume.
- Enter a long position if the price breaks above resistance, or a short position if it breaks below support.
- Place your stop-loss order just beyond the broken level (e.g., below the broken resistance for a long trade).
- Set a profit target based on previous price action or chart patterns.
- Monitor the trade; be prepared to exit if the breakout fails or your target is reached.

Common Pitfalls and How to Avoid Them
While powerful, support and resistance levels are not infallible and can lead to trading errors if misused.
False Breakouts
The price may briefly break a level only to reverse quickly. This can trap traders who entered based on the breakout. Confirming breakouts with volume and subsequent price action is key.
Ignoring Volume
A breakout on low volume is less convincing than one on high volume. Always consider volume to assess the conviction behind a price move.
Over-reliance on Single Levels
Markets are dynamic. Relying solely on one static S/R level without considering other indicators or market context can be risky.
Not Adjusting Levels
As new price data emerges, support and resistance levels can shift. Regularly review and update your identified levels.
Using Too Many Indicators
While confirming signals are good, cluttering your chart with too many S/R indicators can lead to analysis paralysis.
Support and Resistance in Different Market Conditions
The effectiveness and interpretation of support and resistance can vary based on the broader market context and asset class.
Trending Markets
In strong trending markets, support and resistance levels tend to hold longer, and breakouts are often more significant. Trendlines are particularly useful here.
Ranging Markets
In sideways or consolidating markets, prices tend to oscillate between clear support and resistance zones. Bounce strategies are more common in these conditions.
Volatility
High volatility can lead to wider trading ranges and more frequent, but potentially less reliable, breaches of S/R levels. This is where robust risk management becomes paramount.
NSE/BSE Specifics
On exchanges like the NSE and BSE, understanding the sector-specific news and broader market sentiment (e.g., Nifty 50 movements) is crucial, as these can override technical support and resistance levels.
Frequently Asked Questions
What is the difference between support and resistance?
Support is a price level where buying interest is expected to overcome selling pressure, preventing further price declines. Resistance is where selling pressure is expected to overcome buying interest, hindering further price increases.
How many support and resistance levels should I look for?
Focus on the most significant levels that have been tested multiple times. Typically, 2-3 key support and resistance zones are sufficient for most trading strategies.
Can support become resistance, and vice versa?
Yes, this is known as role reversal. When a resistance level is decisively broken, it often becomes a new support level, and a broken support level can become new resistance.
Are support and resistance levels always exact prices?
No, they are often price *zones* or areas rather than single, precise numbers. Prices may fluctuate slightly around these key levels.
How important is volume when identifying S&R?
Volume is critical. A high volume at a potential S&R level indicates strong conviction from market participants, making the level more significant.
Key Takeaways
- Support and resistance are fundamental price levels indicating potential trend reversals or continuations.
- Support acts as a floor, while resistance acts as a ceiling for stock prices.
- These levels are vital for identifying entry/exit points, managing risk, and confirming trends.
- Methods for identification include historical price action, trendlines, moving averages, and volume.
- Common strategies include bounce, breakout, and break-back-test approaches.
- Be aware of false breakouts and the importance of volume confirmation.
- Role reversal (support becoming resistance, and vice versa) is a key concept.
Trading in the Indian stock market involves risks, and past performance is not indicative of future results. Always conduct your own research and consider consulting a SEBI-registered investment advisor.