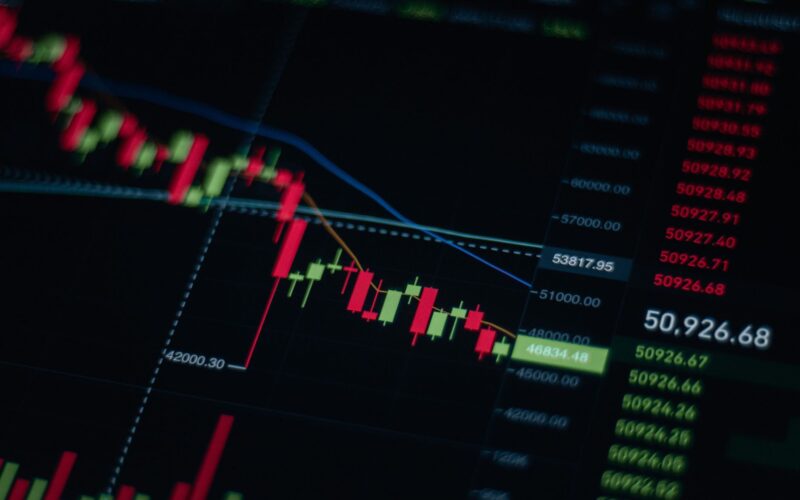
TL;DR: Volume analysis on the NSE reveals smart money activity by showing where significant capital is entering or exiting the market, often preceding major price movements and offering clues about future price direction.
Key Stats at a Glance:
- NSE lists over 2,000 companies, offering diverse trading opportunities.
- Average daily trading volume on NSE often exceeds ₹10,000 crore across various asset classes.
- Volume spikes can indicate institutional interest, with some large trades involving ₹100 crore+ blocks.
- A 300% increase in volume above average is often considered a significant volume surge.
- Nifty 50 has seen average daily volumes of over 20 crore shares in recent years.
What is Volume Analysis?
Volume analysis is a cornerstone of technical analysis that studies the number of shares or contracts traded during a specific period to gauge market sentiment and confirm price action. It involves interpreting the relationship between price movements and the corresponding trading volume to understand the conviction behind those moves.

By observing volume patterns, traders aim to identify whether a price move is supported by substantial buying or selling interest, often referred to as ‘smart money’ – institutional investors, hedge funds, and large traders who possess significant capital and market influence.
How Does Volume Indicate Smart Money Activity?
Smart money activity is typically indicated by unusual or significant changes in trading volume that coincide with price movements. Large institutional players often enter or exit positions in size, which can create noticeable spikes or sustained increases in trading volume, especially in less liquid stocks.
Identifying Institutional Footprints
Institutions often trade in large blocks, and their activity can dramatically increase the volume on a particular stock or index. When a stock price rises on exceptionally high volume, it suggests strong buying pressure from informed investors. Conversely, a price decline on heavy volume indicates significant selling by these same players.
Volume Confirmation of Trends
A fundamental principle is that significant price moves should be accompanied by significant volume. In an uptrend, rising volume as prices climb and declining volume as prices pull back suggests strong conviction from buyers. In a downtrend, increasing volume on down days and decreasing volume on up days points to persistent selling pressure.
Volume as a Reversal Signal
Volume can also signal potential trend reversals. A sharp price increase on extremely high volume, followed by signs of exhaustion (e.g., lower volume on subsequent price advances or a bearish candle), might indicate that smart money is taking profits or reversing positions. Similarly, a dramatic sell-off on unprecedented volume could signal a capitulation event where even large players are forced to liquidate, potentially marking a bottom.
Key Volume Indicators for NSE Traders
Several indicators help traders quantify and visualize volume analysis for actionable insights on NSE stocks. These tools translate raw volume data into patterns that can be easier to interpret.
On-Balance Volume (OBV)
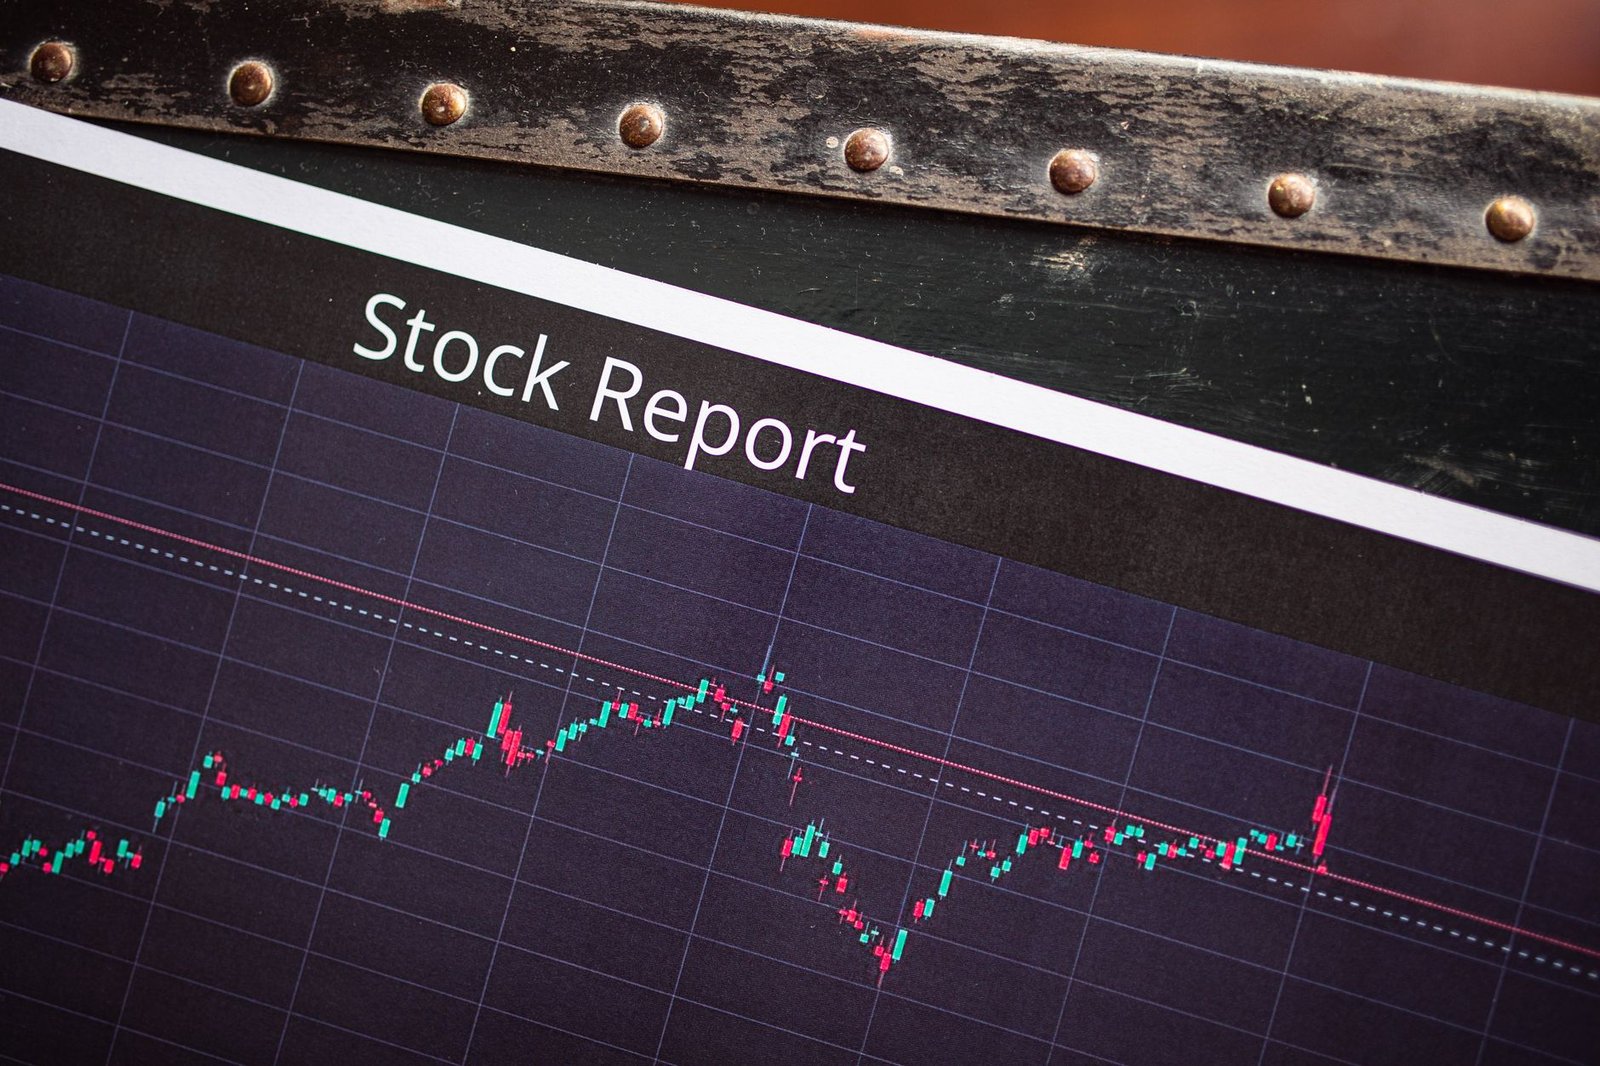
OBV is a momentum indicator that relates volume to price change. It adds the volume of up periods to a running total and subtracts the volume of down periods. A rising OBV suggests volume is heavier on up days, indicating buying pressure, while a falling OBV suggests heavier volume on down days, indicating selling pressure.
Volume Profile
Volume Profile goes beyond simple volume bars by displaying trading volume at different price levels over a specified period. It helps identify areas of high and low trading activity (Value Area High/Low, Point of Control), which can act as potential support and resistance zones. High volume nodes suggest areas where significant trading has occurred, potentially indicating zones of interest for smart money.
Volume Weighted Average Price (VWAP)
VWAP is a trading benchmark used primarily by institutional traders. It calculates the average price a security has traded at throughout the day, based on both volume and price. Many algorithms and institutional orders are executed around VWAP, making it a crucial level to watch for potential support, resistance, or areas of agreement between buyers and sellers.
Accumulation/Distribution Line
This indicator is similar to OBV but incorporates the closing price’s position within the day’s trading range. It attempts to measure the cumulative flow of money into or out of a security. A rising A/D line suggests accumulation (buying pressure), while a falling line suggests distribution (selling pressure).
How to Use Volume Analysis in Your NSE Trading Strategy
Integrating volume analysis into your trading strategy requires a systematic approach. It’s not just about looking at volume bars; it’s about interpreting them in conjunction with price action and other technical tools.
- Select Your Trading Instrument: Choose an NSE stock, index, or derivative you wish to trade.
- Observe Price Action and Volume: Monitor the price charts and corresponding volume bars. Look for price moves that are accompanied by unusually high volume.
- Identify Trend Strength: In an uptrend, check if volume increases on up moves and decreases on pullbacks. In a downtrend, verify if volume increases on down moves and decreases on rallies.
- Spot Potential Reversals: Watch for climactic volume spikes at the end of strong trends, which can signal exhaustion and potential reversals. Look for divergence between price and volume indicators like OBV.
- Utilize Volume Indicators: Employ tools like OBV, Volume Profile, or the A/D line to gain deeper insights into buying and selling pressure. For instance, check if OBV is trending higher with the stock price.
- Confirm with Other Tools: Use volume analysis in conjunction with other technical indicators (e.g., Moving Averages, RSI) and chart patterns to increase the probability of successful trades. Our [TradingView indicator] can help integrate these views.
- Define Entry and Exit Points: Use volume patterns to confirm entry signals generated by other methods. For example, enter a long position on a breakout if the breakout is supported by significantly increased volume.
- Manage Risk: Always use stop-losses and position sizing, regardless of the strength of volume signals. Volume analysis enhances decision-making but doesn’t eliminate risk.

Volume Analysis for Different Market Conditions
The interpretation of volume can vary significantly depending on the prevailing market conditions, such as trending versus range-bound markets.
Trending Markets
In a strong uptrend, expect to see rising volume on price advances and declining volume on price corrections. This pattern confirms the strength of the trend. A sudden surge in volume on a minor pullback might signal the end of the current leg up, or it could be smart money repositioning before the next leg.
Ranging Markets
In a sideways or range-bound market, volume tends to be lower and more erratic. Significant volume spikes within a range might indicate aggressive short-term players or institutions testing supply and demand levels. Traders often look for volume confirmation near the boundaries of the range, anticipating a breakout or bounce.
Breakout Scenarios
Volume is crucial for confirming breakouts. A breakout above resistance on significantly higher-than-average volume is a strong indication that smart money is pushing the price higher, suggesting a continuation of the new trend. A breakout on low volume is often considered a false breakout, prone to failure.

Volume and News Events
Major news events, earnings reports, or economic data releases can cause dramatic increases in volume. Smart money often uses these events to enter or exit positions before the broader market fully reacts to the information, making volume analysis critical during such periods.
Common Pitfalls in Volume Analysis
While powerful, volume analysis is not foolproof. Retail traders often make common mistakes that can lead to poor trading decisions.
Ignoring Relative Volume
Simply looking at absolute volume numbers can be misleading. What constitutes ‘high’ volume for one stock might be ‘low’ for another. Traders must compare current volume to its historical average (relative volume) to gauge its significance. Many platforms offer relative volume indicators, or you can calculate it manually by comparing current volume to the average volume over the past 10-20 periods.
Confusing Volume with Liquidity
High volume doesn’t always equate to high liquidity, especially in smaller-cap stocks. A large volume spike in a thinly traded stock might be caused by a single large trade, creating a distorted picture. Always consider the bid-ask spread and the overall depth of the order book.
Over-reliance on Volume Alone
Volume is a confirmation tool, not a standalone trading signal. Relying solely on volume without considering price action, chart patterns, or other indicators can lead to premature entries or exits. A strong volume signal should align with other technical evidence.

Misinterpreting Volume Spikes
Sudden volume spikes can occur for various reasons, including short squeezes, large institutional orders, or even market manipulation. It’s essential to analyze the context of the price action accompanying the volume spike to determine its true meaning.
Frequently Asked Questions
What is the most important volume indicator for NSE?
While subjective, On-Balance Volume (OBV) is often considered highly effective for NSE traders as it directly links volume to price direction and momentum, helping to confirm trends and spot potential divergences.
How can I identify ‘smart money’ using volume?
Look for significant, unusual volume spikes that coincide with specific price movements, particularly on stocks with substantial institutional participation. These spikes often occur when large capital is entering or exiting positions.
Does high volume always mean a stock will go up?
No. High volume indicates significant trading activity and conviction but does not inherently predict direction. It must be interpreted alongside price action; high volume on a down move signals strong selling, not necessarily a future rise.
Can volume analysis predict market tops and bottoms?
Volume analysis can provide early warnings of potential tops and bottoms, especially when accompanied by climactic volume spikes or divergences with price action, but it is not a guaranteed predictor and should be used with other tools.
Is volume analysis useful for intraday trading on NSE?
Yes, volume analysis is extremely useful for intraday trading. Volume spikes and patterns can confirm intraday trends, breakouts, and potential reversals, providing timely signals for short-term trades.
What is a typical volume increase that signals smart money interest?
A common rule of thumb is an increase of 2-3 times the average daily volume. However, the significance depends on the stock; a 50% increase in a highly liquid stock might be more meaningful than a 200% spike in a less liquid one.
Key Takeaways
- Volume analysis is crucial for understanding the conviction behind price movements on the NSE.
- Unusual volume spikes often indicate the activity of ‘smart money’ – institutional investors.
- Volume confirmation is essential for validating trends and identifying potential reversals.
- Key volume indicators include OBV, Volume Profile, VWAP, and Accumulation/Distribution Line.
- Volume analysis should be used in conjunction with other technical tools for better accuracy.
- Interpreting volume requires considering relative volume and market context, not just absolute numbers.
- Beware of common pitfalls such as over-reliance or misinterpreting volume spikes.
Trading in the securities market involves risks, including the potential loss of principal. Consult with a SEBI-registered investment advisor before making any investment decisions.



 Finovatives