

TL;DR: Analyzing the Indian stock market like a pro involves a multi-faceted approach, combining fundamental analysis of economic and company data with technical analysis of price charts and patterns, alongside astute sentiment gauging and risk management strategies.
Key Stats at a Glance:
- Nifty 50’s average annual return (2014-2023): ~12.05%
- BSE Sensex’s 10-year CAGR (approx.): 11.5%
- Number of listed companies on NSE: Over 2,000
- Average daily trading volume on NSE (Equity Segment): Over ₹10,000 Crore
- SEBI’s regulatory framework ensures market integrity and investor protection.
What is Fundamental Analysis in the Indian Context?
Fundamental analysis in the Indian stock market involves evaluating a company’s intrinsic value by examining its financial health, management quality, industry position, and macroeconomic factors relevant to the Indian economy.
Financial Statement Scrutiny
Digging into quarterly and annual reports from companies listed on the NSE and BSE is crucial. Key metrics to watch include Revenue Growth, Earnings Per Share (EPS), Debt-to-Equity ratio, and Return on Equity (ROE). Investors should compare these against industry peers and historical performance.
Economic Indicators and Policy Impact
Understanding India’s GDP growth, inflation rates (CPI/WPI), interest rate policies set by the RBI, and government fiscal policies are vital. For instance, infrastructure spending announcements can positively impact cement and steel stocks, while a hawkish RBI stance might weigh on interest-sensitive sectors.
Industry and Sectoral Trends
Analyzing the growth prospects of specific sectors like IT, pharmaceuticals, banking, or manufacturing within India is paramount. Factors like regulatory changes, technological advancements, and consumer demand shifts play a significant role. For example, the rise of digital payments has boosted fintech stocks.
Company Management and Corporate Governance
A strong, ethical management team with a clear vision is a hallmark of a fundamentally sound company. Investors should research the promoter holding, board independence, and any past governance issues reported by SEBI or financial news outlets.
What is Technical Analysis for Indian Traders?
Technical analysis for Indian traders focuses on using historical price and volume data to forecast future price movements, employing chart patterns, indicators, and trading tools to identify potential entry and exit points.
Understanding Chart Patterns
Recognizing common chart patterns like Head and Shoulders, Double Tops/Bottoms, Triangles, and Flags on charts of Nifty, Bank Nifty, or individual stocks provides insights into potential trend reversals or continuations. Tools like the Trend Traders Tool can help identify these formations.
Key Technical Indicators
Moving Averages (SMA, EMA), Relative Strength Index (RSI), MACD (Moving Average Convergence Divergence), and Bollinger Bands are indispensable. For instance, a bullish crossover of the 50-day Moving Average over the 200-day Moving Average on a Nifty chart is often seen as a positive sign.
Volume Analysis
High trading volumes accompanying a price move lend it more credibility. A breakout above resistance on significant volume suggests stronger conviction from market participants compared to a breakout on low volume.
Support and Resistance Levels
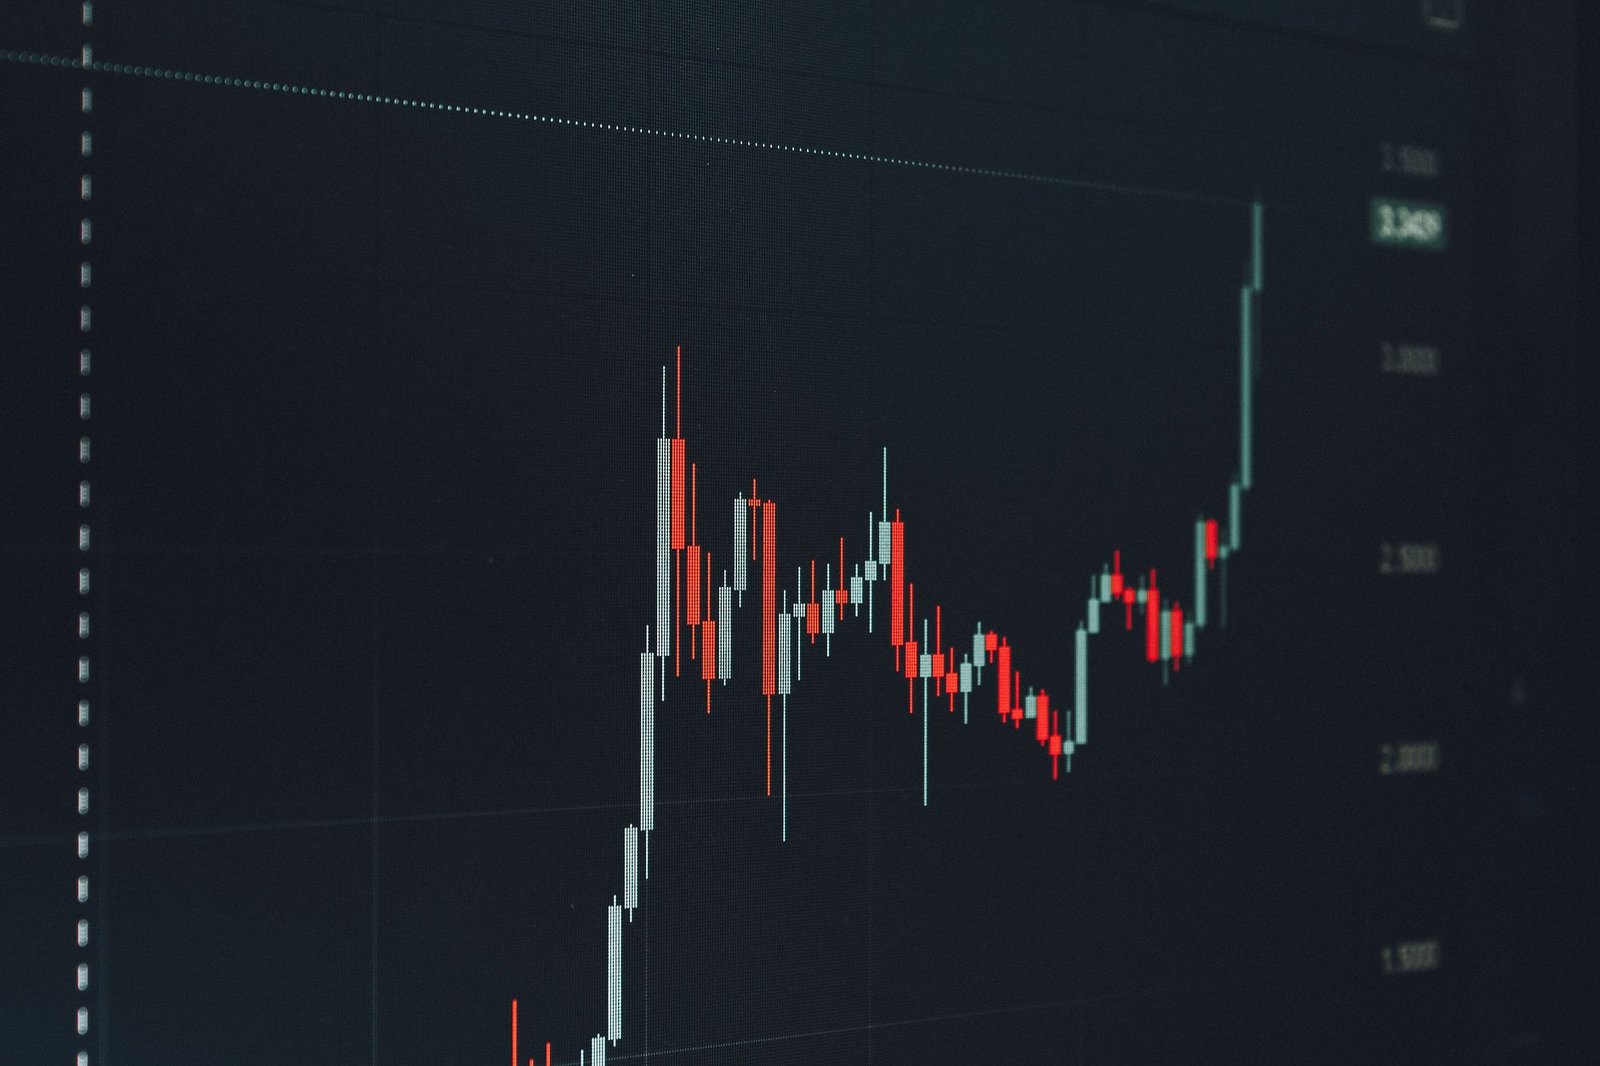
Identifying key support (where prices tend to stop falling) and resistance (where prices tend to stop rising) levels on daily, weekly, or monthly charts helps traders define risk and set profit targets. These levels can be derived from past price action or Fibonacci retracements.
How to Incorporate Market Sentiment Analysis?
Market sentiment analysis involves gauging the overall mood or attitude of investors and traders towards the Indian stock market or specific securities, often by looking at news, social media, and derivatives data.
News and Media Influence
Major news events, government policy changes, or corporate announcements can significantly sway market sentiment. Staying updated with reputable financial news sources like The Economic Times, Business Standard, and BloombergQuint is essential.
Derivatives Data (F&O Segment)
Open interest, put-call ratios (PCR), and futures data from the NSE’s F&O segment can provide clues about market sentiment. A high PCR, for example, might indicate bearish sentiment, while a low PCR could suggest bullishness.
Social Media and Investor Psychology
While often noisy, social media trends and discussions on platforms like Twitter can sometimes reflect prevailing market euphoria or panic. Understanding basic investor psychology (fear and greed) helps in interpreting this sentiment.
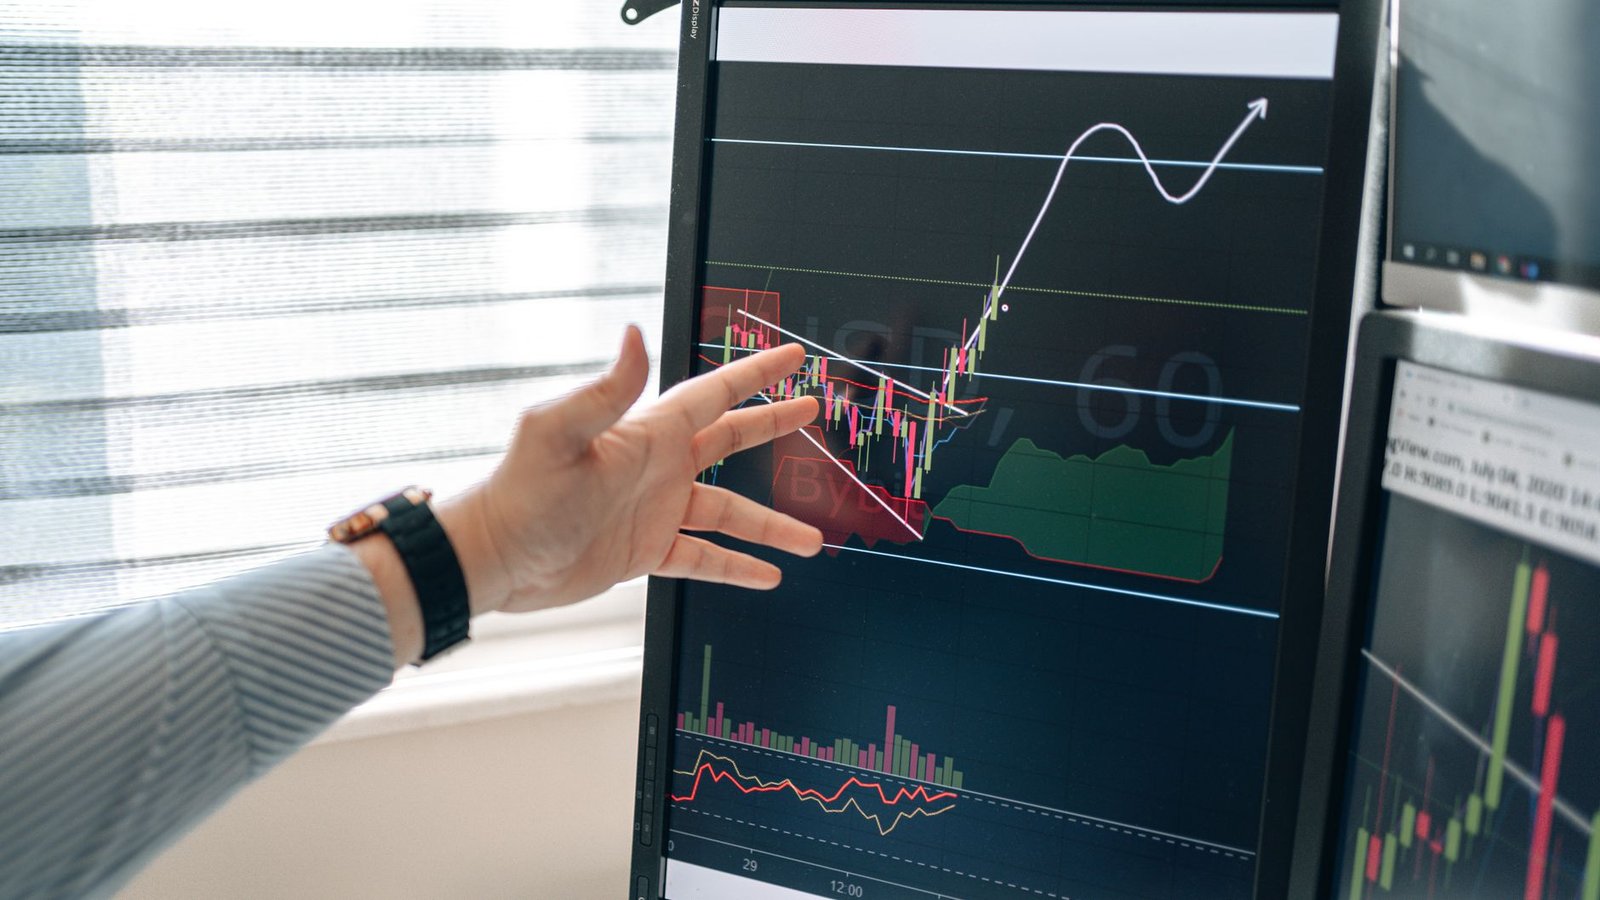
What is Algorithmic Trading and High-Frequency Trading (HFT) in India?
Algorithmic trading involves using computer programs to execute trades based on pre-defined instructions, while HFT is a type of algorithmic trading characterized by high speeds, high turnover rates, and high order-to-trade ratios, often seen in markets like NSE.
Role of Technology
Sophisticated algorithms leverage statistical methods and market data to identify trading opportunities at speeds unattainable by humans. This requires significant investment in technology and infrastructure.
Impact on Retail Traders
While direct participation in HFT is limited for retail traders, understanding its impact on market liquidity and volatility is important. Many advanced TradingView indicators for NSE are designed to help retail traders identify patterns that algos might exploit.
Regulatory Oversight
SEBI has implemented various regulations to ensure fairness and transparency in algorithmic trading, including order-to-trade ratio limits and circuit breakers, to mitigate risks associated with extreme volatility.
How to Develop a Trading Plan for the Indian Market?
Developing a trading plan involves defining your investment goals, risk tolerance, trading strategy, and rules for entering and exiting trades, tailored to the dynamics of the Indian stock market.
Define Your Goals and Risk Tolerance
Are you a short-term trader or a long-term investor? How much capital are you willing to risk per trade? Answering these questions sets the foundation for your strategy.
Choose Your Strategy
Whether it’s swing trading, positional trading, or day trading, select a strategy that aligns with your personality and market analysis approach. Backtesting your strategy using historical data is crucial.
Set Entry and Exit Rules
Clearly define the conditions under which you will enter a trade (e.g., specific indicator signals, price patterns) and exit (e.g., stop-loss levels, profit targets). Discipline in adhering to these rules is key.
Risk Management Techniques
Always use stop-losses to limit potential losses on any given trade. Position sizing – determining how much capital to allocate to a single trade based on your risk tolerance – is equally important. A common rule is to risk no more than 1-2% of your trading capital per trade.
Backtesting and Refinement
Test your trading plan rigorously on historical data to assess its profitability and identify areas for improvement. Continuous refinement based on performance is vital for long-term success.
How to Start Analyzing the Indian Stock Market
- Educate Yourself: Start with the basics of financial markets, economic principles, and different analysis types. Utilize resources from NSE India, BSE India, and SEBI.
- Choose Your Tools: Select a reliable charting platform (like TradingView) and consider using specialized TradingView indicators that suit your analysis style. Explore options for a free trial.
- Learn Fundamental Analysis: Study company financial statements, understand economic drivers, and research sector trends relevant to India.
- Master Technical Analysis: Practice identifying chart patterns, using key indicators, and understanding support/resistance levels on historical data.
- Follow Market News: Stay updated with Indian and global economic news, policy changes, and corporate developments that can impact stock prices.
- Practice with Paper Trading: Before risking real capital, use a virtual trading account to test your analysis and trading strategies without financial loss.
- Develop a Trading Plan: Document your strategy, risk management rules, and entry/exit criteria.
- Start Small and Scale Up: Begin with a small amount of capital and gradually increase it as you gain confidence and prove your strategy’s efficacy.

Frequently Asked Questions
What is the most important factor for stock market analysis in India?
A combination of fundamental analysis (company health and economic outlook) and technical analysis (price action and patterns) is crucial, alongside understanding market sentiment and implementing strict risk management.
How often should I review my stock analysis?
For short-term traders, daily or intra-day reviews are common. For long-term investors, reviewing fundamental data quarterly and technicals weekly or monthly is usually sufficient, with ad-hoc reviews for significant news events.
Can a beginner effectively analyze the Indian stock market?
Yes, beginners can learn by focusing on foundational knowledge, utilizing educational resources from SEBI and exchanges, practicing with paper trading, and starting with simpler analysis techniques before progressing.
What is the role of SEBI in market analysis?
SEBI provides the regulatory framework that ensures fair market practices, transparency, and investor protection, which are essential for reliable market analysis. It also disseminates important circulars and data.
Which is better: Fundamental or Technical Analysis for NSE stocks?
Neither is definitively ‘better’; they serve different purposes. Fundamental analysis helps identify *what* to buy, while technical analysis helps determine *when* to buy or sell, making them complementary tools for comprehensive analysis.
How can I use TradingView indicators for analysis?
TradingView indicators can automate the identification of patterns, trends, and signals based on technical parameters. They help traders visualize data and make quicker, more informed decisions, often available with a free trial.
Key Takeaways
- Proactive analysis of Indian stocks requires integrating fundamental, technical, and sentiment-based approaches.
- Understanding macroeconomic factors and RBI policies is vital for assessing the broader Indian economic landscape.
- Technical indicators and chart patterns are powerful tools for timing trades in volatile markets like NSE and BSE.
- Robust risk management, including stop-losses and position sizing, is non-negotiable for preserving capital.
- Continuous learning, backtesting, and adapting strategies are essential for sustained success in trading.
- Utilizing advanced tools like TradingView indicators can enhance efficiency for both retail and institutional traders.
Disclaimer: Stock market investments are subject to market risks. Please read all related documents carefully before investing. Trading involves significant risk of loss and is not suitable for all investors.





 Finovatives