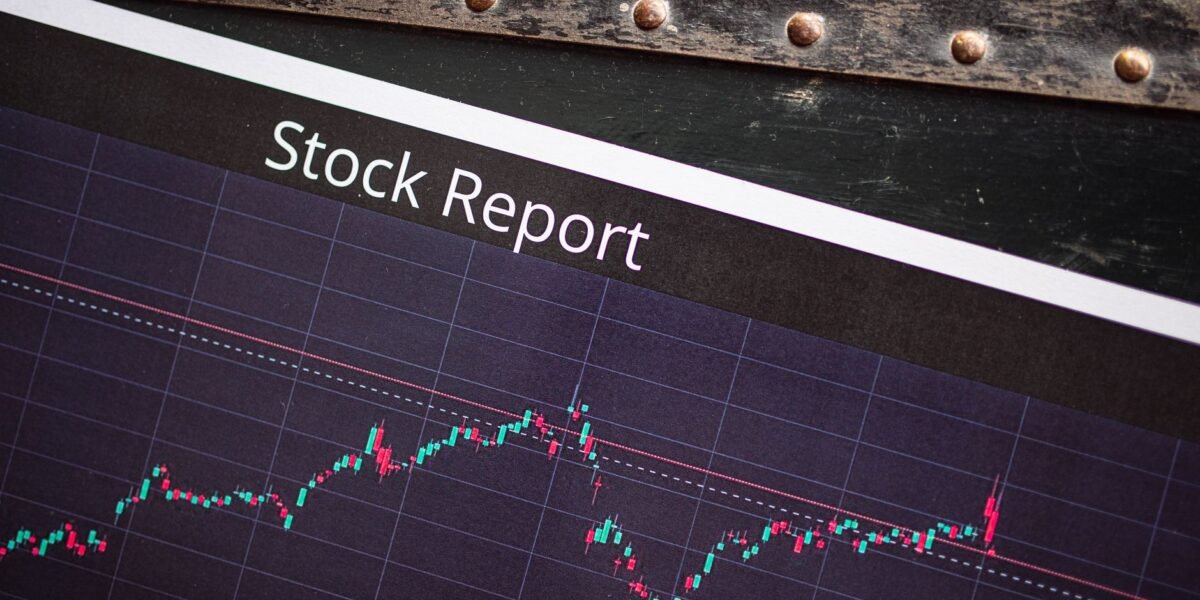
TL;DR: Fibonacci Retracement is a technical analysis method using key ratios derived from the Fibonacci sequence to predict potential support and resistance levels, helping Indian traders identify optimal entry and exit points in the NSE and BSE markets.
Key Stats at a Glance:
- Nifty 50’s average daily trading volume: ₹10,000+ Crore (approx.)
- BSE Sensex constituents: 30 large-cap stocks
- Fibonacci ratios most commonly used: 23.6%, 38.2%, 50%, 61.8%, 78.6%
- Over 70% of retail investors in India use technical analysis in their trading strategies.
- The Fibonacci sequence starts 0, 1, 1, 2, 3, 5, 8, 13, 21, 34…
What is Fibonacci Retracement?
Fibonacci Retracement is a charting technique used by traders to identify potential reversal points in a stock’s price by applying specific Fibonacci ratios to price charts.
The concept originates from the mathematical sequence identified by Leonardo Fibonacci, where each number is the sum of the two preceding ones. In trading, these numbers are used to create horizontal lines on a price chart, indicating areas where the price is likely to pause or reverse after a significant move. These levels are believed to act as support or resistance zones. The primary ratios used are 23.6%, 38.2%, 50%, 61.8%, and 78.6%, derived from relationships within the sequence. For Indian traders, this tool is invaluable for navigating the volatility of the NSE and BSE.
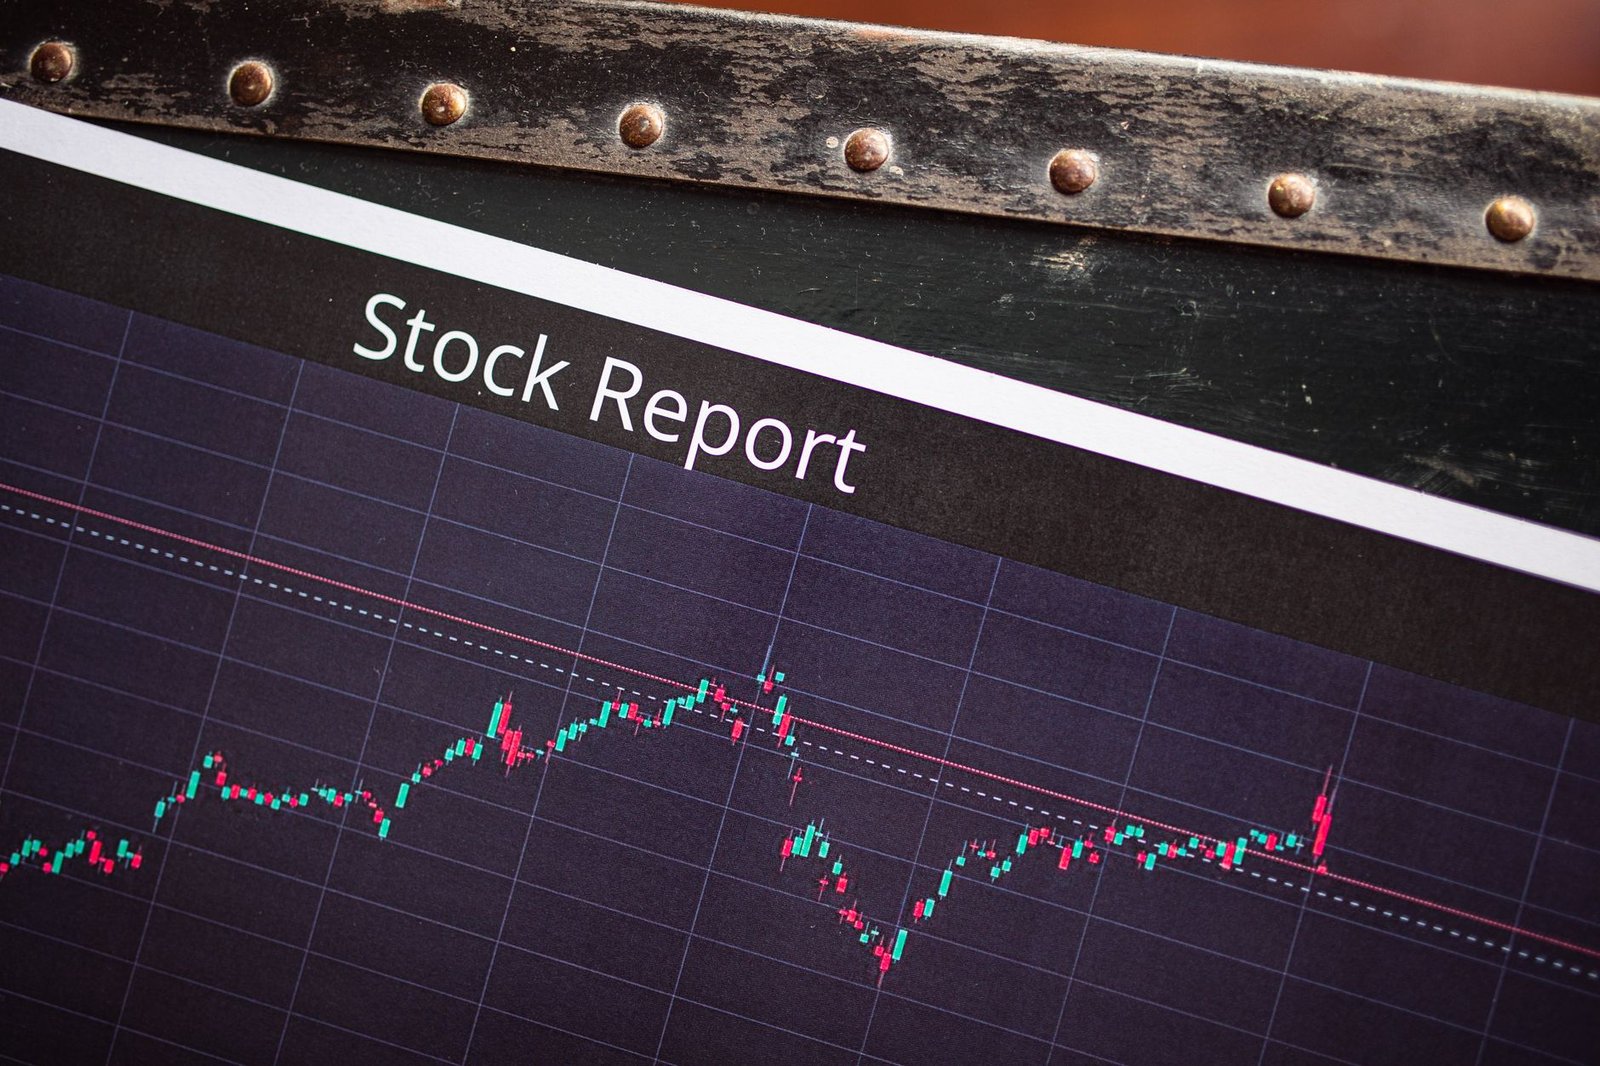
Understanding the sequence is crucial: 0, 1, 1, 2, 3, 5, 8, 13, 21, 34, 55, 89, 144… When you divide a number by the number preceding it, you approach the Golden Ratio (approximately 1.618). Conversely, dividing a number by the number following it approaches 0.618. Key retracement levels like 38.2% and 61.8% are derived from these ratios.
How Does Fibonacci Retracement Work in Indian Markets?
Fibonacci Retracement works by identifying potential support and resistance levels based on the percentage retracement of a prior price move, using key Fibonacci ratios.
When a stock experiences a significant price move (either up or down), traders anticipate a temporary pullback or retracement before the trend resumes. Fibonacci retracement levels act as potential areas where this retracement might end and the original trend could continue. For instance, after a strong uptrend, a stock might pull back to a Fibonacci support level (like 38.2% or 61.8%) before resuming its upward trajectory. Conversely, in a downtrend, these levels can act as resistance. Indian traders often use these levels on charts of Nifty 50, Bank Nifty, and individual stocks listed on NSE and BSE to time their entries and exits, aiming to buy dips in an uptrend or sell rallies in a downtrend. This method relies on the psychological aspect of markets, where many participants recognise and react to these key levels.
Identifying the Swing High and Swing Low
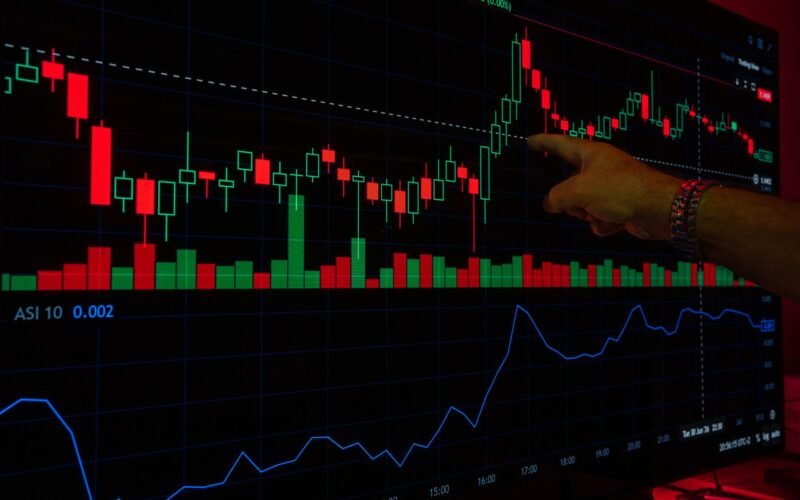
The first step is to identify a significant price swing, which is the movement from a low point (swing low) to a high point (swing high) in an uptrend, or vice versa in a downtrend. The Fibonacci retracement tool is then applied between these two points.
Applying the Fibonacci Ratios
Once the swing high and low are identified, the charting software or manual calculation draws horizontal lines at the standard Fibonacci retracement percentages (23.6%, 38.2%, 50%, 61.8%, 78.6%) between the swing low and swing high. The 50% level, while not a true Fibonacci ratio, is widely used as it represents a halfway retracement. These lines represent potential support or resistance areas.
Interpreting the Levels
Traders watch these levels closely. If the price pulls back to a retracement level and shows signs of reversing (e.g., forming a bullish candlestick pattern at a support level), it might present a buying opportunity. If the price rallies to a resistance level and shows signs of stalling (e.g., forming a bearish candlestick pattern), it could be an opportunity to sell or take profits. The effectiveness of these levels can be enhanced when they coincide with other technical indicators or chart patterns, a concept known as ‘confluence’.
How to Use Fibonacci Retracement in Trading
To effectively use Fibonacci Retracement in your trading strategy, follow these practical steps:
- Identify a Clear Trend: First, determine if the market or stock is in a discernible uptrend or downtrend. Fibonacci works best in trending markets.
- Mark the Swing High and Swing Low: On your chart, identify the most recent significant price peak (swing high) and trough (swing low) within that trend.
- Select the Fibonacci Retracement Tool: Use the tool available in your charting platform (like TradingView, which is popular among Indian traders) or draw the levels manually.
- Apply the Tool: Click on the swing low and drag to the swing high in an uptrend (or vice versa in a downtrend) to draw the retracement levels.
- Observe Price Action at Levels: Watch how the price behaves when it reaches these horizontal lines. Look for confirmation signals like candlestick patterns (e.g., hammer, engulfing patterns) or increased volume.
- Identify Entry/Exit Points: Consider entering a trade when the price bounces off a Fibonacci support level in an uptrend, or sells off from a Fibonacci resistance level in a downtrend, provided you see confirmation. Set stop-losses below support or above resistance.
- Set Profit Targets: Fibonacci Extension levels (beyond 100%) can be used as potential profit targets, or you can target previous swing highs/lows or other technical levels.
- Combine with Other Indicators: For higher probability trades, use Fibonacci levels in conjunction with other technical indicators such as Moving Averages, RSI, or MACD, or chart patterns like trendlines and support/resistance zones. This enhances the reliability of the signals.
What are the Key Fibonacci Ratios for Traders?
The most commonly used Fibonacci retracement ratios are derived from the mathematical sequence and represent potential areas of support or resistance.
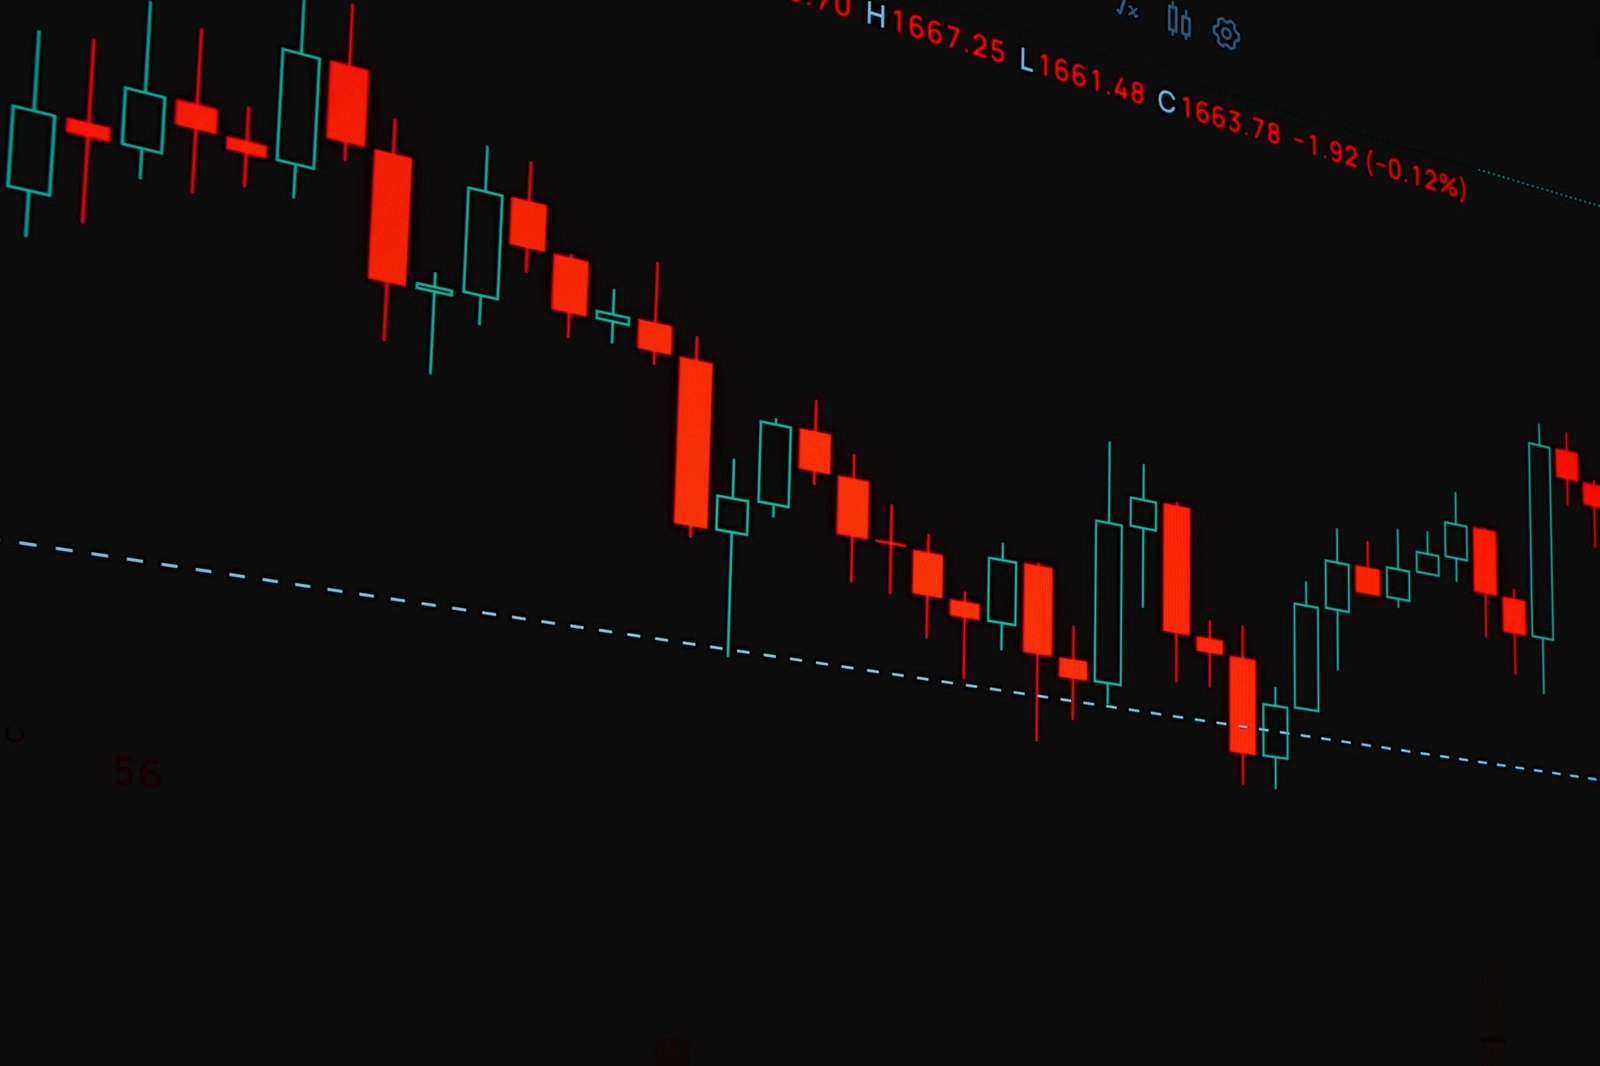
The primary Fibonacci ratios used in technical analysis are 23.6%, 38.2%, 50%, 61.8%, and 78.6%. The 38.2% and 61.8% levels are considered particularly significant, often referred to as the ‘Golden Retracement’. The 61.8% level, derived from dividing a number by the next higher number in the sequence (e.g., 34/55 ≈ 0.618), is thought to represent a point where a significant portion of the prior move has been retraced. The 50% level, while not technically a Fibonacci ratio, is included because traders often view a 50% retracement as a significant psychological and technical level. Levels like 23.6% and 78.6% are also watched, especially after strong initial moves. These ratios help traders anticipate where a price correction might find support or resistance.
Fibonacci Extensions
Beyond retracement levels (which go up to 100% of the prior move), traders also use Fibonacci Extensions. These project potential price targets beyond the previous swing high or low, using ratios like 127.2%, 161.8%, and 261.8%. They are useful for setting profit targets in the direction of the prevailing trend.
Limitations of Fibonacci Retracement
While Fibonacci Retracement is a widely used and often effective tool, it is essential for Indian traders to be aware of its limitations and not rely on it exclusively.
One significant limitation is that Fibonacci levels are subjective; their effectiveness depends heavily on the trader’s ability to accurately identify the correct swing high and swing low points. What one trader considers a significant swing, another might not. Furthermore, Fibonacci levels are not infallible predictors of price movement; prices can and do break through these levels frequently, especially in highly volatile markets or during major news events. The tool is most effective in clearly trending markets and can generate false signals in sideways or choppy markets. Relying solely on Fibonacci without considering other technical indicators, fundamental analysis, or risk management can lead to poor trading decisions. It’s often best used as part of a broader trading strategy. For instance, integrating a robust TradingView indicator that combines Fibonacci with other momentum oscillators can provide more reliable signals.
Frequently Asked Questions
What is the most important Fibonacci retracement level?
The 61.8% retracement level, often called the ‘Golden Ratio’, is widely considered the most significant. The 38.2% level is also highly regarded. However, all levels (23.6%, 50%, 78.6%) can act as support or resistance depending on market conditions.
Can Fibonacci Retracement be used on any timeframe?
Yes, Fibonacci Retracement can be applied to any timeframe, from intraday charts (minutes, hours) to daily, weekly, or even monthly charts. Its effectiveness often correlates with the strength and clarity of the trend on that specific timeframe.
Does Fibonacci Retracement work in sideways markets?
Fibonacci Retracement is most effective in trending markets. In sideways or range-bound markets, it tends to generate more false signals as prices may oscillate between levels without establishing a clear trend continuation or reversal.
How can I confirm Fibonacci signals?
Confirm signals by looking for confluence with other technical indicators (like Moving Averages, RSI, MACD), price action (candlestick patterns), or chart patterns (trendlines, support/resistance zones). High trading volume at a Fibonacci level can also add confirmation.
Is Fibonacci Retracement better than other technical indicators?
Fibonacci Retracement is not inherently ‘better’ but serves a different purpose. It excels at identifying potential support/resistance zones based on price symmetry. It’s most powerful when used in combination with other indicators that measure momentum, trend strength, or volatility, offering a more comprehensive analysis.
Key Takeaways
- Fibonacci Retracement uses ratios derived from the Fibonacci sequence (23.6%, 38.2%, 50%, 61.8%, 78.6%) to identify potential support and resistance levels.
- It is applied by drawing lines between a significant price swing high and swing low.
- The tool is most effective in clearly trending markets on the NSE and BSE.
- Confirmation signals from other technical indicators or price action are crucial for successful trading.
- While powerful, Fibonacci Retracement has limitations and should not be used in isolation; robust risk management is essential.
- Understanding these levels helps traders make more informed decisions about entry, exit, and stop-loss placement.
- Consider exploring advanced tools like a comprehensive TradingView indicator to integrate Fibonacci levels with other analyses for enhanced decision-making.
Disclaimer: All stock market investments are subject to market risks. Read all related documents carefully before investing. Past performance is not indicative of future results.

 Finovatives