TL;DR: Analyzing the Indian stock market like a pro involves a dual approach: mastering technical analysis to predict price movements using charts and indicators, and understanding fundamental analysis to assess a company’s intrinsic value and economic health.
Key Stats at a Glance:
- Nifty 50’s average annual return (2014-2023): Approximately 12.1%
- BSE Sensex’s 5-year CAGR (as of early 2024): ~14.5%
- Number of listed companies on NSE: Over 2,000
- Number of listed companies on BSE: Over 5,000
- Average daily turnover on Indian stock exchanges (FY 2023-24): ₹80,000+ Crore
What is Stock Market Analysis?
Stock market analysis is the process of evaluating securities and deciding whether to buy, sell, or hold them, aiming to identify investment opportunities and manage risk.
The Two Pillars: Technical and Fundamental Analysis
Professional traders and investors typically employ two primary methodologies to dissect the stock market: technical analysis and fundamental analysis. While often presented as opposing viewpoints, the most effective approach usually integrates insights from both to form a comprehensive market view.
Technical analysis focuses on historical price action and volume data, believing that all relevant information is already reflected in the price. It utilizes charts, patterns, and indicators to forecast future price movements. Fundamental analysis, on the other hand, dives deep into a company’s financial health, management quality, industry trends, and overall economic conditions to determine its intrinsic value.

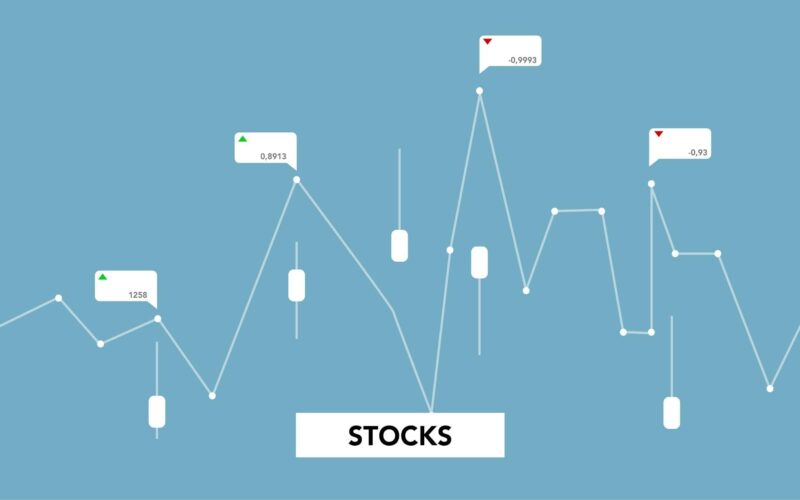
Technical Analysis: Reading the Charts
Technical analysis is the study of past market data, primarily price and volume, to forecast future price movements. Technical analysts believe that market trends are repeatable and that price movements are not random but follow discernible patterns.
Core Concepts in Technical Analysis
At its heart, technical analysis is built on three core assumptions:
- The market discounts everything: All known information, including economic, political, company-specific, and psychological factors, is already factored into the stock price.
- Prices move in trends: Prices tend to move in trends, and historical trends are likely to continue.
- History tends to repeat itself: Market psychology remains relatively constant, leading to recurring chart patterns.
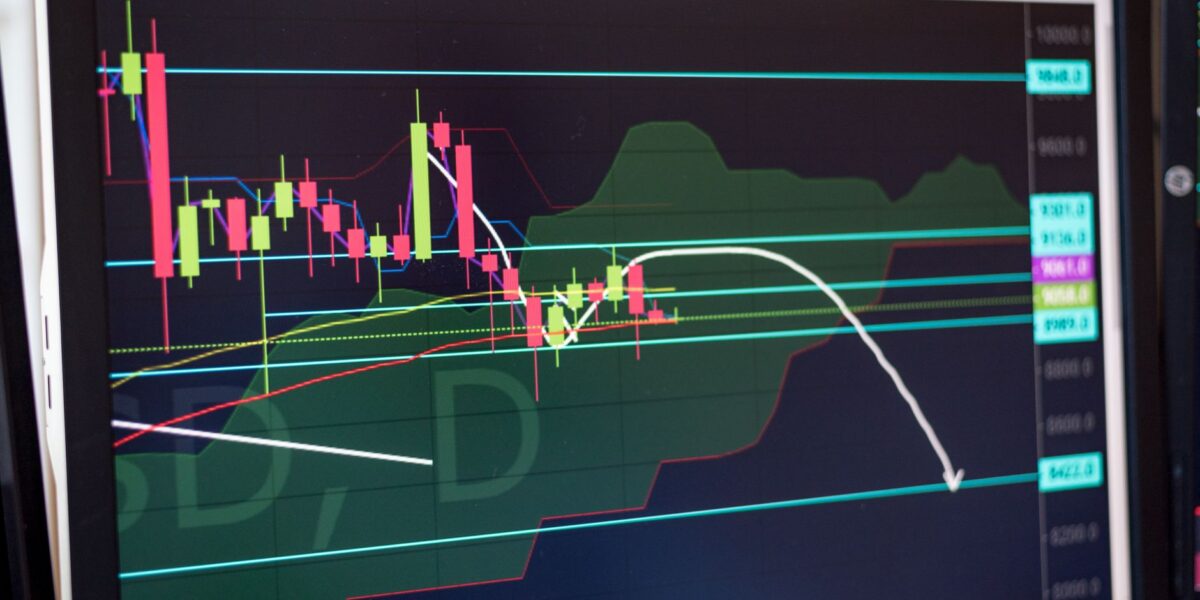
Common Technical Analysis Tools
Technical analysts use a variety of tools to identify potential trading opportunities:
- Chart Patterns: Recognizable formations on price charts, such as head and shoulders, triangles, flags, and pennants, which can indicate potential trend reversals or continuations.
- Candlestick Patterns: Specific candlestick formations that provide insights into market sentiment and potential short-term price direction (e.g., Doji, Hammer, Engulfing patterns).
- Technical Indicators: Mathematical calculations based on price and/or volume data, used to gauge momentum, volatility, trend strength, and potential turning points. Popular indicators include Moving Averages (SMA, EMA), Relative Strength Index (RSI), MACD (Moving Average Convergence Divergence), and Bollinger Bands.
- Volume Analysis: Studying the number of shares traded during a specific period. High volume often confirms the strength of a price move, while low volume might suggest a lack of conviction.
Many traders find that integrating a robust TradingView indicator can significantly enhance their technical analysis, providing real-time signals and customisable insights.
How to Use Technical Indicators Effectively
- Understand the indicator’s purpose: Know what each indicator is designed to measure (e.g., momentum, trend, volatility).
- Combine indicators: Use multiple indicators that complement each other (e.g., a trend-following indicator with a momentum oscillator) to confirm signals.
- Identify overbought/oversold conditions: Use oscillators like RSI to spot potential reversals when prices have moved too far, too fast.
- Look for divergences: Spot when price action and indicator movement are out of sync, often signalling a potential trend change.
- Backtest and paper trade: Before risking real capital, test your strategy with historical data and practice with a paper trading account.
Fundamental Analysis: Valuing the Business
Fundamental analysis is a method of evaluating a security that involves assessing its intrinsic value by examining related economic, financial, and other qualitative and quantitative factors. The goal is to determine if the market price of a security is overvalued, undervalued, or fairly valued.
Key Components of Fundamental Analysis
Fundamental analysis involves looking at both macroeconomic factors and company-specific details:
- Macroeconomic Factors: This includes the overall health of the economy, interest rates, inflation, government policies, and industry trends. For instance, a growing economy with falling interest rates is generally favourable for the stock market.
- Company Financial Statements: Analysis of the balance sheet, income statement, and cash flow statement provides insights into a company’s profitability, liquidity, solvency, and efficiency. Key metrics include Earnings Per Share (EPS), Price-to-Earnings (P/E) ratio, Debt-to-Equity ratio, and Return on Equity (ROE).
- Management and Competitive Landscape: Evaluating the quality of the company’s management team, its competitive advantages (moat), market share, and the overall competitive environment.
- Industry Analysis: Understanding the growth prospects, regulatory environment, and competitive dynamics of the industry in which the company operates.
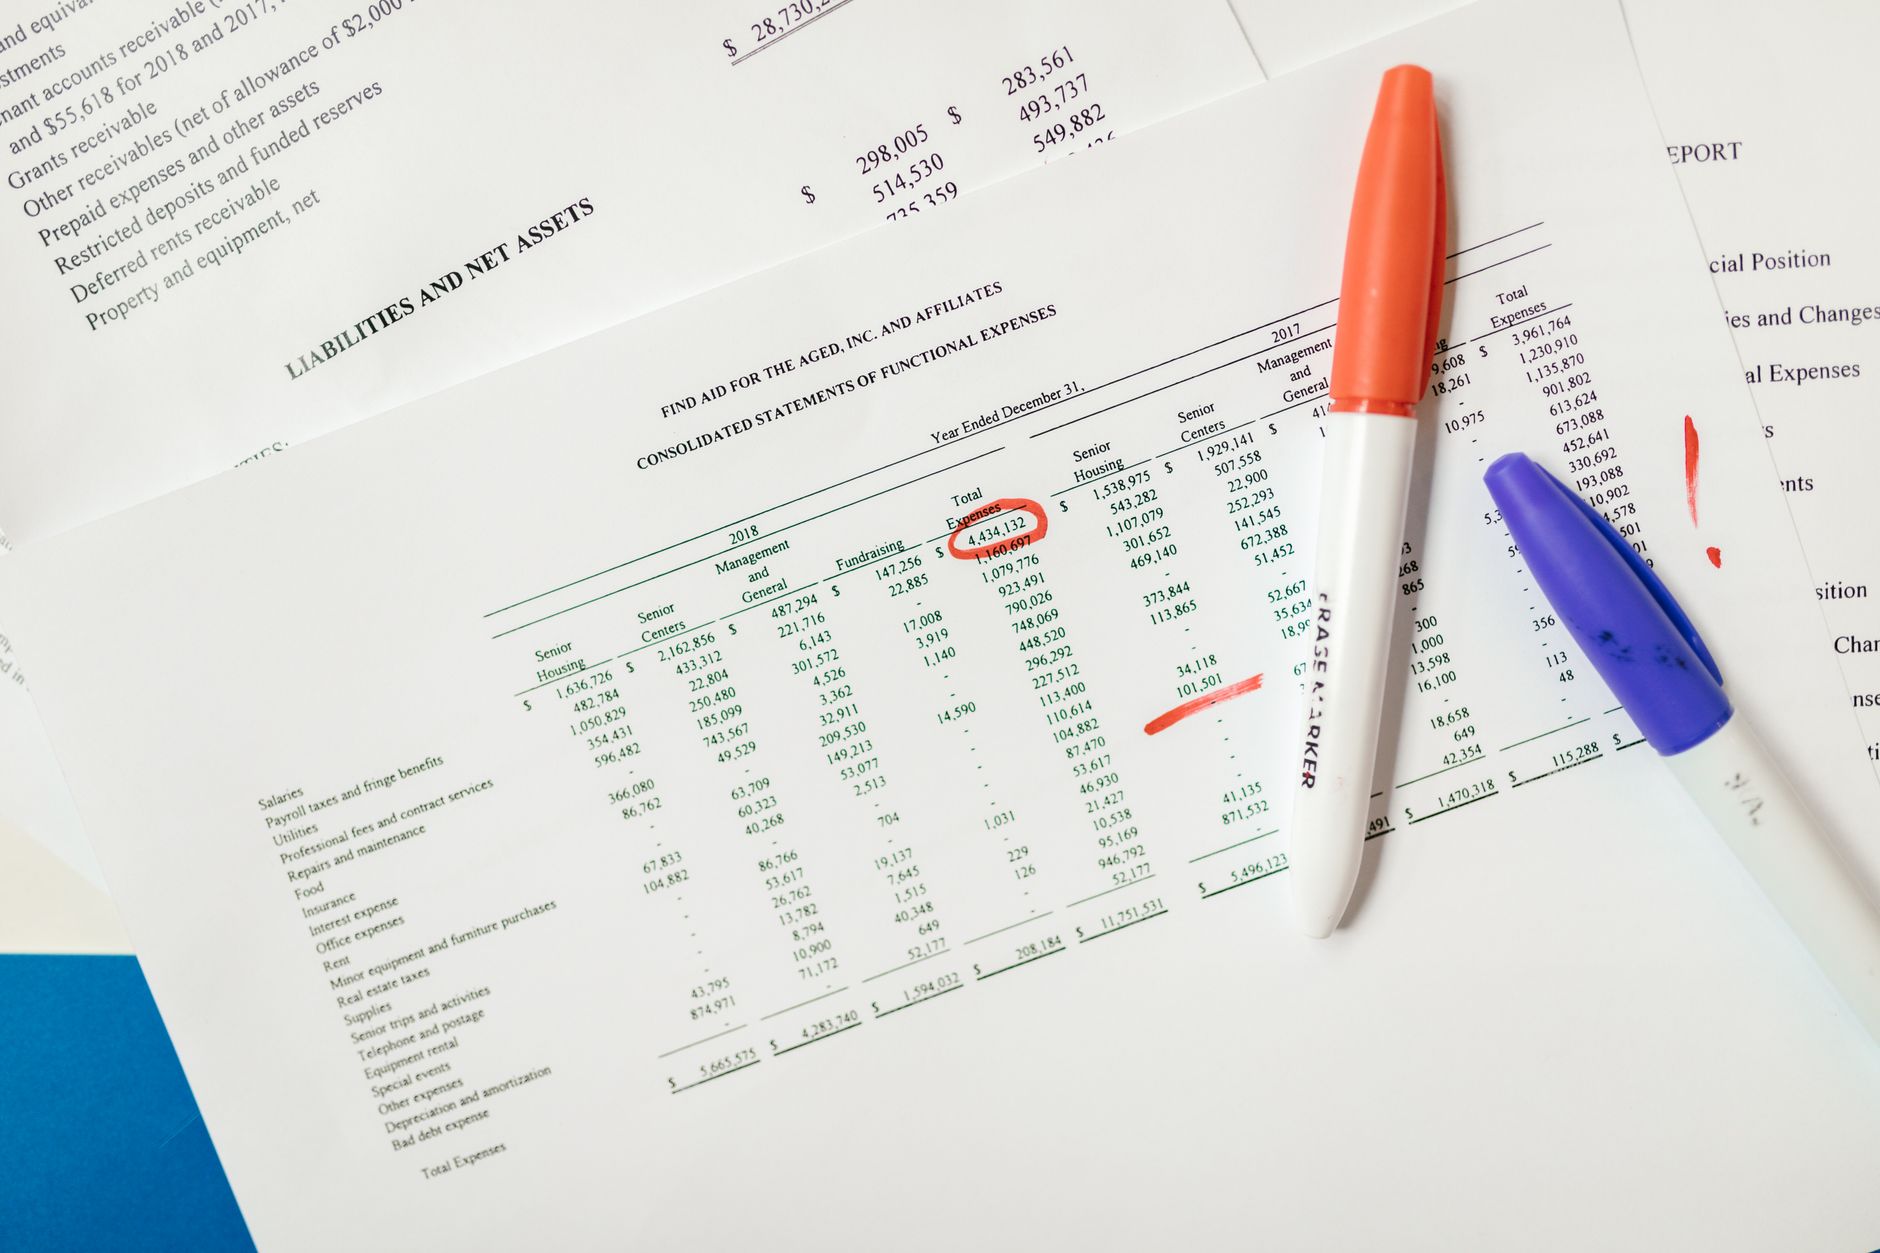
Interpreting Financial Ratios
Financial ratios are crucial for comparing companies within the same industry and for tracking a company’s performance over time. Some of the most important ratios include:
- Profitability Ratios: Net Profit Margin, Operating Profit Margin, ROE, ROA (Return on Assets). These measure a company’s ability to generate earnings.
- Valuation Ratios: P/E Ratio, Price-to-Book (P/B) Ratio, Dividend Yield. These help determine if a stock is fairly valued relative to its earnings, assets, or dividends.
- Liquidity Ratios: Current Ratio, Quick Ratio. These assess a company’s ability to meet its short-term obligations.
- Solvency Ratios: Debt-to-Equity Ratio, Interest Coverage Ratio. These measure a company’s long-term financial health and its ability to service debt.
Where to Find Fundamental Data
Reliable sources for fundamental data in India include:
- Company annual reports and quarterly results (available on NSE, BSE websites, and company investor relations pages).
- Financial news portals (e.g., The Economic Times, Livemint, Business Standard).
- Stock analysis websites and platforms that aggregate financial data.
- SEBI (Securities and Exchange Board of India) filings for regulatory disclosures.
Combining Technical and Fundamental Analysis
The synergy between technical and fundamental analysis offers a more robust approach to market analysis than relying on a single method. Fundamental analysis helps identify fundamentally sound companies trading at attractive valuations, while technical analysis can help pinpoint optimal entry and exit points for trades in those securities.
Finding the Right Entry and Exit Points
A trader might identify a strong company with solid earnings growth (fundamental analysis) but wait for a technical signal, such as a breakout above a resistance level or a bullish moving average crossover, before entering a long position. Conversely, if a stock price is showing signs of a potential downtrend (technical analysis), a fundamental analyst might review the company’s latest financial reports to see if there are any underlying business issues that justify the technical weakness.
Risk Management Strategies
No analysis is foolproof. Implementing strict risk management is paramount. This includes using stop-loss orders to limit potential losses on any single trade, diversifying your portfolio across different sectors and asset classes, and never investing more than you can afford to lose. Employing tools like the Trend Traders Tool can help in managing risk by identifying potential trend reversals early.

How to Analyze the Indian Stock Market: A Step-by-Step Approach
Here’s a practical guide to analyzing the Indian stock market like a pro:
- Define Your Investment Goals: Are you looking for short-term trading profits or long-term wealth creation? Your goals will dictate your analysis approach and time horizon.
- Choose Your Market Segment: Decide whether to focus on large-cap stocks (Nifty 50, Sensex components), mid-caps, small-caps, or specific sectors like IT, banking, or FMCG.
- Conduct Fundamental Analysis: Research potential companies by examining their financial statements, P/E ratios, debt levels, revenue growth, and management quality. Understand their business model and competitive advantages. Use resources like NSE and BSE filings.
- Perform Technical Analysis: Once you have a shortlist of fundamentally sound companies, use charting tools to analyze price trends, identify support and resistance levels, and look for bullish or bearish patterns. Utilize indicators like RSI and MACD.
- Consider Macroeconomic Factors: Stay updated on economic news, RBI policies, inflation rates, and global market trends that could impact your chosen stocks or the broader market.
- Develop a Trading Plan: Outline your entry and exit criteria, stop-loss levels, and profit targets before entering any trade. Stick to your plan disciplinedly.
- Backtest and Refine: Regularly review your past trades and analysis. Learn from mistakes and refine your strategies. Consider using a free trial of advanced tools to test new approaches.
Key Indian Stock Market Indices
Understanding major stock market indices is fundamental to grasping the overall market sentiment and performance.
Nifty 50 and BSE Sensex
The Nifty 50 is the benchmark index of the National Stock Exchange (NSE), comprising the top 50 Indian companies listed on the exchange based on market capitalisation and liquidity. It represents the overall health and direction of the Indian equity market.
The BSE Sensex is the benchmark index of the Bombay Stock Exchange (BSE), consisting of 30 large, well-established, and financially sound companies. It is one of the most tracked stock market indices in India and provides a snapshot of the country’s industrial performance.
Other Important Indices
Beyond the main benchmarks, India has numerous other indices that track specific market segments:
- Nifty Bank: Tracks the performance of the banking sector.
- Nifty IT: Focuses on the information technology sector.
- Nifty Midcap 100 / Smallcap 100: Provide insights into the performance of mid-sized and small-cap companies, respectively.
- India VIX: Often referred to as the ‘fear index’, it measures the expected volatility of the Nifty 50 index over the next 30 days. A higher VIX generally indicates increased market uncertainty.

Frequently Asked Questions
What is the most important factor in stock market analysis?
While there’s no single ‘most important’ factor, a combination of understanding a company’s intrinsic value (fundamental analysis) and its current market sentiment and price action (technical analysis) is crucial for informed decision-making.
Should I focus more on technical or fundamental analysis?
It depends on your trading style and goals. Long-term investors often prioritize fundamental analysis, while short-term traders may lean more heavily on technical analysis. Most successful market participants integrate both.
How can I start analyzing stocks with limited capital?
Start by learning the basics of fundamental and technical analysis. Utilize free resources, study company reports, and practice with paper trading. Focus on a few stocks you understand well and consider using affordable TradingView indicators or platforms offering fractional shares.
What is a P/E ratio and why is it important?
The Price-to-Earnings (P/E) ratio compares a company’s current share price to its earnings per share. It’s important as it helps investors gauge whether a stock is overvalued, undervalued, or fairly priced relative to its earnings potential.
How often should I review my stock analysis?
For long-term investments, quarterly reviews (aligning with financial results) are often sufficient. For active traders, daily or even intraday reviews might be necessary, depending on the strategy and market volatility.
Key Takeaways
- Professional stock market analysis combines technical analysis (charts, patterns, indicators) and fundamental analysis (company financials, economic factors).
- Technical analysis helps predict price movements based on historical data, while fundamental analysis assesses intrinsic value.
- Key technical tools include chart patterns, candlestick patterns, and indicators like RSI and MACD.
- Key fundamental aspects involve analyzing financial statements, ratios, management quality, and macroeconomic trends.
- Combining both methodologies provides a more comprehensive view and helps identify optimal entry/exit points.
- Risk management, including stop-losses and diversification, is critical for any trading strategy.
- Understanding major Indian indices like Nifty 50 and BSE Sensex is essential for market context.
Disclaimer: Stock market investments are subject to market risks. Please read all related documents carefully before investing. Past performance is not indicative of future results.