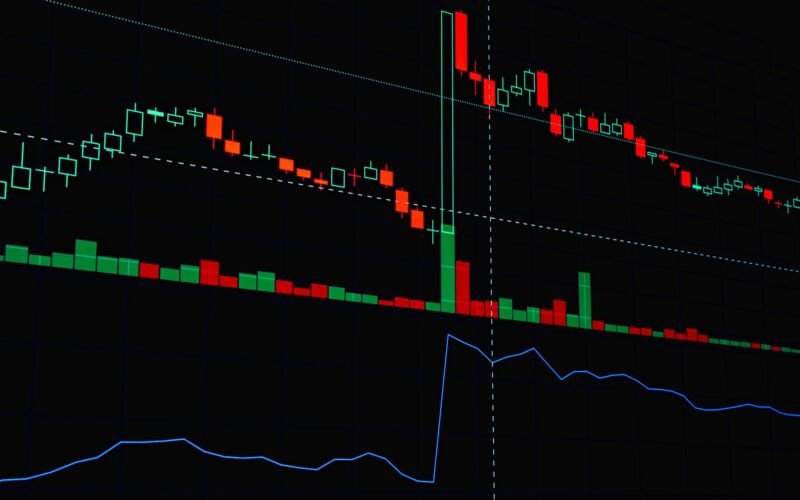
TL;DR: Positional trading aims to capture medium-term price movements (weeks to months) by holding stocks through identified trends, offering a sweet spot between short-term speculation and long-term investment. Success hinges on strong technical analysis, discipline, and effective risk management.
Key Stats at a Glance:
- Nifty 50 has delivered an average annual return of over 12% in the last decade.
- Over 4,000 companies are listed across NSE and BSE.
- Positional trades can aim for profit targets of 15-30% or more.
- Typical holding periods range from 2 weeks to 6 months.
- Stop-loss orders are crucial, often placed 5-10% below entry for positional trades.
What is Positional Trading?
Positional trading is a trading strategy that seeks to profit from medium-term price trends, typically holding positions for several weeks to several months. It’s a distinct approach from day trading (intraday) and long-term investing (years).

The Middle Ground Strategy
Positional traders don’t get bogged down by minor daily fluctuations; instead, they focus on the broader trend. They aim to capture the ‘middle’ part of a significant price move, entering a trade when a trend is established and exiting when it shows signs of reversing or exhausting. This approach requires patience and a keen eye for identifying sustained directional momentum, often leveraging tools like moving averages and trendlines.
Positional vs. Other Trading Styles
- Day Trading: Focuses on very short-term price swings within a single trading day. Profits are small per trade but can be numerous.
- Swing Trading: Typically holds positions for a few days to a couple of weeks, aiming to capture short-term price swings or ‘swings’.
- Positional Trading: Holds for weeks to months, capturing larger trend segments.
- Investing: Holds for years, focusing on fundamental value and long-term growth.
Why Choose Positional Trading?
Positional trading offers a compelling blend of potential for significant profit with reduced time commitment compared to day trading, while still being more active than long-term investing. It’s ideal for traders who can dedicate some time to analysis but cannot monitor the market constantly.
Capitalising on Major Trends
The Indian stock market, especially indices like the Nifty 50 and Bank Nifty, often exhibits clear medium-term trends. Positional traders are well-suited to identify and profit from these larger moves that might unfold over weeks or months, driven by economic news, sectoral performance, or corporate earnings cycles.
Balancing Time and Profit
Unlike day traders who need to be glued to their screens, positional traders can perform their analysis outside market hours. This makes it a more manageable strategy for individuals with other professional commitments. The goal is to extract substantial gains from fewer, well-timed trades, rather than accumulating small profits from many rapid transactions.
Reduced Transaction Costs
Holding positions for longer periods means fewer trades are executed compared to intraday or swing trading. This naturally leads to lower brokerage fees and other transaction charges, positively impacting the net profitability of the trading strategy.
Key Technical Indicators for Positional Trading
Effective positional trading relies heavily on technical analysis to identify entry and exit points. While a comprehensive suite of tools can be used, certain indicators are particularly effective for spotting medium-term trends.
Moving Averages
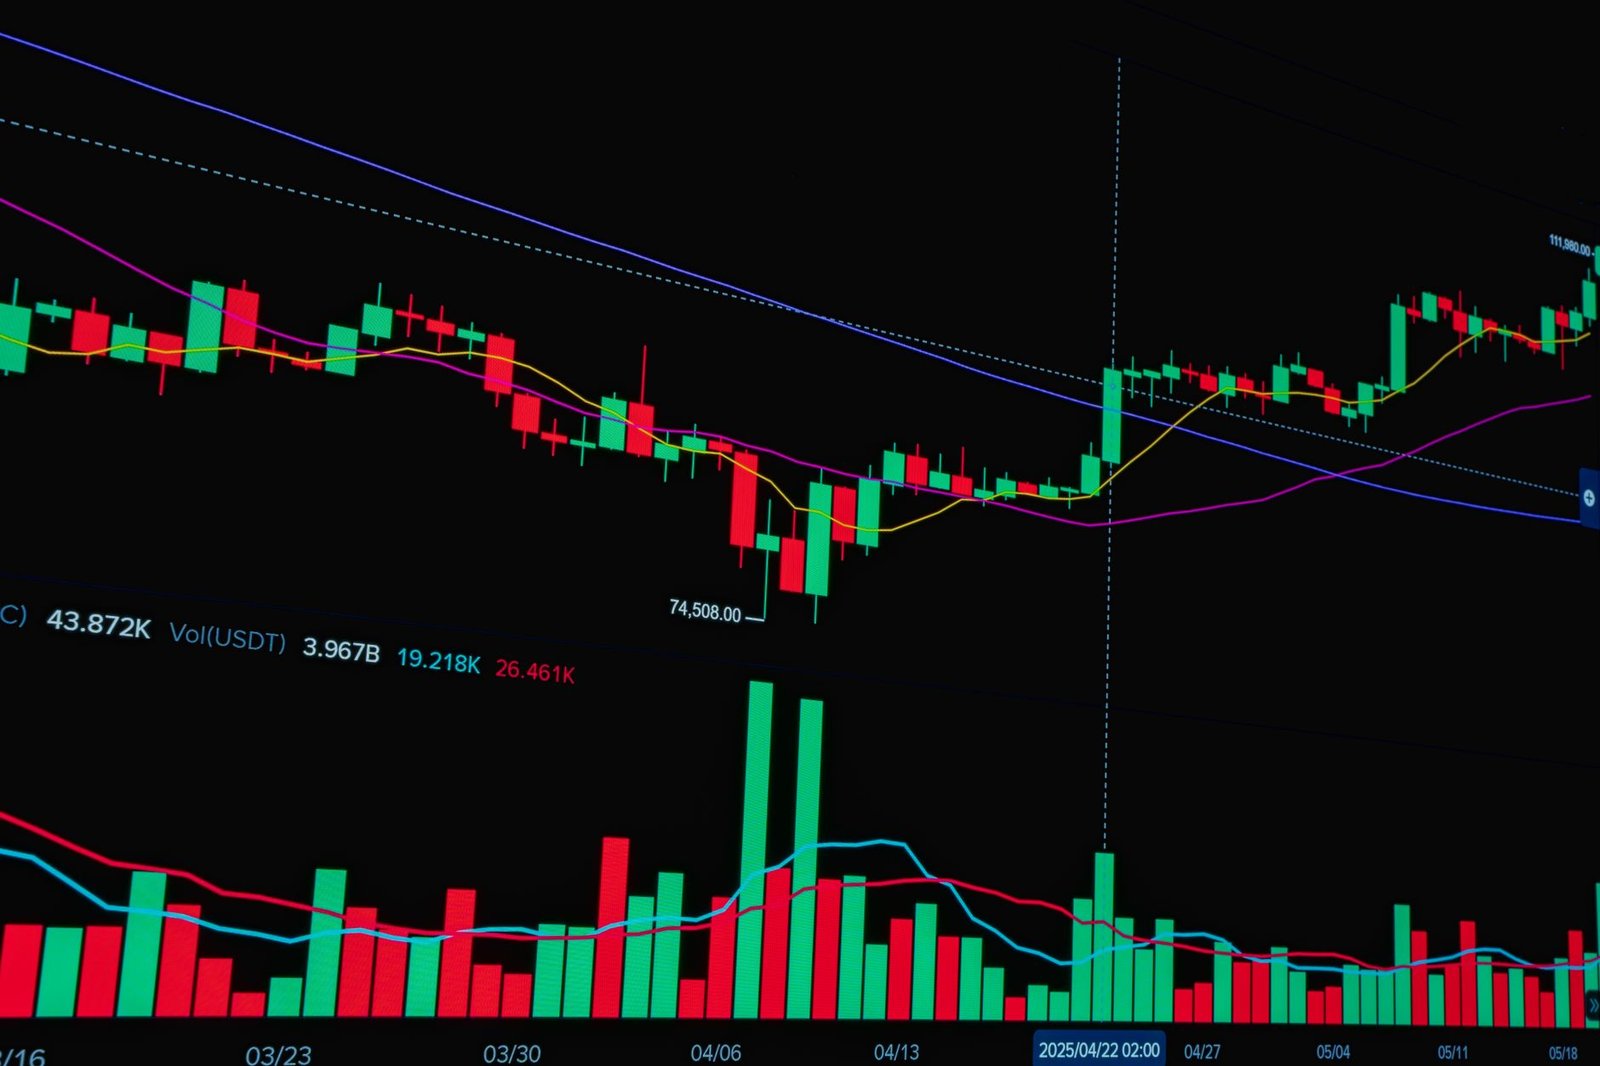
Moving averages (like the 50-day, 100-day, and 200-day Simple Moving Averages or Exponential Moving Averages) are fundamental. Traders look for crossovers (e.g., 50-day MA crossing above 200-day MA, a ‘golden cross’) or price trading above key MAs as signals of an uptrend. Conversely, trading below MAs, especially the 200-day MA, suggests a downtrend.
Trendlines and Channels
Drawing trendlines on price charts helps visualize the direction of the market. An upward-sloping trendline supports an uptrend, while a downward-sloping one indicates a downtrend. Price channels, formed by parallel trendlines, can help identify potential support and resistance levels within the trend.
Volume Analysis
Increasing volume accompanying a price move in the direction of the trend confirms its strength. A significant price increase on low volume might be a warning sign of a weak trend. Conversely, a decline in volume during a pullback in an uptrend can suggest that sellers are not aggressive.
Relative Strength Index (RSI)
While often used for short-term overbought/oversold signals, the RSI can also be used in positional trading to confirm trend strength. A sustained RSI above 50 generally indicates bullish momentum, while consistently below 50 suggests bearish momentum. Divergences between price and RSI can also signal potential trend reversals.
MACD (Moving Average Convergence Divergence)
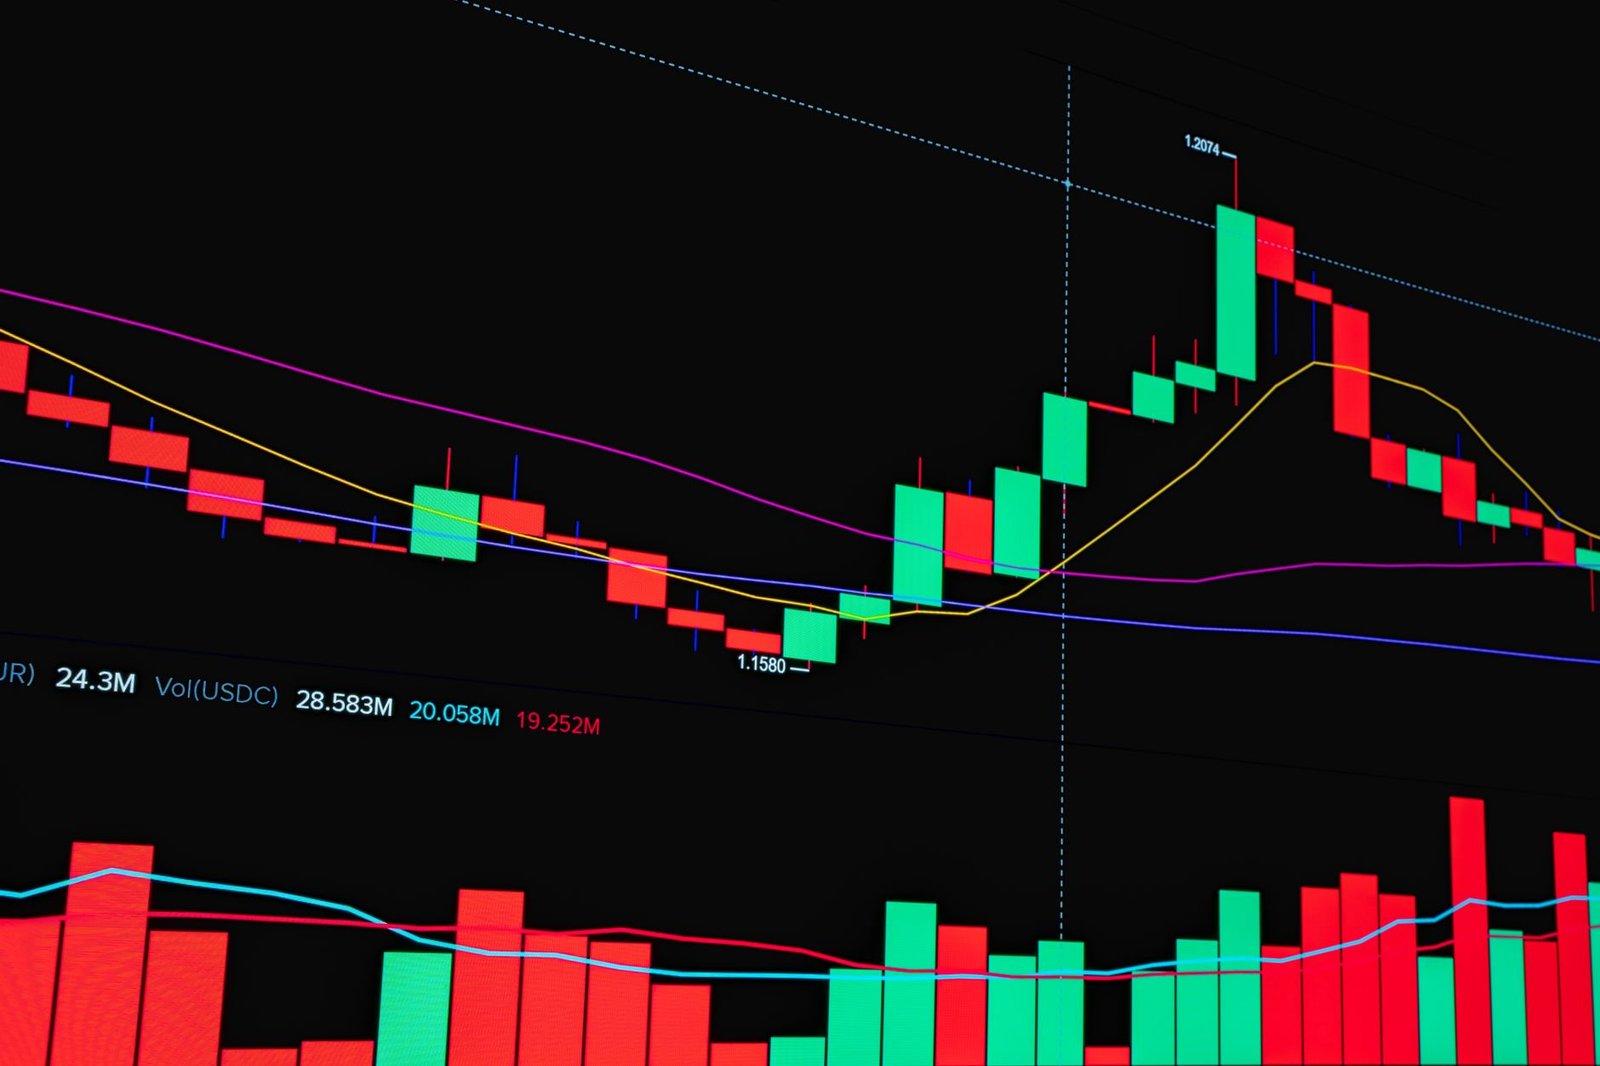
MACD can help identify trend direction and momentum. When the MACD line is above the signal line and both are rising, it indicates bullish momentum. A bearish signal occurs when the MACD line crosses below the signal line, especially below the zero line.
How to Implement a Positional Trading Strategy
Developing and executing a successful positional trading strategy requires a structured approach, combining analysis with disciplined trade management.
- Define Your Trading Objective: Determine your profit targets and maximum acceptable loss (risk tolerance) for each trade.
- Choose Your Timeframe: Focus on daily or weekly charts to identify medium-term trends, ignoring minor intraday noise.
- Select Stocks: Identify fundamentally sound stocks or those exhibiting strong trending behaviour using screeners or market observation.
- Identify Entry Signals: Use a combination of indicators (e.g., moving average crossovers, trendline breaks, bullish chart patterns) to pinpoint an optimal entry point.
- Set Stop-Loss Orders: Crucially, place a stop-loss order immediately after entering a trade to limit potential downside risk. This could be based on a technical level (e.g., below a support or a key moving average) or a percentage of your capital.
- Manage Your Position: As the trade moves in your favour, consider trailing your stop-loss to lock in profits. Avoid emotional decisions and stick to your trading plan.
- Determine Exit Strategy: Exit the trade when your profit target is reached, your trailing stop-loss is hit, or clear signs of a trend reversal appear (e.g., bearish chart patterns, breakdown of key support levels).
Risk Management is Paramount
Positional trading, like all trading, involves risk. A robust risk management plan is non-negotiable. This includes deciding how much capital to allocate per trade (e.g., 1-2% of total capital) and strictly adhering to stop-loss levels. Never risk more than you can afford to lose.
Utilising Advanced Tools
Traders can enhance their positional analysis by using sophisticated charting platforms and indicators. For instance, custom TradingView indicators can provide nuanced signals or automate parts of the analysis, helping to identify high-probability setups more efficiently. Platforms like Finovatives offer advanced tools designed for Indian market traders.

Common Mistakes to Avoid
Even with a sound strategy, positional traders can falter due to common pitfalls. Awareness and discipline are key to avoiding them.
Emotional Trading
Allowing fear or greed to dictate decisions is a primary reason for losses. Sticking rigidly to a pre-defined trading plan and stop-loss levels is essential to combat this.
Poor Risk Management
Not setting stop-losses or risking too much capital on a single trade can lead to devastating losses, potentially wiping out an account. As recommended by SEBI guidelines, prudent risk management is vital.
Ignoring Fundamentals
While primarily a technical strategy, completely ignoring the fundamental health of a company can be risky. A stock in a strong uptrend but facing severe financial distress might be prone to a sharp reversal.
Chasing the Market
Entering a trade late after a significant move has already occurred often leads to entering near a peak, increasing the risk of a reversal before substantial profit can be made.
Frequently Asked Questions
What is the ideal holding period for positional trading?
The ideal holding period typically ranges from a few weeks to several months, focusing on capturing the core part of a medium-term price trend.
Which chart timeframe is best for positional trading?
Daily and weekly charts are most commonly used for positional trading, as they help filter out short-term noise and focus on the broader trend.
Is positional trading suitable for beginners?
Yes, positional trading can be suitable for beginners who have a foundational understanding of technical analysis and risk management, as it requires less constant monitoring than day trading.
What is the biggest risk in positional trading?
The biggest risk is a sharp, unexpected reversal of the trend against your position, especially if stop-losses are not set or are too wide.
How much capital should I allocate per positional trade?
A conservative approach suggests allocating no more than 1-2% of your total trading capital per trade to manage risk effectively.
Can fundamental analysis be used in positional trading?
Yes, while primarily technical, fundamental analysis can be used to filter stocks and avoid trading companies with significant underlying financial issues.
Key Takeaways
- Positional trading targets medium-term trends (weeks to months) for significant profit potential.
- It strikes a balance between the frequency of day trading and the long-term perspective of investing.
- Key technical indicators include moving averages, trendlines, volume, RSI, and MACD.
- Strict adherence to risk management, especially stop-loss orders, is crucial for survival.
- Discipline and patience are vital to avoid emotional decisions and stick to the trading plan.
- Understanding common mistakes like emotional trading and poor risk management helps in long-term success.
- Advanced tools and indicators can enhance analysis and trade execution efficiency.
Trading involves substantial risk and may not be suitable for all investors. Ensure you understand the risks involved before trading.






 Finovatives