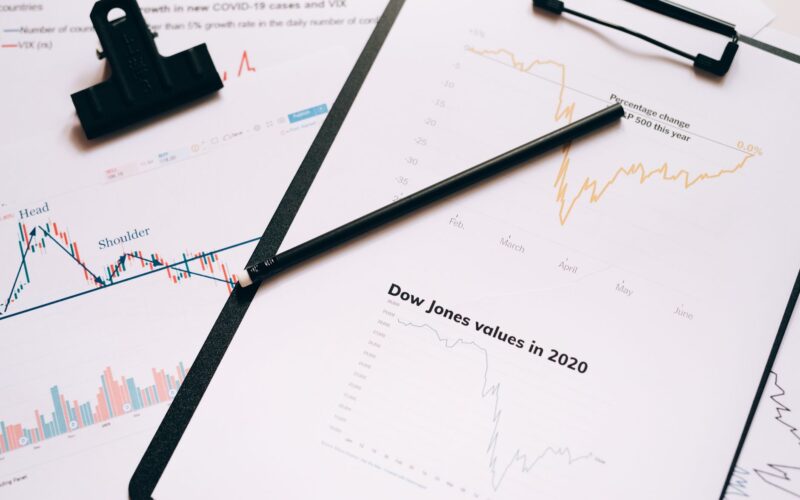
TL;DR: A breakout trading strategy involves entering a trade when the price of Nifty or Bank Nifty decisively moves beyond a significant support or resistance level, with the expectation of a sustained trend in that direction.
Key Stats at a Glance:
- Nifty 50’s average daily trading volume: Over ₹25,000 crore.
- Bank Nifty’s average daily trading volume: Over ₹15,000 crore.
- Implied Volatility (IV) of Nifty options often increases by 5-15% during major breakouts.
- NSE records over 4,000+ trading days annually.
- A well-executed breakout trade can yield 1:2 to 1:3 Risk-Reward Ratio.
What is a Breakout Trading Strategy?
A breakout trading strategy is a technical analysis approach where traders aim to profit from the significant price movement that occurs when an asset’s price moves out of a defined trading range, surpassing established support or resistance levels.
This strategy hinges on the principle that once a price breaks through a psychological barrier, momentum often builds, leading to a sustained move in the direction of the breakout. For Indian markets, particularly the highly liquid Nifty and Bank Nifty indices, identifying these breakouts can offer substantial trading opportunities. Traders use various tools, including chart patterns, volume analysis, and indicator signals, to confirm the validity of a breakout before entering a trade, thereby managing risk and increasing the probability of success.

Why is Breakout Trading Popular for Nifty and Bank Nifty?
Breakout trading is popular for Nifty and Bank Nifty due to their high liquidity, volatility, and tendency to form clear price patterns, offering traders frequent and potentially lucrative opportunities.
The Indian stock market, especially its benchmark indices like the Nifty 50 and the Bank Nifty, exhibits characteristics that make breakout strategies particularly attractive. These indices are traded heavily by both domestic and international institutional investors, as well as a vast number of retail participants, leading to significant price movements. Their high liquidity ensures that trades can be executed quickly and at competitive prices, which is crucial for breakout strategies that rely on timely entries and exits. Furthermore, the inherent volatility means that price ranges are often established, and subsequent breakouts can be sharp and fast, providing the momentum needed for profitable trades. The availability of derivatives like futures and options on these indices also allows traders to leverage breakout movements effectively, amplifying potential gains (and risks).
Identifying Support and Resistance Levels
Support and resistance levels are critical price points on a chart where a security’s price has historically struggled to fall below (support) or rise above (resistance).
These levels are identified by looking at historical price action. Support is typically found at previous lows or areas where the price has bounced multiple times. Resistance is found at previous highs or areas where the price has repeatedly reversed downwards. Horizontal lines drawn across these significant price points on a chart visually represent these levels. In the context of Nifty and Bank Nifty, these levels can be daily, weekly, or even monthly highs and lows, or psychological round numbers like 18,000 or 45,000. Traders use these levels to anticipate potential turning points or, in the case of breakout trading, the price levels that, if breached, signal a new trend.
Common Breakout Patterns
Common breakout patterns are chart formations that precede a significant price move, signalling a potential high-probability trading opportunity once the price breaches a key level.
These patterns help traders anticipate the direction and magnitude of a potential breakout. Some of the most frequently observed patterns in Nifty and Bank Nifty trading include:
- Ascending Triangles: Characterised by a flat resistance line and a rising trendline, often signalling a bullish breakout.
- Descending Triangles: Formed by a flat support line and a falling trendline, suggesting a bearish breakout.
- Symmetrical Triangles: Where converging trendlines indicate indecision, with a breakout likely in either direction.
- Rectangles (Range-bound trading): Prices move sideways between clear support and resistance levels, with a breakout expected when either level is decisively crossed.
- Flags and Pennants: Short-term continuation patterns that form after a sharp price move, indicating a brief pause before the trend resumes.
Recognising these patterns on Nifty and Bank Nifty charts allows traders to prepare for potential entries and set appropriate stop-loss levels.

Volume Confirmation for Breakouts
Volume confirmation is essential in breakout trading, as a significant increase in trading activity accompanying a price break lends credibility to the move.
A price moving beyond a key level on low volume might be a false signal, a ‘fakeout’, where the price quickly reverses. However, a breakout accompanied by a surge in trading volume, significantly higher than the average, suggests strong conviction from market participants. For Nifty and Bank Nifty, traders look for volume that is at least 1.5 to 2 times the average volume in the preceding period. This surge in volume indicates that many traders are participating in the move, increasing the likelihood that the breakout will lead to a sustained trend. Tools like TradingView indicators can help visualise volume patterns and alert traders to these crucial confirmations.
False Breakouts and How to Avoid Them
False breakouts, or ‘fakeouts’, occur when the price moves beyond a support or resistance level but then quickly reverses, trapping traders who entered based on the initial breakout signal.
Avoiding fakeouts is crucial for maintaining profitability in breakout trading. Strategies to mitigate this risk include:
- Waiting for Confirmation: Don’t trade the very first breach of a level; wait for a candle to close beyond the level or for subsequent price action to confirm the move.
- Volume Analysis: As mentioned, a breakout on low volume is more suspect than one on high volume.
- Multiple Timeframe Analysis: Check if the breakout is also visible on a higher timeframe (e.g., a daily breakout confirmed on a weekly chart).
- Using Indicators: Oscillators like RSI or MACD can sometimes show divergence, warning of a potential reversal.
- Tight Stop-Losses: Always place a stop-loss just below the breakout level (for a long breakout) or above it (for a short breakout) to limit losses if a fakeout occurs.
A disciplined approach, combining these techniques, significantly reduces the impact of false breakouts.
How to Implement a Breakout Trading Strategy for Nifty and Bank Nifty
Implementing a breakout trading strategy involves a systematic approach to identifying opportunities, managing risk, and executing trades effectively in the volatile Nifty and Bank Nifty markets.
This structured process ensures that traders approach the market with a clear plan, rather than making impulsive decisions. By defining entry points, setting risk parameters, and planning exit strategies, traders can increase their chances of success and navigate the complexities of index trading. The following steps outline a practical framework for employing breakout strategies.
- Identify Key Levels: On your chosen chart timeframe (e.g., 15-minute, 1-hour, daily), identify significant horizontal support and resistance levels or chart patterns (like triangles, rectangles). These are areas where the price has repeatedly failed to move beyond in the past.
- Wait for the Breakout: Monitor the price action as it approaches these key levels. Wait patiently for the price to decisively break through the resistance level (for a long trade) or fall below the support level (for a short trade).
- Seek Confirmation: Look for confirmation signals before entering the trade. This could be a significant increase in trading volume accompanying the price move, or a candlestick closing decisively beyond the breakout level. Avoid entering on the first tick or on very low volume.
- Enter the Trade: Once confirmation is received, enter the trade in the direction of the breakout. For a bullish breakout (above resistance), place a buy order. For a bearish breakout (below support), place a sell order.
- Set a Stop-Loss Order: Immediately place a stop-loss order to protect your capital. For a bullish breakout, place the stop-loss just below the broken resistance level, which now acts as support. For a bearish breakout, place the stop-loss just above the broken support level, which now acts as resistance.
- Determine Profit Targets: Set realistic profit targets. This can be done using previous price swing highs/lows, Fibonacci extension levels, or by setting a target that offers a favourable risk-reward ratio (e.g., 1:2 or 1:3). Alternatively, you can use trailing stop-losses to capture larger moves.
- Review and Adjust: After the trade, review your performance. Analyse what worked well and what could be improved. Adjust your strategy based on your learnings and market conditions. For instance, understanding volatility with tools like the Trend Traders Tool can help refine entry and exit points.

Risk Management in Breakout Trading
Effective risk management is paramount in breakout trading, as it involves protecting capital from volatility and false signals, ensuring long-term survival in the markets.
The volatile nature of Nifty and Bank Nifty means that even well-planned breakout trades can go against you. Therefore, implementing robust risk management techniques is not optional but essential. The cornerstone of this is the stop-loss order, which automatically exits a losing trade at a pre-determined price, limiting potential losses to a pre-defined percentage of your capital per trade (often recommended at 1-2%). Position sizing is another critical element; it involves calculating the number of lots to trade based on your stop-loss distance and your risk capital, ensuring that no single trade can wipe out a significant portion of your account. Diversification, though less applicable to trading single indices, can mean not over-allocating capital to a single strategy or market event. Continuous monitoring of open positions and adherence to the trading plan, even during emotional market swings, are vital. For traders using advanced tools, setting alerts for stop-loss levels or profit targets can be automated.
Frequently Asked Questions
What is the best timeframe for breakout trading Nifty and Bank Nifty?
The best timeframe depends on your trading style. Shorter timeframes like 15-minute or 1-hour charts offer more frequent opportunities but also more noise and false signals. Longer timeframes like daily or weekly charts provide more reliable signals but fewer trading chances. Consistency in your chosen timeframe is key.
How do I identify a strong breakout?
A strong breakout is typically confirmed by a significant increase in trading volume, price closing decisively beyond the key level, and potentially the breakout being supported by other technical indicators or occurring on multiple timeframes. Look for conviction in the price move.
Can I use breakout strategies for options trading on Nifty and Bank Nifty?
Yes, breakout strategies are highly effective for options trading. Traders often buy call options on bullish breakouts above resistance and put options on bearish breakouts below support, leveraging the potential for sharp price moves. However, options trading involves higher risk due to time decay and leverage.
What is a ‘fakeout’ in breakout trading?
A ‘fakeout’ is a false signal where the price briefly moves beyond a support or resistance level, prompting traders to enter a trade, only for the price to quickly reverse direction. This traps traders on the wrong side of the market and results in losses.
How important is news and events for breakout trading?
Major economic news or policy announcements can trigger significant breakouts or cause existing ones to fail. While technicals guide the strategy, being aware of upcoming events that could impact Nifty and Bank Nifty volatility is crucial for anticipating unpredictable price swings.
What is the role of ‘open interest’ in breakout trading for derivatives?
For Nifty and Bank Nifty futures and options, open interest (OI) can offer clues about market sentiment and the conviction behind a move. A rising OI accompanying a breakout suggests increasing participation and potential for trend continuation, while falling OI might signal weakening momentum.
Key Takeaways
- Breakout trading capitalizes on decisive price movements beyond support or resistance levels in Nifty and Bank Nifty.
- Accurate identification of support/resistance and common chart patterns is fundamental.
- Volume confirmation is crucial; a breakout on high volume is more reliable.
- Always implement risk management, including stop-losses and proper position sizing.
- Be aware of and have strategies to mitigate false breakouts.
- Breakout strategies can be adapted for both futures and options trading on indices.
- Continuous learning and review are essential for refining your breakout trading approach.
Trading in financial markets involves inherent risks, and past performance is not indicative of future results. Always conduct your own research and consult with a qualified financial advisor before making any investment decisions.






 Finovatives