TL;DR: Moving average crossover strategies involve using two or more moving averages of different periods to generate buy and sell signals when shorter-term averages cross above or below longer-term ones, helping Indian traders identify potential trend changes.
Key Stats at a Glance:
- Nifty 50’s historical average daily volatility: Approx. 0.8%
- Number of listed companies on BSE: Over 5,000
- Average lookback period for common MAs: 10, 20, 50, 100, 200 days
- SEBI’s regulatory framework ensures market integrity for all traders
- Majority of Indian retail traders use mobile devices for market access
What is a Moving Average Crossover Strategy?
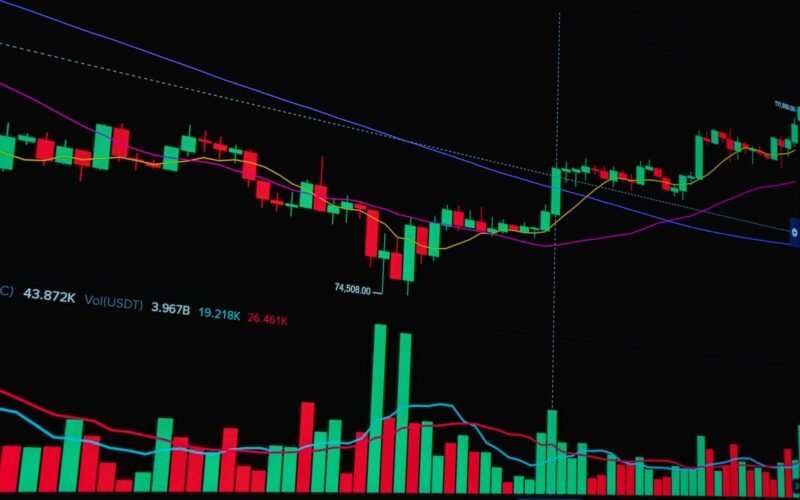
A moving average crossover strategy is a technical analysis technique that signals potential buying or selling opportunities when two or more moving averages (MAs) on a price chart intersect. It’s widely used by Indian traders to identify changes in trend direction.
This strategy relies on the principle that a shorter-term moving average crossing above a longer-term moving average suggests an upward momentum and a potential buy signal, while a shorter-term average crossing below a longer-term average indicates downward momentum and a potential sell signal. These signals are often used in conjunction with other technical indicators to confirm trades.
How Do Moving Averages Work?
Moving averages smooth out price data to create a single flowing line, making it easier to identify the direction of a trend and filter out market noise. They are calculated by taking the average closing price of a security over a specific number of periods (e.g., 10 days, 50 days, 200 days). The ‘moving’ aspect comes from the fact that as new price data becomes available, the oldest data point is dropped, and the average is recalculated, causing the MA line to ‘move’ with the price.
Types of Moving Averages
While the Simple Moving Average (SMA) is the most basic, traders also use the Exponential Moving Average (EMA), which gives more weight to recent prices, making it more responsive to current price changes. Other variations include the Weighted Moving Average (WMA).
Choosing the Right Periods
The choice of periods for the moving averages is crucial. Shorter periods (e.g., 10-day, 20-day) react faster to price changes and are good for capturing short-term trends, but can generate more false signals. Longer periods (e.g., 50-day, 200-day) are slower but provide a clearer picture of the long-term trend and generate fewer false signals. Most traders use a combination, like a 20-day and 50-day MA, or a 50-day and 200-day MA.
What are the Popular Moving Average Crossover Strategies?
Popular moving average crossover strategies in India typically involve combinations of short-term and long-term MAs to generate actionable trading signals.

The Golden Cross
The Golden Cross is considered a bullish signal, occurring when a shorter-term moving average crosses above a longer-term moving average. A common combination is the 50-day SMA crossing above the 200-day SMA. This is often interpreted as a sign of a significant upward trend developing, and traders may consider entering long positions.
The Death Cross
The Death Cross is the inverse of the Golden Cross and is considered a bearish signal. It happens when a shorter-term moving average crosses below a longer-term moving average, such as the 50-day SMA falling below the 200-day SMA. This suggests a potential downtrend, prompting traders to consider exiting long positions or initiating short positions.
Short-Term Crossovers
Many traders also employ faster, short-term crossover strategies using MAs like the 10-day and 20-day averages. These crossovers can provide earlier signals for potential trend shifts but are also prone to more whipsaws (false signals) in choppy markets. These are often used for intra-day or swing trading.
How to Implement a Moving Average Crossover Strategy?
Implementing a moving average crossover strategy involves several practical steps to ensure it aligns with your trading objectives and risk tolerance.
- Choose a Trading Platform: Select a reliable trading platform that offers charting tools and the ability to plot multiple moving averages, such as those integrated with TradingView indicators.
- Select Your Stocks: Identify Indian stocks (NSE/BSE) that exhibit clear trends and have sufficient trading volume. Avoid highly volatile or thinly traded stocks for this strategy.
- Determine MA Periods: Decide on the periods for your moving averages. A common starting point is a 20-period and 50-period SMA or EMA combination for shorter-term signals, or a 50-period and 200-period combination for longer-term trends.
- Apply MAs to Chart: Plot the chosen moving averages onto the price chart of your selected stock. Ensure they are clearly visible and distinguishable.
- Identify Crossover Signals: Watch for the shorter-term MA to cross above the longer-term MA (bullish signal) or below it (bearish signal).
- Confirm with Other Indicators: Before entering a trade, look for confirmation from other technical indicators like the Relative Strength Index (RSI), MACD, or volume analysis. This helps filter out false signals.
- Set Stop-Loss and Take-Profit: Define your risk management parameters. Set a stop-loss order below the recent swing low (for long positions) or above the recent swing high (for short positions) and a take-profit target based on your risk-reward ratio.
- Execute and Monitor: Place your trade based on the confirmed signal and monitor its progress, adjusting stop-losses as the trade moves in your favour.

For instance, a trader using the Trend Traders Tool might observe a bullish 20-day MA crossover on their chosen stock and use the tool’s additional insights to refine their entry point.
What are the Benefits and Limitations?
Like all trading strategies, moving average crossovers have their pros and cons that Indian traders must understand.
Benefits
- Simplicity: The strategy is easy to understand and implement, making it suitable for beginners.
- Trend Identification: It effectively helps identify the direction and potential strength of a trend.
- Objective Signals: Crossovers provide clear, objective buy and sell signals, reducing emotional decision-making.
- Versatility: Applicable across different timeframes and financial instruments (stocks, indices, commodities).
Limitations
- Lagging Indicator: Moving averages are based on past prices, meaning signals can lag behind actual price movements, especially in fast-moving markets.
- Whipsaws: In sideways or non-trending markets, MAs can generate frequent false signals (whipsaws), leading to losses.
- Not a Standalone System: It’s rarely profitable on its own and requires confirmation from other tools or analysis.
- Parameter Sensitivity: The effectiveness heavily depends on the chosen MA periods and the market conditions.
Understanding these limitations is key to managing risk and improving the success rate of the strategy. It is essential to backtest any strategy before deploying real capital.
Frequently Asked Questions
What is the most common moving average crossover strategy?
The most common strategy involves using a 50-day Simple Moving Average (SMA) and a 200-day SMA, looking for crossovers. A 50-day SMA crossing above the 200-day SMA is a ‘Golden Cross’ (bullish), and below is a ‘Death Cross’ (bearish).
Which moving average periods are best for Indian stocks?
There’s no single ‘best’ period. Common combinations include 10/20 for short-term, 20/50 for medium-term, and 50/200 for long-term trends. Experimentation and backtesting on specific stocks are recommended.
Can moving average crossovers predict market tops and bottoms?
While they can signal potential trend changes near tops and bottoms, they are lagging indicators. They are better at confirming a trend has started or reversed rather than precisely predicting the turning point.
Are moving average crossovers effective in volatile markets like India?
They can be less effective in highly volatile or sideways markets, generating frequent false signals (whipsaws). They perform best in clearly trending markets. Using them with other indicators and proper risk management is crucial.
When should I use a Simple Moving Average (SMA) versus an Exponential Moving Average (EMA)?
SMAs are smoother and better for identifying longer-term trends. EMAs are more responsive to recent price changes, making them suitable for shorter-term trends or when quicker signals are desired.
How can I improve the accuracy of moving average crossover signals?
Combine them with other technical indicators like RSI, MACD, or Stochastic Oscillator for confirmation. Also, analyse trading volume and consider the overall market trend and economic news.

Key Takeaways:
- Moving average crossovers provide clear buy/sell signals based on trend changes.
- The Golden Cross (bullish) and Death Cross (bearish) are popular long-term signals.
- Short-term crossovers offer faster but potentially less reliable signals.
- The strategy performs best in trending markets and requires confirmation from other indicators.
- Lagging nature and whipsaws in sideways markets are key limitations.
- Choosing appropriate MA periods and combining with risk management is vital for success.
- Backtesting strategies on historical data is essential before live trading.
Investing in the stock market involves risk, and past performance is not indicative of future results. Always conduct your own research or consult a financial advisor.





 Finovatives