TL;DR: FII and DII activity acts as a significant catalyst for Nifty 50 movements; their net buying or selling often dictates short-to-medium term market direction and sentiment, making it a critical indicator for retail traders.
Key Stats at a Glance:
- Nifty 50’s average daily trading volume: ₹70,000 – ₹1,00,000 crore (approx.)
- FIIs and DIIs collectively account for over 60% of daily trading turnover on NSE.
- In FY24, net FII investment in Indian equities was ₹1.25 lakh crore.
- In FY24, net DII investment in Indian equities was ₹62,000 crore.
- The Nifty 50 index has historically shown higher volatility during periods of high FII/DII churn.
What are FIIs and DIIs?
Foreign Institutional Investors (FIIs) are entities registered outside India that invest in Indian securities, such as mutual funds, pension funds, and hedge funds. Domestic Institutional Investors (DIIs) are Indian entities that invest in Indian securities, including mutual funds, insurance companies, and banks, acting on behalf of Indian investors.
How do FIIs and DIIs impact the Nifty 50?
FII and DII activity significantly impacts the Nifty 50 because their large transaction sizes can create substantial demand or supply, directly influencing index prices and overall market sentiment.
Defining FIIs and DIIs in the Indian Context
In India, FIIs are often referred to as Foreign Portfolio Investors (FPIs) under current SEBI regulations, encompassing a broad range of overseas entities. DIIs are the backbone of domestic capital markets, including entities like LIC, UTI Mutual Fund, ICICI Prudential Life Insurance, and other asset management companies registered with SEBI that pool money from Indian citizens.
Their sheer volume of trading means that consistent buying or selling by these institutions can lead to significant price movements in the Nifty 50 and its constituent stocks. When FIIs are net buyers, it signals confidence in the Indian economy and equity markets, often leading to an upward trend in the Nifty 50. Conversely, net selling by FIIs can trigger sell-offs. DIIs, on the other hand, tend to be more stable investors, often buying during market dips, which can provide a cushion to the Nifty 50 and mitigate sharp declines. However, their selling can also exacerbate downturns.
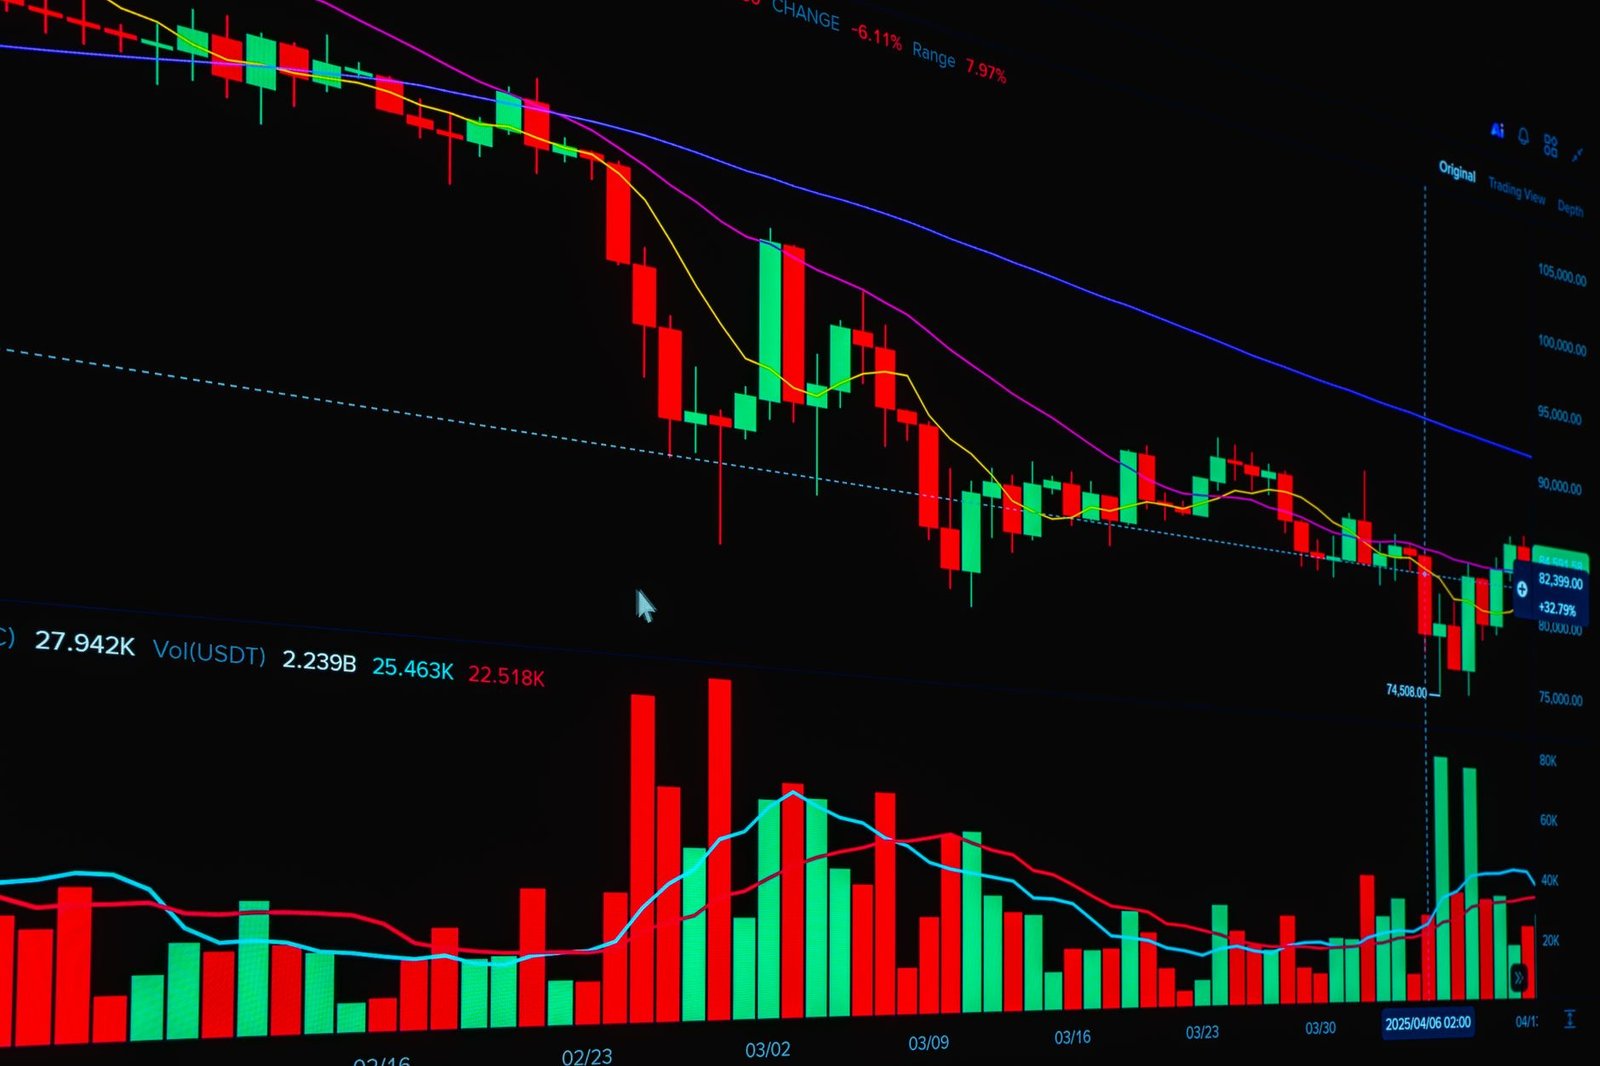
The interplay between FII and DII flows creates a dynamic market environment. For instance, a surge in FII inflows coupled with DII outflows might suggest a short-term, sentiment-driven rally, whereas strong buying from both FIIs and DIIs typically indicates a more sustained, fundamental-driven upward move.
The Influence of Net Buying and Selling
The most commonly tracked metric is the ‘net’ figure – the difference between the total value of securities bought and sold by FIIs and DIIs on any given day. A positive net figure (net buyers) suggests increased demand, while a negative net figure (net sellers) indicates increased supply.
When FIIs are consistently net buyers, it often correlates with a strengthening Indian Rupee and positive economic outlook, driving the Nifty 50 higher. Their investments are often driven by global macroeconomic trends, interest rate differentials, and perceived growth opportunities in emerging markets like India. On the other hand, when they turn net sellers, it can be due to global risk aversion, rising interest rates in their home countries, or concerns about India’s economic fundamentals. This selling pressure can drag the Nifty 50 down.
DIIs, being domestic entities, often have a longer-term investment horizon and a better understanding of local market dynamics. They tend to buy when valuations are attractive or when they anticipate future growth. Their consistent buying can provide stability to the market, acting as a counter-balance to FII volatility. However, during periods of extreme market stress or when domestic economic concerns rise, DIIs may also become net sellers, contributing to market declines.
Analyzing FII and DII Data for Trading Decisions
Retail traders can leverage FII and DII data to understand market sentiment and identify potential trading opportunities. While not a crystal ball, their activity provides valuable insights into institutional conviction.
Where to Find FII/DII Data
Official data on FII and DII activity is readily available from the National Stock Exchange of India (NSE) website. Daily reports detail the net buy/sell figures for both categories across various market segments. Financial news portals and dedicated market data platforms, including those that integrate with TradingView indicators, also provide aggregated and visualized FII/DII data, simplifying analysis for traders.
Interpreting the Data: Beyond Simple Numbers
It’s crucial to look beyond the daily net figures. Analysts often examine the trend of FII/DII flows over several days or weeks. Sustained buying or selling, rather than sporadic transactions, provides a clearer picture of institutional intent. For example, if FIIs have been net sellers for a week, but the Nifty 50 hasn’t corrected significantly, it might indicate strong buying support from DIIs or a lack of selling conviction among retail investors.
Furthermore, understanding the sectors or specific stocks where FIIs and DIIs are deploying capital can offer targeted investment ideas. Certain Finovatives tools, like the Trend Traders Tool, can help identify institutional accumulation patterns that might not be immediately obvious from raw data alone.
Correlation with Market Movements
Historically, there’s a strong positive correlation between net FII inflows and Nifty 50 rallies, and a negative correlation during periods of net FII outflows. DII activity, while also influential, often acts as a stabilizing force or a confirmation signal. When both FIIs and DIIs are buying, it’s a strong bullish signal for the Nifty 50. Conversely, aggressive selling by both can signal a market top or a significant correction.
Potential Pitfalls to Avoid
Relying solely on FII/DII data is risky. Their decisions can be influenced by global factors, short-term trading strategies, or even algorithmic trading, which may not align with long-term fundamental value. Retail traders should always combine FII/DII analysis with their own fundamental and technical analysis, considering factors like economic indicators, corporate earnings, and chart patterns. Over-interpreting a single day’s data can lead to poor trading decisions.
How FII and DII Activity Can Be Used by Retail Traders
Retail traders can incorporate FII and DII data into their strategy by using it as a confirmation tool or an early warning system.
- Monitor Daily Net Flows: Regularly check the NSE website or reliable financial news sources for daily FII and DII net buy/sell figures.
- Identify Trends: Look for sustained buying or selling patterns over several days or weeks, not just single-day data.
- Sectoral Analysis: Observe which sectors or stocks are attracting significant institutional interest (buying) or seeing heavy institutional selling.
- Use as Confirmation: If your technical or fundamental analysis suggests a bullish setup, confirm it with strong net buying from FIIs/DIIs. If it suggests a bearish setup, look for net selling.
- Beware of Short-Term Noise: Understand that FIIs/DIIs can engage in short-term trading. Don’t base long-term decisions solely on their daily activity.
- Combine with Other Tools: Integrate FII/DII insights with other technical indicators (like moving averages, RSI) and fundamental data.
- Consider Macro Factors: Be aware of global and domestic macroeconomic events that might influence institutional flows.
The Role of FIIs in Market Volatility
FIIs, due to their often higher leverage and sensitivity to global news, can be significant contributors to market volatility. Sudden shifts in their investment strategies, driven by geopolitical events or changes in global monetary policy, can lead to rapid inflows or outflows, causing sharp swings in the Nifty 50.
For instance, during the initial phase of the COVID-19 pandemic in early 2020, FIIs were significant net sellers, leading to a sharp decline in the Nifty 50. As the global economic outlook improved and India’s growth prospects were re-evaluated, FII inflows resumed, contributing to the subsequent market recovery. This illustrates their power to amplify both downside and upside movements.
DIIs as Market Stabilizers
DIIs, on the other hand, are often perceived as more stable investors. Their mandate typically involves managing long-term savings for Indian citizens, such as through mutual funds and insurance policies. This often leads them to adopt a more disciplined approach, buying fundamentally sound stocks at attractive valuations and holding them for the long term. Their consistent buying during market downturns can absorb selling pressure from other participants, including FIIs, thereby providing a stabilizing effect on the Nifty 50.

Impact on Currency and Interest Rates
Significant FII inflows can strengthen the Indian Rupee as foreign currency is converted into Rupees for investment. Conversely, outflows can weaken the Rupee. This currency impact can indirectly affect the Nifty 50, as a stronger Rupee can make Indian exports more expensive, potentially impacting corporate earnings, while a weaker Rupee can boost export-oriented companies. Furthermore, FII decisions are often influenced by global interest rate differentials, which also impact domestic interest rate expectations and, consequently, equity valuations.
FII/DII Activity vs. Other Market Indicators
While FII and DII activity is a potent indicator, it’s not the only one. Retail traders should consider it alongside other critical market signals.
Comparison with Retail Investor Activity
Retail investor activity, while growing, still pales in comparison to the sheer volume deployed by FIIs and DIIs. However, sharp increases in retail participation, especially during market rallies, can sometimes be a contrarian indicator, suggesting that the market may be becoming overheated and ripe for a correction, particularly if institutional investors start taking profits.
Technical Analysis and FII/DII Data
Technical analysis provides insights into price action, momentum, and potential support/resistance levels. When combined with FII/DII data, it creates a more robust trading strategy. For example, if the Nifty 50 shows a bullish divergence on an RSI indicator (indicating potential upward momentum) and FIIs are also showing strong net buying, it strengthens the buy signal. Conversely, bearish divergence coupled with heavy FII selling would be a strong sell signal.

Fundamental Analysis and Institutional Flows
Fundamental analysis focuses on the intrinsic value of companies and the overall economy. FIIs and DIIs often base their large-scale investments on fundamental factors like GDP growth, inflation, corporate earnings, and government policies. Therefore, understanding the fundamental economic outlook of India is crucial to anticipating institutional flows. For instance, positive economic reforms or strong corporate earnings reports often attract FII/DII inflows, supporting the Nifty 50.
Frequently Asked Questions
What is the most important indicator of FII/DII impact on Nifty 50?
The most important indicator is the trend of their net buying or selling over a sustained period (days to weeks), rather than just single-day figures, reflecting institutional conviction.
Can FII/DII data predict the exact Nifty 50 movement?
No, FII/DII data is an influential factor but not a perfect predictor. Market movements are complex, influenced by numerous factors beyond institutional flows.
How often should I check FII/DII data?
Checking daily net figures is common, but analyzing weekly or monthly trends provides a more reliable picture of institutional sentiment and strategy.
Are FIIs always right about the Indian market?
Not necessarily. FIIs can be influenced by global factors or short-term strategies, and their positioning can sometimes be incorrect or change rapidly.
What is the difference between FPI and FII?
FPI (Foreign Portfolio Investor) is the current regulatory term under SEBI, encompassing what was previously known as FII (Foreign Institutional Investor) and other foreign investors, offering a more streamlined registration process.
How does DII activity differ from FII activity?
DIIs are domestic entities investing Indian capital, often with a long-term view and local market understanding, while FIIs are foreign entities investing foreign capital, potentially more influenced by global trends and risk appetite.
Key Takeaways
- FIIs and DIIs are major players whose trading activity significantly impacts Nifty 50 direction and sentiment.
- Monitor net buying/selling trends over time, not just daily figures, for deeper insights.
- FII inflows often correlate with market rallies; outflows can signal corrections.
- DIIs tend to be more stable investors, often providing support during market dips.
- Combine FII/DII data analysis with technical and fundamental analysis for robust trading strategies.
- Always consider broader economic and global factors influencing institutional decisions.
- Utilize reliable sources like NSE, financial news portals, and advanced tools for accurate data.
Disclaimer: Investing in the stock market involves inherent risks. Please consult with a qualified financial advisor before making any investment decisions.


 Finovatives