TL;DR: The top intraday trading strategies for the Indian stock market focus on quick price movements, volume analysis, and specific chart patterns, often employing techniques like scalping, momentum trading, and breakout trading to capture profits within a single trading session.
Key Stats at a Glance:
- NSE’s average daily trading volume often exceeds ₹80,000 crore.
- The Nifty 50 index has historically shown significant intraday volatility.
- Over 90% of intraday trades in India are typically squared off before market close.
- Successful intraday traders often aim for a daily profit target of 1-2% of their capital.
- The Securities and Exchange Board of India (SEBI) regulates all trading activities.
What are the best intraday trading strategies for the Indian market?
The best intraday trading strategies for the Indian stock market involve a combination of technical analysis, risk management, and discipline, focusing on capturing small but frequent price movements within a single trading day.
Understanding Intraday Trading Dynamics in India
Intraday trading, often referred to as ‘day trading’, involves buying and selling financial instruments within the same trading day, ensuring all positions are closed before the market closes. The Indian stock market, comprising the National Stock Exchange (NSE) and the Bombay Stock Exchange (BSE), presents unique opportunities and challenges for intraday traders due to its specific trading hours, regulatory framework overseen by SEBI, and the behaviour of its listed securities. Successful day traders leverage market volatility, liquidity, and their chosen strategy to profit from minor price fluctuations. This requires a keen understanding of market sentiment, news events, and technical indicators.
Scalping: The Art of Quick Profits
Scalping is an aggressive intraday strategy focused on making numerous small profits from small price changes throughout the day. Scalpers aim to enter and exit trades rapidly, often holding positions for mere seconds or minutes. The core idea is to accumulate small gains that, when combined, result in a substantial profit by the end of the day. This strategy relies heavily on high liquidity and tight bid-ask spreads, making highly traded stocks and indices like the Nifty 50 and Bank Nifty ideal candidates. Scalpers often use indicators like the Moving Average Convergence Divergence (MACD) and stochastic oscillators to identify short-term entry and exit points.
Momentum Trading: Riding the Trend
Momentum trading involves identifying stocks that are exhibiting a strong upward or downward price trend and entering trades in the direction of that momentum. The belief is that a stock that is currently moving strongly in one direction will continue to do so in the short term. Momentum traders typically use indicators such as the Relative Strength Index (RSI) and Average True Range (ATR) to gauge the strength and sustainability of a trend. They enter a trade when a stock shows strong price action and exit when the momentum begins to fade, often using trailing stop-losses to protect profits.
Breakout Trading: Capitalising on Volatility
Breakout trading strategies involve identifying periods of consolidation or low volatility, where a stock’s price is trading within a defined range (support and resistance levels). A ‘breakout’ occurs when the price decisively moves beyond these established levels. Traders look to enter a position once the breakout is confirmed, expecting the price to continue moving in the direction of the breakout. For example, if a stock breaks above its resistance level with increased volume, a breakout trader might buy, anticipating further upside. Conversely, a break below support might signal a shorting opportunity. Volume is a critical confirmation tool in breakout trading.
Key Technical Indicators for Intraday Success
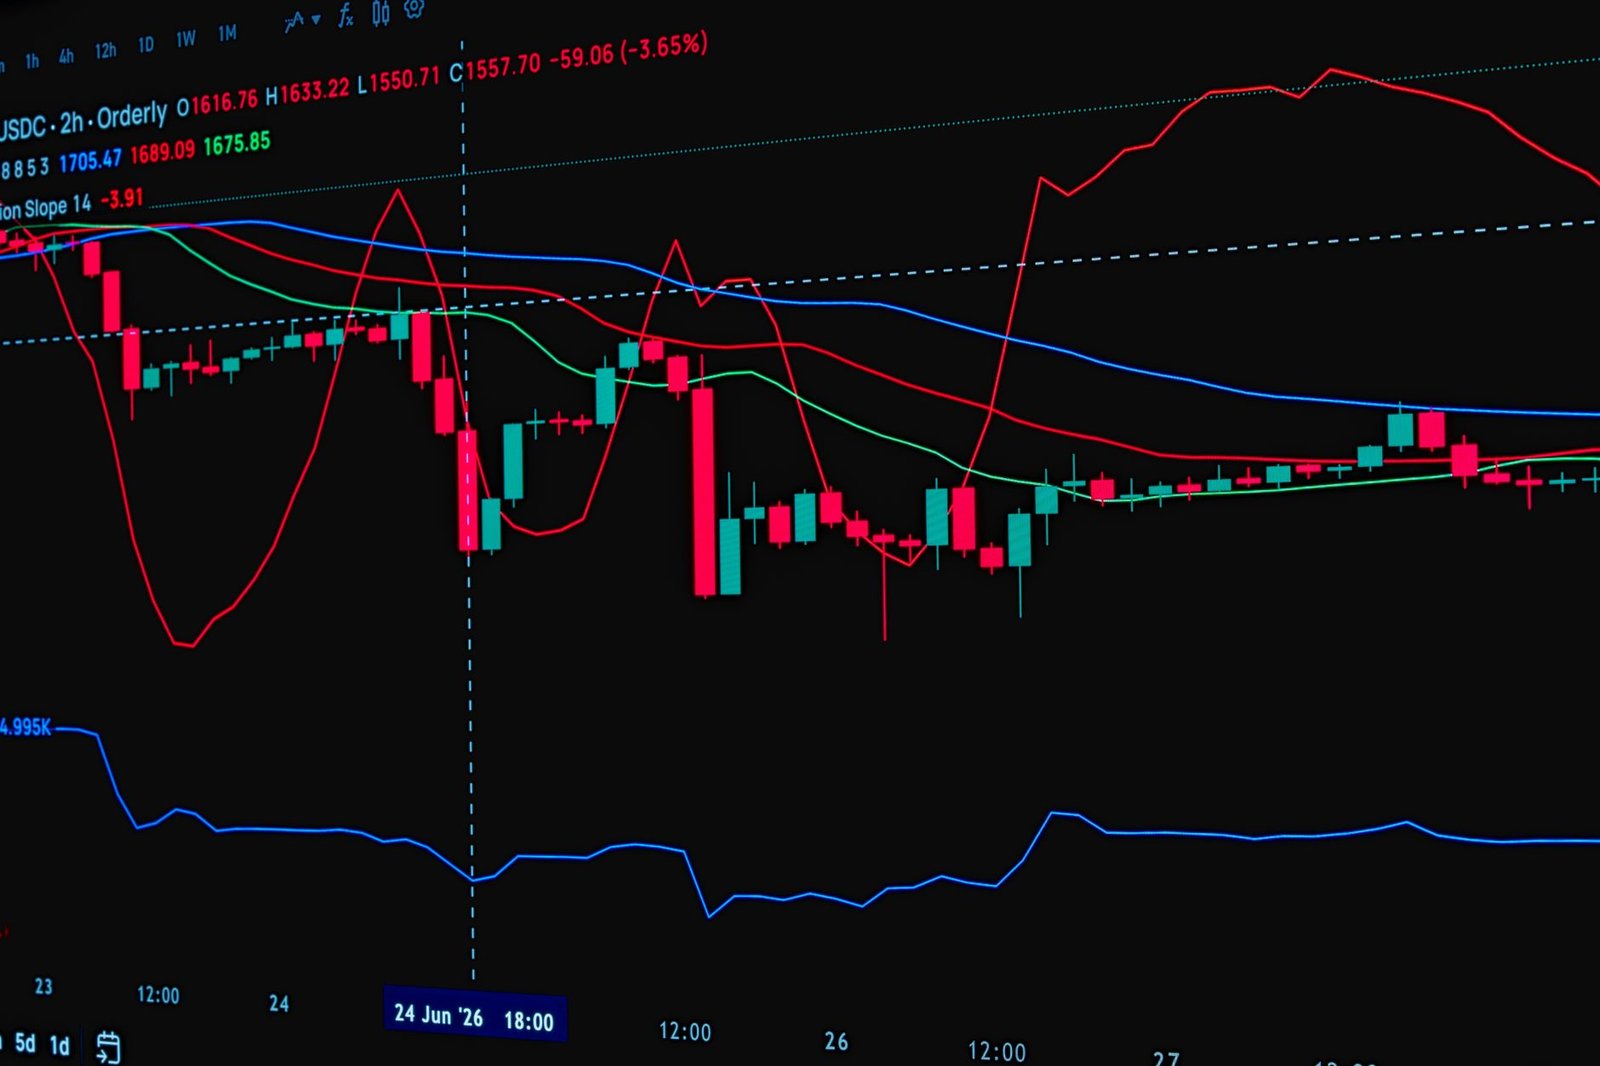
Technical indicators are mathematical calculations based on a security’s price and volume, used by traders to forecast future price movements. For intraday trading in India, certain indicators are particularly effective due to their ability to signal short-term opportunities.
Moving Averages (MAs)
Moving averages smooth out price data to create a single flowing line, making it easier to identify the direction of a trend. Simple Moving Averages (SMAs) and Exponential Moving Averages (EMAs) are commonly used. Crossovers of shorter-term MAs with longer-term MAs can signal potential buy or sell opportunities. For instance, a 9-EMA crossing above a 20-EMA might indicate bullish momentum.
Relative Strength Index (RSI)
The RSI is a momentum oscillator that measures the speed and change of price movements. It oscillates between 0 and 100 and is typically used to identify overbought or oversold conditions. An RSI reading above 70 often suggests a stock is overbought, potentially signalling a price reversal or a pause in an uptrend. Conversely, an RSI below 30 suggests oversold conditions, potentially indicating a buying opportunity. However, in strong trends, RSI can remain in overbought/oversold territory for extended periods.
Volume Analysis
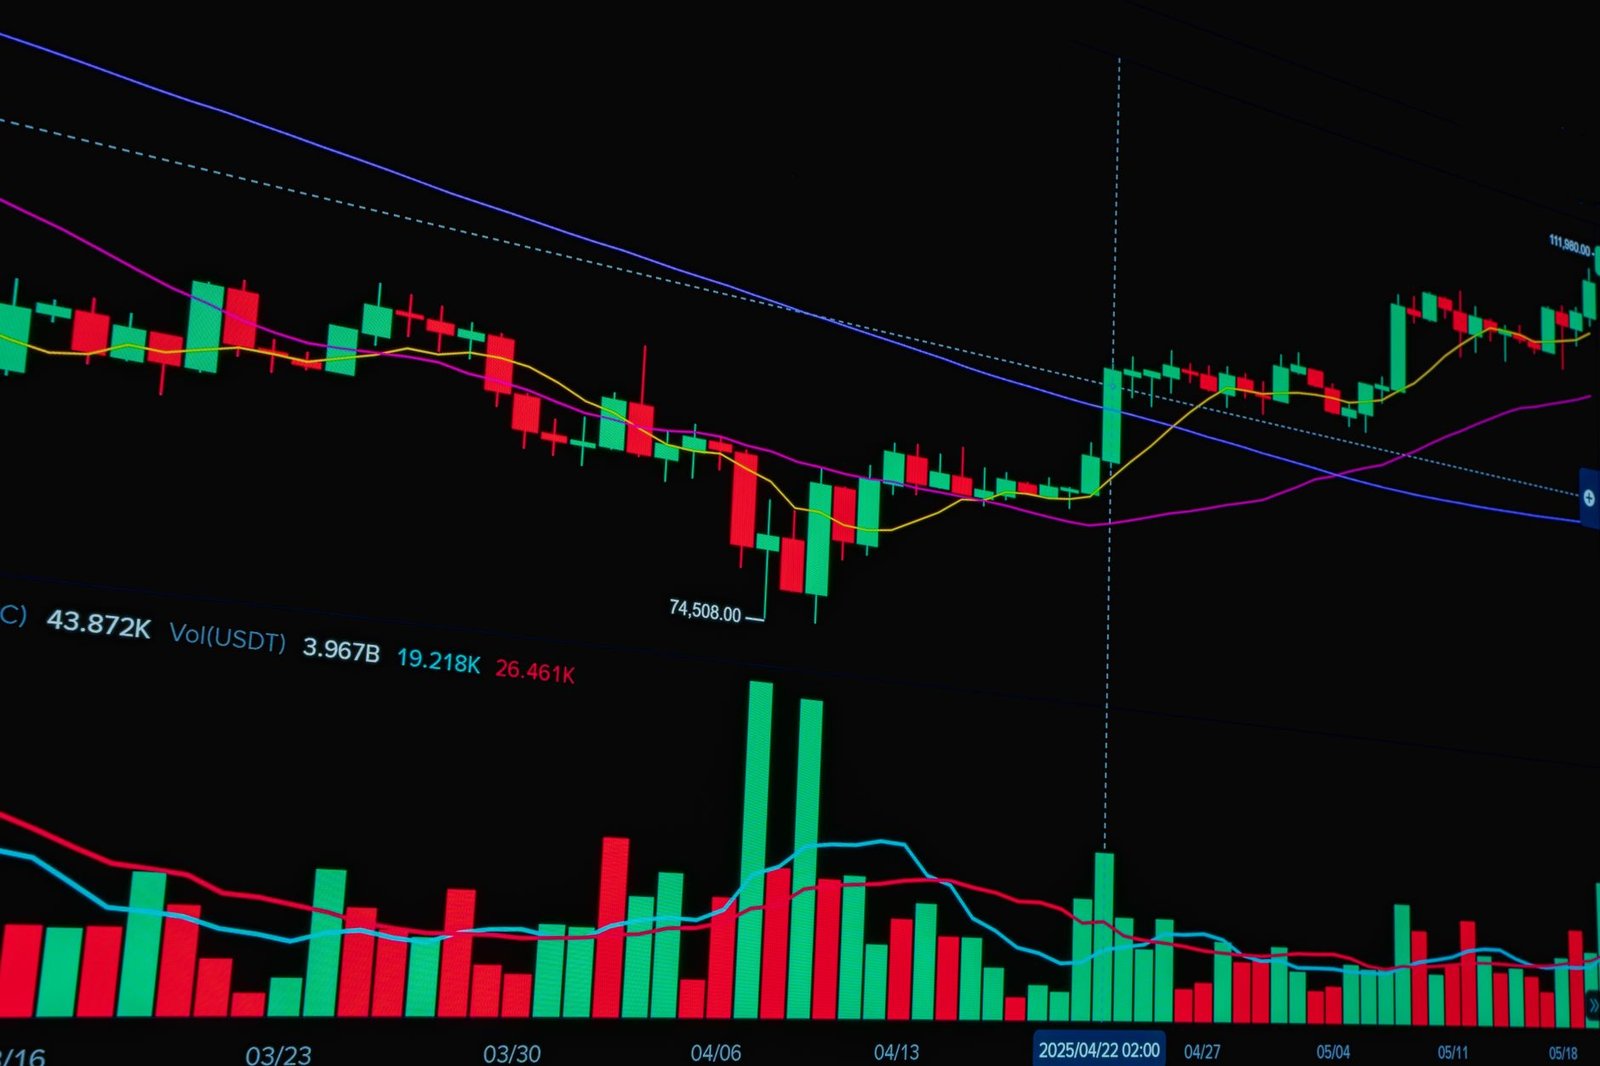
Volume represents the number of shares traded during a specific period. High volume accompanying a price move often confirms the strength of that move. For example, a sharp price increase on significantly higher-than-average volume is a strong bullish signal. Conversely, a price drop on high volume indicates strong selling pressure. Intraday traders use volume to validate breakouts, identify reversals, and gauge the conviction behind a price move.
How to Implement an Intraday Trading Strategy
Implementing an intraday trading strategy requires a systematic approach. It’s not just about picking a strategy, but about executing it with discipline and continuous refinement.
- Choose a Strategy: Select an intraday strategy (e.g., scalping, momentum, breakout) that aligns with your risk tolerance, available capital, and personality.
- Select Your Instruments: Focus on liquid stocks or indices with significant intraday price movement. NSE’s F&O segment offers many such instruments.
- Utilise Technical Indicators: Configure your trading platform with relevant indicators (e.g., MAs, RSI, MACD) to identify entry and exit signals based on your chosen strategy. Our TradingView indicator can be a valuable tool here.
- Set Strict Stop-Loss Orders: Always determine your maximum acceptable loss before entering a trade and place a stop-loss order accordingly. This is crucial for risk management.
- Define Profit Targets: Set realistic profit targets for each trade. Aim for a favourable risk-reward ratio (e.g., 1:2 or 1:3).
- Manage Your Trade: Monitor your open positions and be prepared to adjust your stop-loss (e.g., trailing stop-loss) to protect profits as the trade moves in your favour.
- Review and Refine: At the end of each trading day, review your trades. Analyse what worked, what didn’t, and why. Use these insights to refine your strategy.
- Continuous Learning: Stay updated on market news, economic events, and trading techniques. The market is dynamic, and continuous learning is key to long-term success.
Risk Management in Intraday Trading
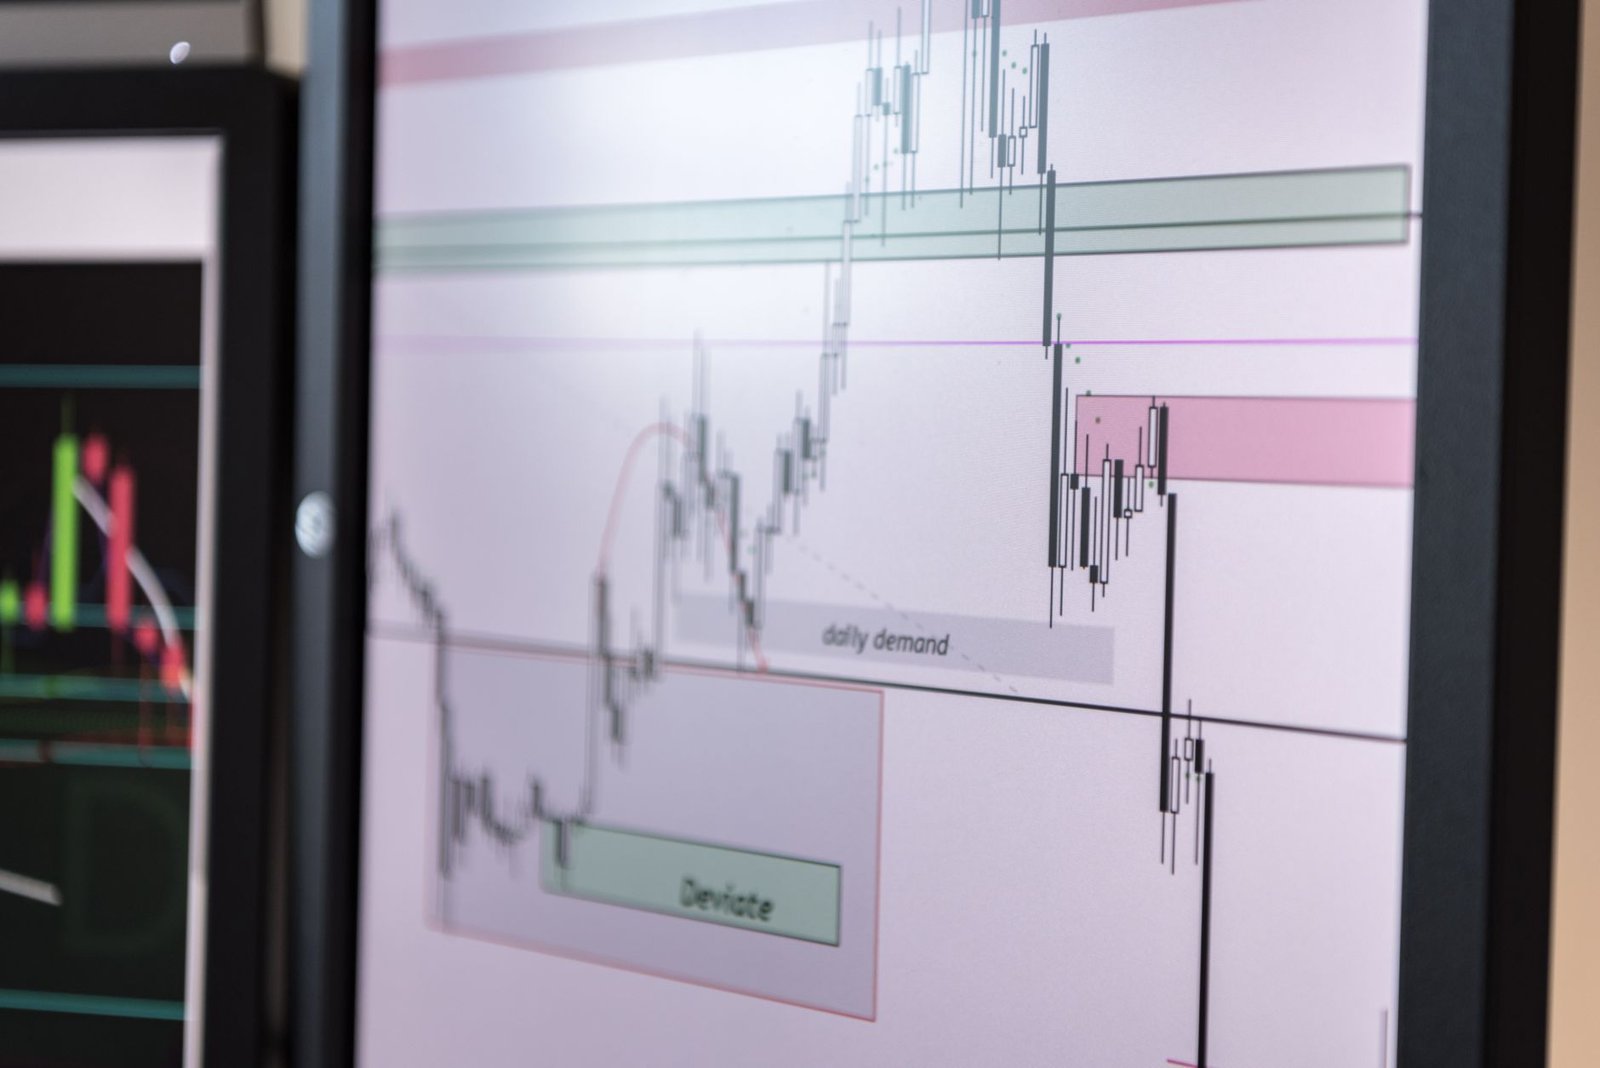
Effective risk management is paramount for survival and success in intraday trading. The high-frequency nature of day trading amplifies the impact of losses if not properly controlled.
Position Sizing
Determine the appropriate number of shares to trade based on your total capital and the acceptable risk per trade (e.g., 1-2% of capital). This prevents a single losing trade from decimating your account.
Stop-Loss Orders
As mentioned, stop-loss orders are non-negotiable. They automatically exit a trade when it reaches a pre-determined loss level, limiting potential downside. Different types of stop-losses, like fixed percentage or volatility-based stops, can be employed.
Risk-Reward Ratio
Always aim for trades where the potential profit significantly outweighs the potential loss. A minimum risk-reward ratio of 1:2 (meaning you aim to make ₹2 for every ₹1 you risk) is a common guideline.
Diversification (Limited for Intraday)
While intraday traders often focus on a few high-conviction trades, spreading risk across a very small number of uncorrelated instruments can sometimes be beneficial, provided it doesn’t dilute focus.
Frequently Asked Questions
What is the most popular intraday trading strategy in India?
Momentum trading and breakout trading are quite popular among Indian intraday traders due to the market’s inherent volatility and the prevalence of trending stocks. Scalping is also favoured by a segment of traders.
How much capital is needed for intraday trading in India?
While you can start with a smaller amount, SEBI regulations and practical considerations suggest a capital of at least ₹50,000 to ₹1,00,000 is advisable for meaningful intraday trading to manage risk and leverage opportunities effectively.
What are the risks of intraday trading?
The primary risks include rapid and significant financial losses due to market volatility, emotional decision-making (fear and greed), potential for over-trading, and the leverage amplifying both profits and losses.
Can I use TradingView indicators for intraday trading?
Absolutely. TradingView is a widely used platform, and its indicators, including custom ones like the Trend Traders Tool, are extensively used by intraday traders to analyse charts and identify trading opportunities in real-time.
What time of day is best for intraday trading in India?
The opening hour (9:15 AM – 10:15 AM IST) and the closing hour (2:00 PM – 3:30 PM IST) often offer the most volatility and trading opportunities due to market opening reactions and pre-closing adjustments.
Key Takeaways
- Intraday trading strategies like scalping, momentum trading, and breakout trading aim to profit from short-term price movements.
- Key technical indicators such as Moving Averages, RSI, and volume analysis are crucial for identifying trading signals.
- Strict risk management, including stop-loss orders and proper position sizing, is essential for survival.
- A systematic approach involving strategy selection, execution, and continuous review is vital for success.
- The Indian stock market offers opportunities but also requires adherence to SEBI regulations and disciplined trading practices.
- Focusing on liquid instruments and understanding market dynamics enhances trading efficacy.
Trading in the Indian stock market involves substantial risk and is not suitable for all investors. Past performance is not indicative of future results.




 Finovatives