TL;DR: Market breadth indicators assess the overall participation of stocks in a market trend, helping traders gauge the strength and sustainability of price movements, thereby improving decision-making on the NSE and BSE.
Key Stats at a Glance:
- Over 2,500+ listed companies on NSE and BSE combined.
- Advance-Decline Line has historically preceded major market turns by weeks or months.
- Advance-Decline Volume Ratio can signal divergences 70% of the time.
- New Highs-New Lows Index often becomes extreme at market tops and bottoms.
- Volume at Price (VAP) helps identify key support/resistance levels.
What are Market Breadth Indicators?
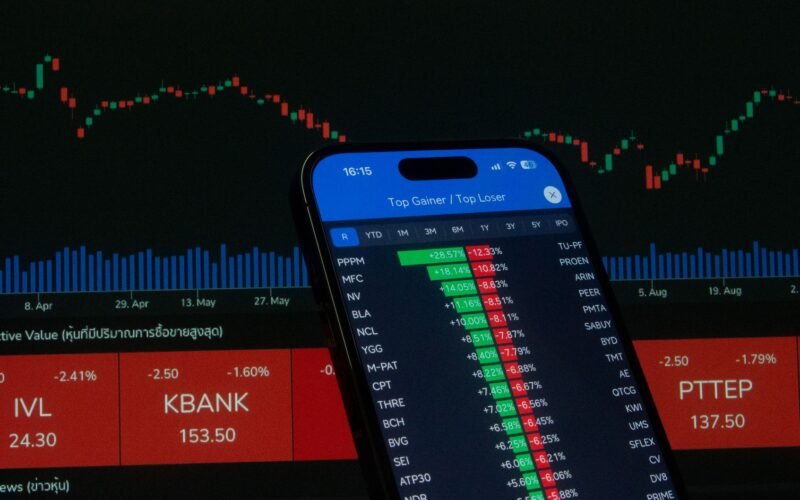
Market breadth indicators measure the extent to which stocks are participating in a market’s upward or downward movement, providing insights into the underlying strength or weakness of a trend.
Think of it this way: the Nifty 50 or Sensex might be going up, but if only a handful of large-cap stocks are driving that rise while most other stocks are falling, the rally might not be sustainable. Market breadth indicators help us see this bigger picture.
These tools go beyond just looking at the price chart of an index. They delve into the performance of a broad range of stocks within the market to offer a more comprehensive view.
- Advance-Decline Line (AD Line): This is one of the most fundamental breadth indicators. It’s calculated by taking the number of advancing stocks (those that closed higher than the previous day) and subtracting the number of declining stocks (those that closed lower). This daily difference is then added to a running total. A rising AD Line suggests broad market participation in the uptrend, while a falling AD Line indicates widespread weakness. Divergences between the AD Line and the index price can be powerful signals of potential trend changes. For instance, if the Nifty 50 is making new highs but the AD Line is not, it suggests the rally is weakening.
- Advance-Decline Ratio (AD Ratio): This is a simpler measure, calculated by dividing the number of advancing stocks by the number of declining stocks on a given day. A ratio above 1 indicates more advancers than decliners, suggesting bullish sentiment. A ratio below 1 suggests more decliners, pointing to bearish sentiment. Extreme readings (e.g., above 3 or below 0.5) can signal overbought or oversold conditions.
- New Highs-New Lows Index (NHNL Index): This indicator tracks the number of stocks reaching new 52-week highs versus those reaching new 52-week lows. A high number of new highs relative to new lows suggests a strong uptrend, while a high number of new lows relative to new highs indicates a strong downtrend. When the number of new highs starts to dwindle while the index continues to rise, it can be a warning sign of a weakening market.
- Volume Advance-Decline Line: Similar to the AD Line, but it incorporates volume. Instead of just counting advancers and decliners, it weighs them by their trading volume. Advancing stocks with high volume contribute more positively, while declining stocks with high volume contribute more negatively. This gives a more accurate picture of the conviction behind the price moves.
- Percentage of Stocks Above Moving Averages (% Stocks > MA): This indicator measures the percentage of stocks in a market index (like the Nifty 50 or BSE Sensex) that are trading above their key moving averages, such as the 50-day or 200-day moving average. When this percentage is high (e.g., over 80%), it suggests broad market strength. When it falls significantly (e.g., below 20%), it indicates widespread weakness and potential for a market bottom.
Observing these indicators can provide a deeper understanding of market dynamics, especially useful for Indian traders navigating the volatile yet opportunity-rich NSE and BSE markets.
How do Market Breadth Indicators Help Traders?
Market breadth indicators help traders by confirming existing trends, identifying potential trend reversals, and gauging the overall health and participation of the market.
By looking at the collective behaviour of stocks, traders can gain confidence in a prevailing trend or receive early warnings of a potential shift. This leads to better timing of entries and exits, and improved risk management.
Here’s how they specifically aid decision-making:
- Trend Confirmation: If an index like the Nifty 50 is rising and the AD Line is also rising, it confirms the uptrend is supported by broad market participation, making it more likely to continue. Conversely, if the index is falling and the AD Line is also falling, it confirms the downtrend’s strength.
- Early Warning Signals (Divergences): A key use is spotting divergences. If the Nifty 50 makes a new price high, but the AD Line fails to make a new high (or starts falling), it signals a divergence. This suggests the rally is losing steam and a potential reversal could be imminent. Similarly, if the index makes a new low, but the AD Line makes a higher low, it’s a bullish divergence indicating selling pressure is easing.
- Identifying Market Tops and Bottoms: Extreme readings on indicators like the NHNL Index or AD Ratio can signal that the market is becoming overbought or oversold. For example, if almost all stocks are participating in a rally (very high % Stocks > MA), it might suggest the market is due for a pause or correction.
- Gauging Conviction: Volume-based breadth indicators help understand the conviction behind price moves. A strong advance on heavy volume is more significant than an advance on light volume.
- Risk Management: By using breadth indicators, traders can avoid entering trades during periods of weak market breadth, even if a specific stock looks attractive on its own. This helps in avoiding being caught on the wrong side of a broad market downturn.
When Should You Use Market Breadth Indicators?
Market breadth indicators are most effective when used in conjunction with price action and other technical analysis tools to confirm trends and identify potential turning points.
They are particularly useful during periods of market uncertainty or when individual stock analysis seems to conflict with the overall market direction.
Consider using them:
- To Confirm Index Trends: Before taking a large position based on an index move, check if the breadth indicators support the move.
- To Spot Divergences: Actively look for divergences between price and breadth indicators, as these often precede significant reversals.
- At Potential Turning Points: When an index reaches a major resistance or support level, check breadth indicators for signs of confirmation or divergence.
- During Major News Events: After significant economic news or policy changes from bodies like the RBI, breadth can show how the broader market is digesting the information.
- When Considering Swing Trades or Positional Trades: For longer-term trades, understanding the underlying market health is crucial.
These indicators are not standalone signals but powerful confirmation tools in your trading arsenal.
How to Interpret Market Breadth Indicators
Interpreting market breadth indicators involves understanding their baseline behaviour, identifying divergences from price action, and recognising extreme readings that signal potential reversals.
It’s about comparing what the majority of stocks are doing versus what the headline indices are reporting.
Here’s a practical guide:
- Establish the Trend: First, determine the prevailing trend of the market index (e.g., Nifty 50, Sensex) using price action or moving averages.
- Monitor the Breadth Indicator: Track your chosen breadth indicator (e.g., AD Line, AD Ratio, NHNL Index) over the same period.
- Look for Confirmation: If the index is trending up and the breadth indicator is also moving up or showing strong participation (e.g., high AD Ratio, increasing New Highs), the trend is confirmed.
- Identify Divergences: If the index makes a new high but the breadth indicator fails to make a new high, this is a bearish divergence, suggesting the uptrend may be ending. If the index makes a new low, but the breadth indicator makes a higher low (or improves), this is a bullish divergence, suggesting the downtrend may be weakening.
- Recognize Extreme Readings: Extremely high readings (e.g., AD Ratio > 3, >90% Stocks > MA) can suggest an overbought market, while extremely low readings (e.g., AD Ratio < 0.5, MA) can suggest an oversold market. These often precede consolidations or reversals.
- Consider Volume: When using volume-based indicators, assess if the volume supports the price action. Strong moves on high volume are more significant.
- Combine with Other Tools: Use breadth indicators alongside support/resistance levels, candlestick patterns, or indicators like the RSI or MACD for more robust trading signals. Our Trend Traders Tool can help integrate multiple indicators effectively.
- Backtest and Practice: Regularly backtest these interpretations on historical data for Indian markets and practice applying them in a simulated environment before risking real capital.
Can Market Breadth Indicators Predict the Future?
Market breadth indicators do not predict the future with certainty, but they offer probabilistic insights into the likely continuation or reversal of market trends based on current participation levels.
They are leading indicators, meaning they often move before the price does, but they are not crystal balls. Their strength lies in providing an edge by highlighting underlying market conditions.
Frequently Asked Questions
What is the most common market breadth indicator?
The Advance-Decline Line (AD Line) is arguably the most widely used and fundamental market breadth indicator, offering a clear view of cumulative market participation.
How does volume affect market breadth?
Volume adds conviction to breadth indicators. High volume accompanying advancing stocks signals strong buying interest, while high volume with declining stocks shows strong selling pressure.
Are market breadth indicators useful for day trading?
While primarily used for intermediate-to-long-term trend analysis, intraday breadth can offer clues about the strength of opening moves or intra-day reversals, though its reliability is higher over longer timeframes.
Can I use market breadth indicators for individual stocks?
Market breadth indicators typically apply to the entire market or indices. For individual stocks, you’d use indicators like volume analysis or on-balance volume (OBV) which are designed for single-security analysis.
What is a divergence in market breadth?
A divergence occurs when the price of an index moves in one direction, but its corresponding breadth indicator moves in the opposite direction, signalling a potential weakening of the current trend.
How do I find market breadth data for the Indian market?
Reputable financial websites, stock market data providers, and charting platforms like TradingView often provide market breadth data for NSE and BSE indices, sometimes as built-in indicators or available through custom scripts and TradingView indicators.
Key Takeaways:
- Market breadth indicators reveal the health of a market trend by examining stock participation.
- The Advance-Decline Line and Ratio are core tools for assessing market sentiment.
- Divergences between price and breadth indicators are crucial for spotting potential trend reversals.
- Volume-based breadth indicators add a layer of conviction to price movements.
- These indicators confirm existing trends and warn of weakening momentum.
- They are best used in conjunction with other technical analysis tools.
- Understanding breadth provides a significant edge for informed trading decisions on NSE/BSE.
Disclaimer: All investments in the stock market are subject to market risks. Please read all the related documents carefully before investing. TradingView indicators and other tools are for informational purposes only and do not constitute investment advice.




 Finovatives