TL;DR: Market cycles are recurring patterns of expansion and contraction in stock prices driven by investor psychology and economic conditions, and understanding them on the NSE and BSE allows traders to time their entries and exits more effectively to capitalize on uptrends and mitigate losses during downtrends.
Key Stats at a Glance:
- Nifty 50 has historically shown periods of both strong bull runs (e.g., 2003-2007) and significant corrections (e.g., 2008 financial crisis).
- The average duration of a bull market cycle can vary, but often extends for several years.
- Bear market phases, while shorter, can see substantial declines of 20% or more from peak levels.
- Over 5,000+ companies are listed across NSE and BSE combined.
- Investor sentiment surveys often show a correlation with market turning points.
What are Market Cycles?
Market cycles represent the predictable, yet variable, ebb and flow of stock market prices over time, characterized by distinct phases of growth, peak, decline, and trough.
Imagine the stock market as a living entity that breathes in and out. It doesn’t move in a straight line; instead, it experiences periods of optimism and growth, followed by periods of pessimism and contraction. These fluctuations are known as market cycles. They are driven by a complex interplay of economic factors, corporate earnings, geopolitical events, and, crucially, investor psychology – greed and fear. Understanding these cycles is fundamental for any trader or investor looking to navigate the complexities of the Indian stock exchanges like the NSE (National Stock Exchange) and BSE (Bombay Stock Exchange).
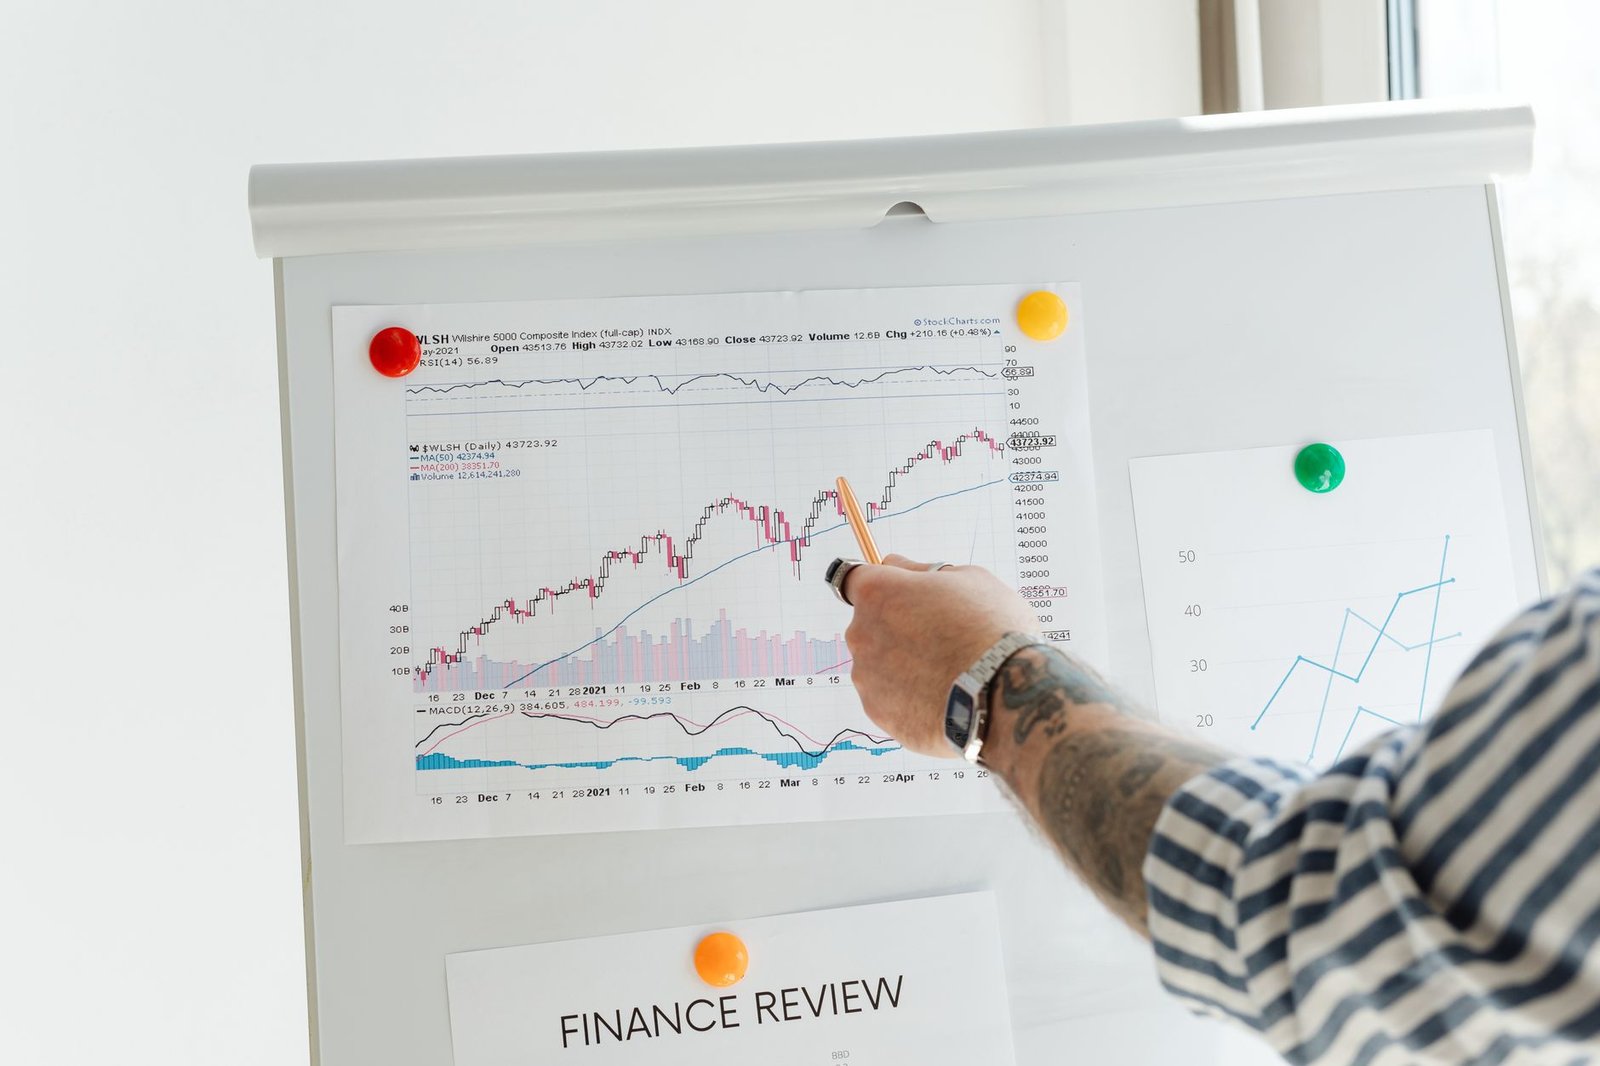
The primary driver behind these cycles is human emotion. During an expansionary phase, optimism fuels buying, pushing prices up. As prices rise, more investors jump in, driven by the fear of missing out (FOMO). This can lead to speculative bubbles. Conversely, during a contractionary phase, fear and panic can lead to a sell-off, driving prices down rapidly, often irrespective of underlying company fundamentals. Recognizing where we are in a cycle helps in making rational decisions rather than emotional ones.
Why is Understanding Market Cycles Crucial for NSE and BSE Traders?
Understanding market cycles is crucial because it allows traders to align their strategies with the prevailing market trend, enhancing the probability of profitable trades and capital preservation.
For traders on the NSE and BSE, grasping market cycles isn’t just academic; it’s a practical necessity. When the market is in an uptrend (bull market), a ‘buy and hold’ or ‘buy on dips’ strategy generally works well. However, attempting such strategies in a downtrend (bear market) can lead to significant losses. Conversely, a downtrend presents opportunities for short-selling or focusing on defensive sectors. By identifying the current phase of the cycle, traders can choose the most appropriate trading tools and techniques. For instance, indicators like moving averages or trendlines become particularly effective in confirming the direction of a cycle. Our Trend Traders Tool, for example, is designed to help pinpoint these directional shifts.
The Four Phases of a Market Cycle
Market cycles are typically understood to consist of four main phases: accumulation, markup (uptrend), distribution, and markdown (downtrend).
- Accumulation Phase: This is the early stage of a bull market. Smart money (institutional investors, big traders) starts buying when prices are relatively low, anticipating a future rise. This phase is often characterized by sideways price action and low trading volume. Sentiment is typically neutral to slightly negative.
- Markup Phase (Uptrend): As accumulation continues and positive news starts to emerge, general public participation increases. Prices begin to rise steadily, often with increasing volume. This is the classic bull market where most investors start making profits. Investor sentiment turns from neutral to optimistic, then to euphoric.
- Distribution Phase: This is the peak of the bull market. Prices may still be rising, but the momentum slows. Smart money begins to sell off their holdings to the less informed public who are eagerly buying, driven by greed and FOMO. Volume might be high, but price advances become less convincing. Sentiment is overly optimistic, bordering on irrational exuberance.
- Markdown Phase (Downtrend): Following distribution, selling pressure overwhelms buying interest. Prices begin to fall, often sharply. This is the bear market phase. Initially, many investors might see the decline as a buying opportunity, but as prices continue to fall, fear sets in, leading to panic selling. Investor sentiment shifts from cautiousness to fear and eventually to capitulation.
Identifying Market Cycle Phases
Recognizing the current phase of a market cycle requires a combination of technical analysis, fundamental analysis, and sentiment monitoring.
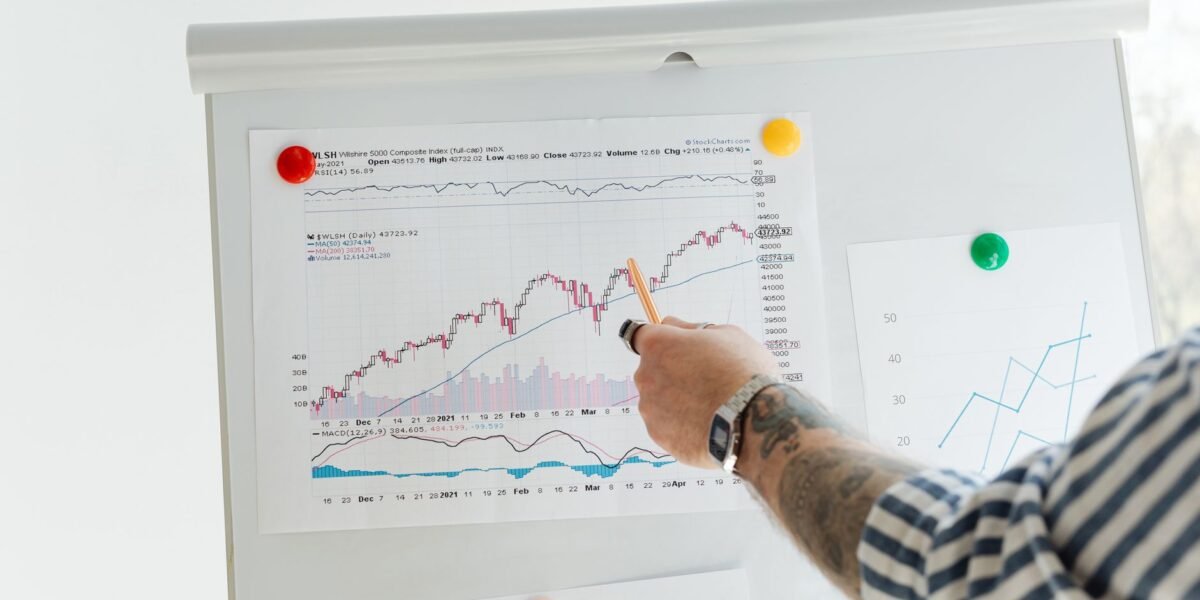
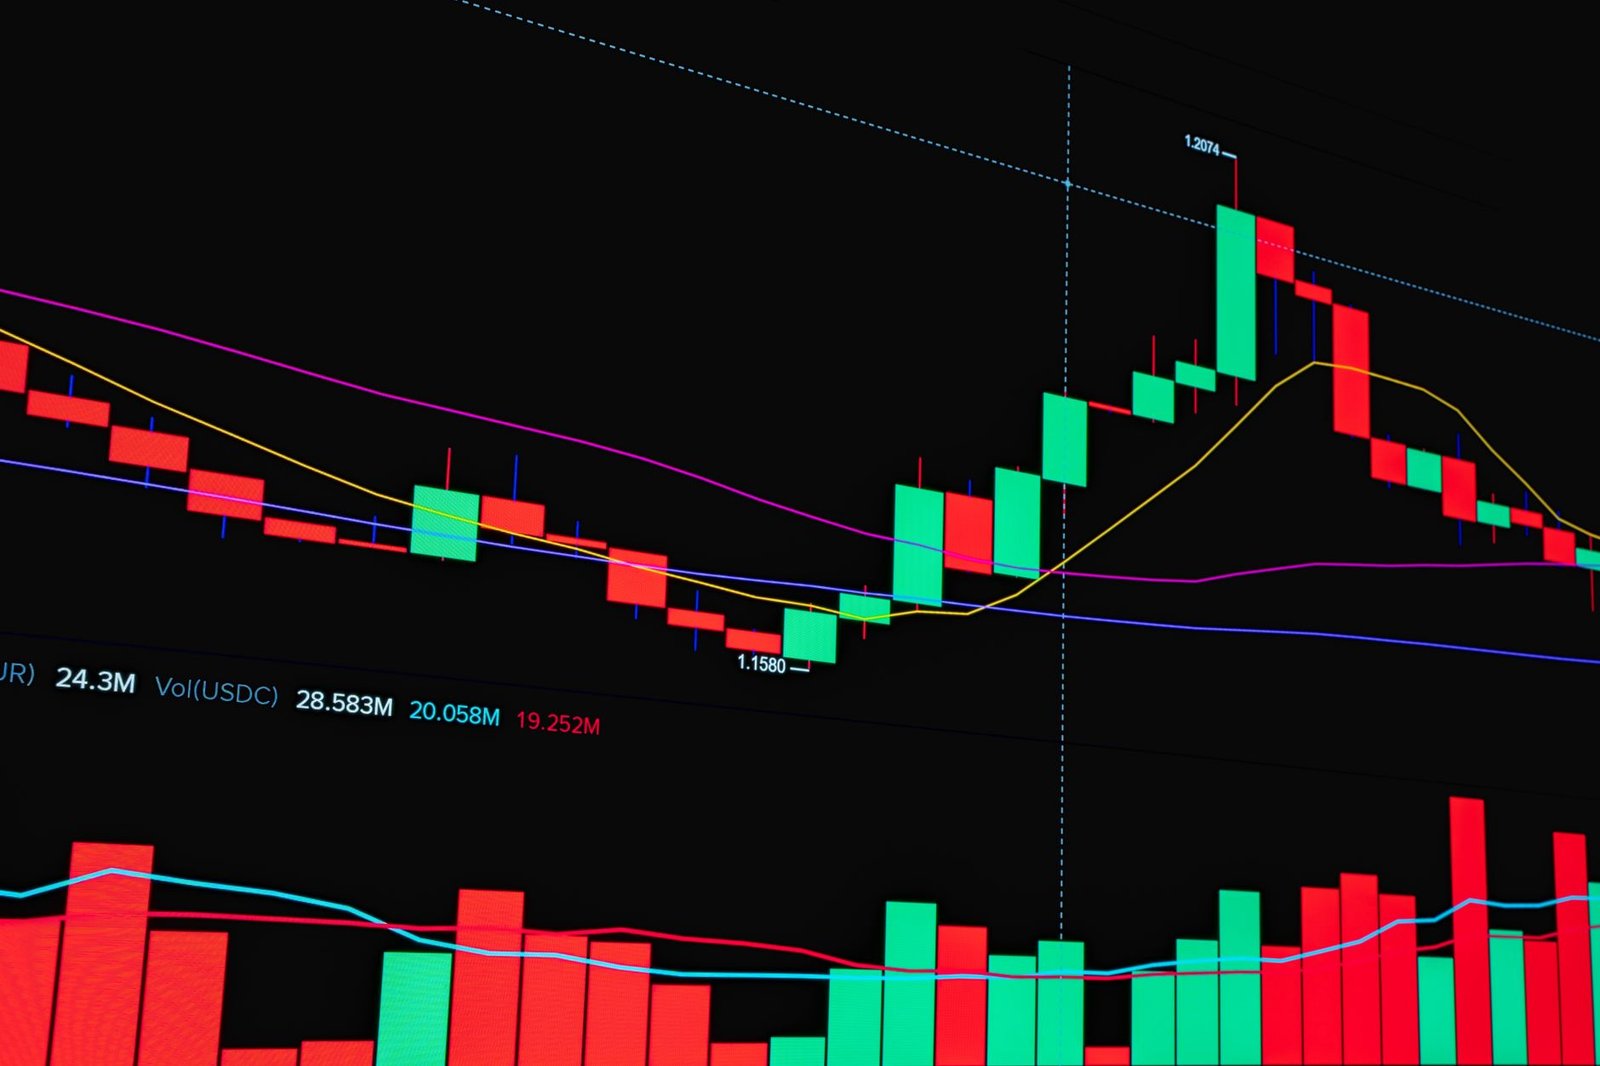
Technical indicators are invaluable here. For example, a market in the accumulation phase might show prices consolidating within a range, with increasing volume on up-days and decreasing volume on down-days. In the markup phase, prices would be making higher highs and higher lows, supported by rising moving averages. Distribution might be indicated by divergences between price and volume, or by sharp reversals on high volume. The markdown phase is characterized by lower highs and lower lows, with moving averages turning downwards. Fundamental factors like GDP growth, inflation rates, interest rate policies from the RBI, and corporate earnings reports also provide clues about the broader economic environment that influences these cycles.
Technical Indicators for Cycle Identification
Specific technical indicators can help pinpoint the current market cycle phase.
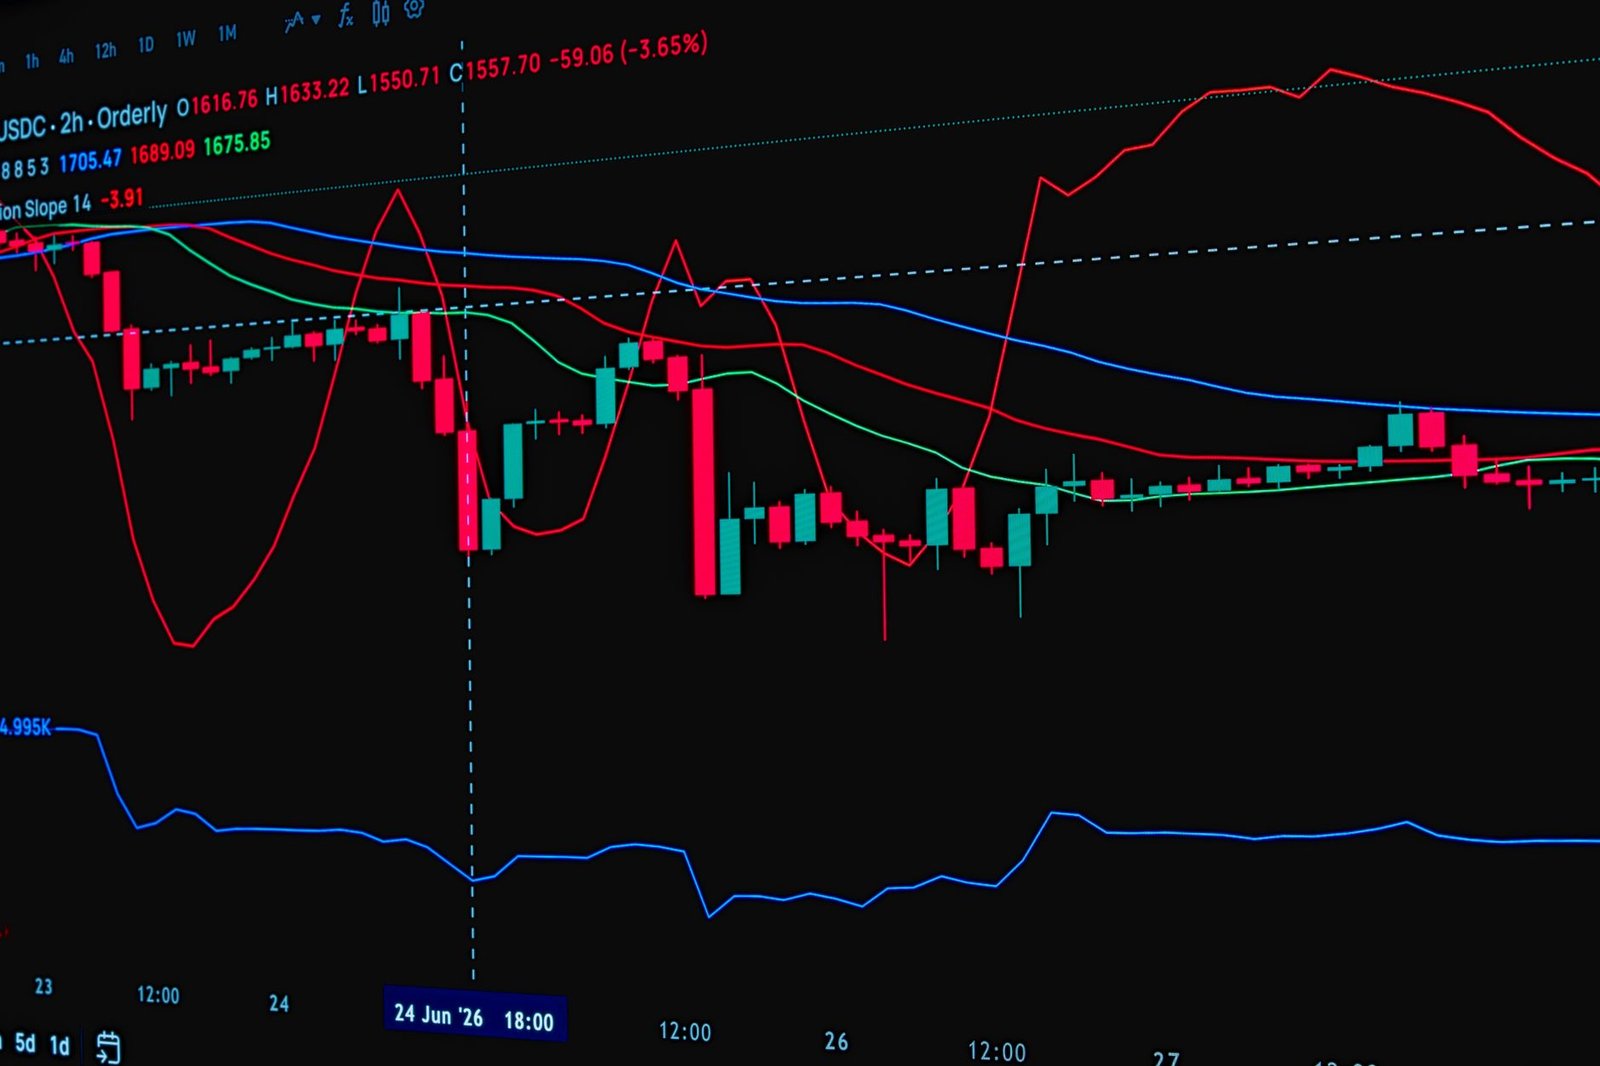
- Moving Averages: A rising market is often characterized by prices trading above their key moving averages (e.g., 50-day, 200-day), with the shorter-term average above the longer-term one. The opposite is true for a falling market.
- Relative Strength Index (RSI): While primarily an overbought/oversold indicator, RSI can also show trend strength. Consistently high RSI readings (above 60) can indicate a strong uptrend, while consistently low readings (below 40) suggest a downtrend.
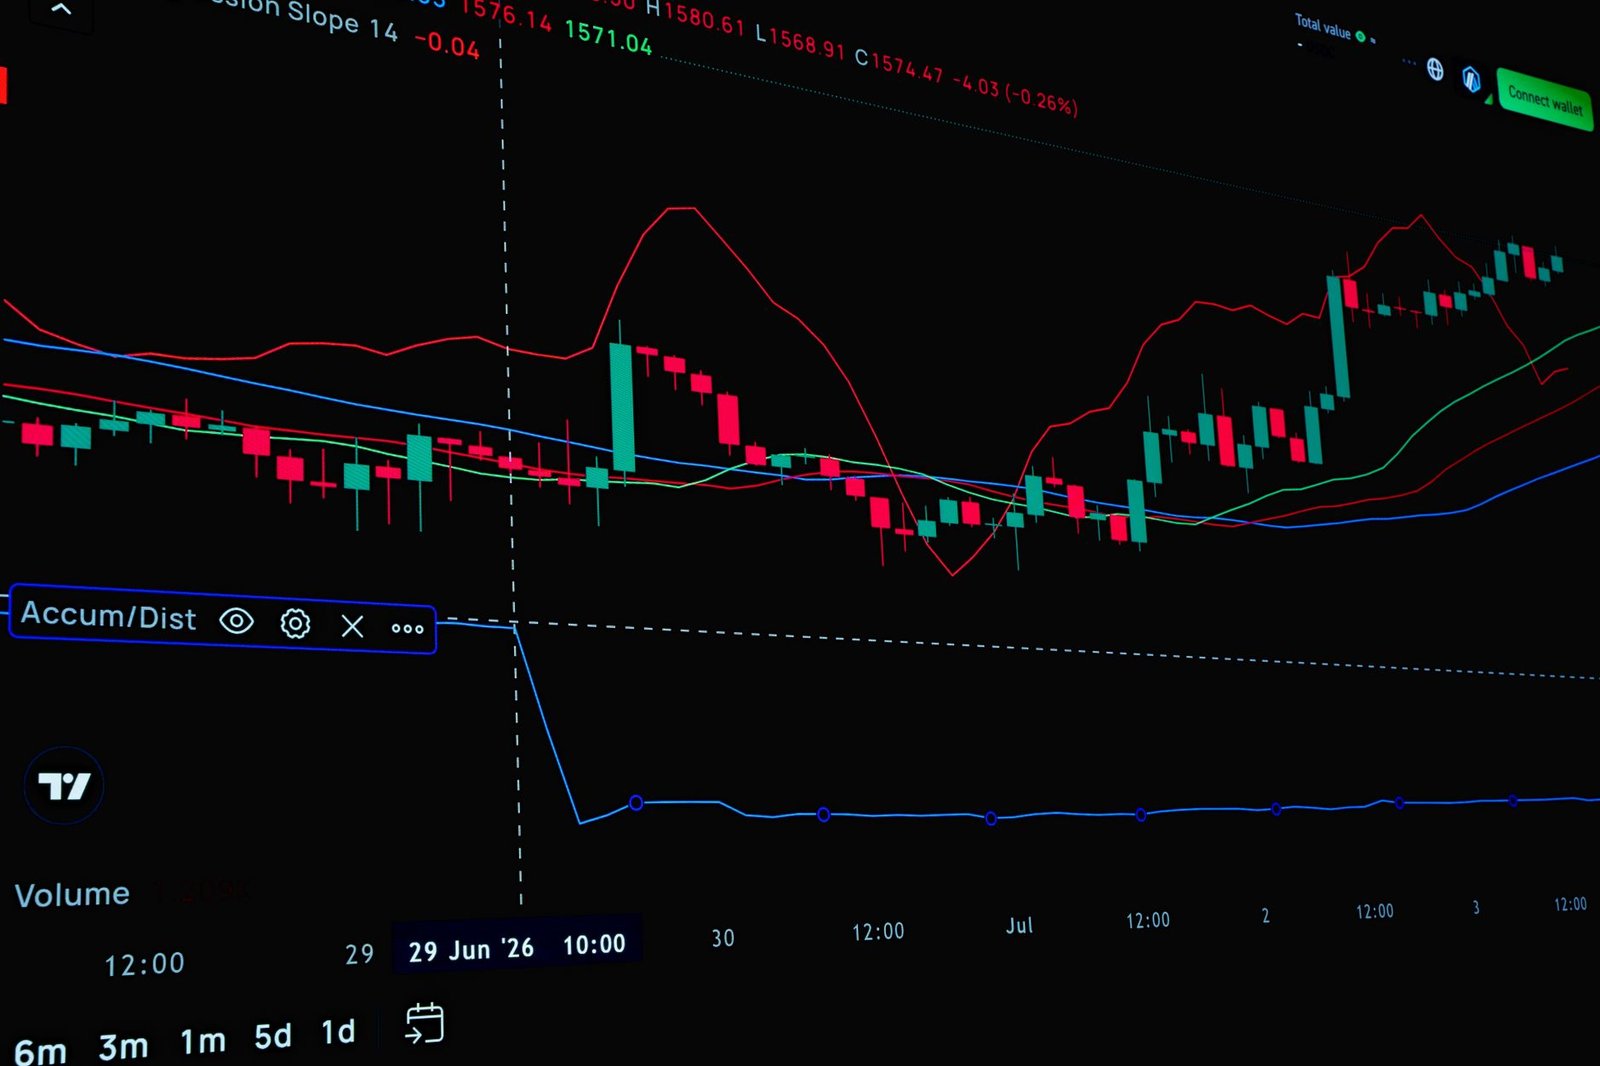
- Volume: Increasing volume on up-moves and decreasing volume on down-moves is bullish (accumulation/markup). Conversely, increasing volume on down-moves and decreasing volume on up-moves is bearish (distribution/markdown).
- Price Action Patterns: Chart patterns like head and shoulders (top reversal) or inverse head and shoulders (bottom reversal) are classic indicators of potential cycle shifts.
How to Trade Market Cycles on NSE and BSE
Trading market cycles effectively involves adapting your strategy to the prevailing phase, focusing on trend-following during markup and markdown, and range-bound or reversal strategies during accumulation and distribution.
Here’s a practical approach for traders:
- Identify the Overall Trend: Use long-term charts (weekly, monthly) and indicators like the 200-day moving average to determine if the broader market (e.g., Nifty 50, Sensex) is in an uptrend or downtrend.
- Confirm the Current Phase: Analyze shorter-term price action, volume, and sentiment indicators to ascertain whether you are in accumulation, markup, distribution, or markdown. Look for confirmation from multiple indicators.
- Adapt Your Strategy: If in markup, focus on buying stocks that are showing strong uptrend characteristics, perhaps using a ‘buy on dips’ approach. If in markdown, consider short-selling or staying in cash/defensive assets. For accumulation, look for potential breakout candidates or value plays. For distribution, be cautious about chasing high prices and consider taking profits.
- Manage Risk: Always use stop-losses to protect capital, especially when the market sentiment is uncertain or volatile. Adjust stop-loss levels based on the cycle phase and volatility.
- Focus on Sectors: Different sectors perform better in different cycle phases. Technology and consumer discretionary often do well in uptrends, while utilities and consumer staples might be more resilient in downtrends.
- Monitor Economic Indicators: Keep an eye on macroeconomic data releases and central bank (RBI) policy statements, as these can significantly influence the direction and duration of market cycles.
- Review and Rebalance: Regularly review your portfolio and trading positions. Be prepared to exit positions that no longer align with the current market cycle and reallocate capital accordingly.
Common Mistakes to Avoid When Trading Cycles
Traders often make predictable errors, such as trying to perfectly time market tops and bottoms or ignoring the prevailing trend.
One of the most common pitfalls is the temptation to ‘catch a falling knife’ – buying an asset simply because its price has dropped significantly, without waiting for confirmation of a bottom or trend reversal. Similarly, many traders try to short a market that is in a strong uptrend, hoping to catch the ‘top’, only to suffer substantial losses. Another mistake is failing to adjust position sizing and risk management according to the perceived cycle phase. Aggressive position sizing might be suitable in a strong markup phase, but it’s extremely risky during volatile distribution or markdown phases. Sticking to a rigid strategy regardless of the market cycle is a recipe for failure. Remember, the market is dynamic, and your approach must be too.
The Role of Investor Sentiment
Investor sentiment, the collective attitude of investors towards the market or a specific security, plays a pivotal role in driving market cycles.
Sentiment acts as a powerful lubricant (or brake) for market cycles. During the early stages of an uptrend (accumulation), sentiment is often skeptical or indifferent. As prices rise and confidence grows, optimism takes hold, driving more buying (markup). Euphoria can set in at the peak, with everyone seemingly a winner, leading to unsustainable valuations (distribution). When the downturn begins, initial caution quickly turns to fear and panic selling (markdown). Tools like the VIX (India VIX on NSE) or surveys gauging investor optimism can offer clues about prevailing sentiment, helping traders gauge potential turning points. A market driven by extreme sentiment, either overly bullish or bearish, is often ripe for a reversal.
Market Cycles and Economic Fundamentals
While sentiment drives short-term fluctuations, underlying economic fundamentals often shape the longer-term trajectory of market cycles.
The health of the broader economy is a significant backdrop for market cycles. Periods of strong economic growth, low inflation, and supportive monetary policy typically foster bull markets. Conversely, recessions, high inflation, and tight monetary policy often coincide with or trigger bear markets. For instance, the RBI’s monetary policy decisions on interest rates can significantly impact borrowing costs for businesses and consumers, influencing corporate profitability and overall economic activity, thus affecting stock market cycles. Analyzing GDP growth, inflation trends, employment data, and industrial production provides a fundamental perspective on the environment in which market cycles unfold.

Frequently Asked Questions
What is the main goal of understanding market cycles?
The main goal is to align your trading or investment strategy with the prevailing market trend, aiming to buy during uptrends and sell during downtrends to maximize profits and minimize losses.
Can market cycles be predicted with certainty?
No, market cycles cannot be predicted with absolute certainty. They are patterns that repeat with variations, and external events can always disrupt them. They offer a framework for understanding probabilities.
Which is the best phase to enter the market?
The accumulation phase is often considered the best time to enter, as prices are relatively low and the potential for upside is significant. However, identifying this phase definitively can be challenging.
How long do market cycles typically last?
Cycle durations vary greatly. Bull markets can last for years, while bear markets are often shorter but can be more severe. Specific phases within a cycle also have inconsistent lengths.
Are market cycles the same across all asset classes?
While the underlying drivers (like economic conditions) are similar, the timing and magnitude of cycles can differ significantly between asset classes like stocks, bonds, commodities, and real estate.
What’s the difference between a bull market and a bear market?
A bull market is characterized by rising prices and widespread optimism, typically lasting months or years. A bear market is characterized by falling prices and prevailing pessimism, often with a decline of 20% or more from recent highs.
Key Takeaways:
- Market cycles are recurring patterns of expansion and contraction driven by investor sentiment and economic factors.
- The four main phases are accumulation, markup, distribution, and markdown.
- Technical indicators (moving averages, RSI, volume) and price action patterns help identify cycle phases.
- Adapting trading strategies (buy on dips in uptrends, caution in downtrends) is crucial.
- Avoid common mistakes like trying to time tops/bottoms perfectly or ignoring the trend.
- Investor sentiment and economic fundamentals play key roles in shaping cycles.
- Understanding cycles improves decision-making for NSE and BSE traders.
Trading in the securities market is subject to market risks. Please read all the related documents carefully before investing. Investments in securities market are subject to market risks, read all the related documents carefully before investing.






 Finovatives