


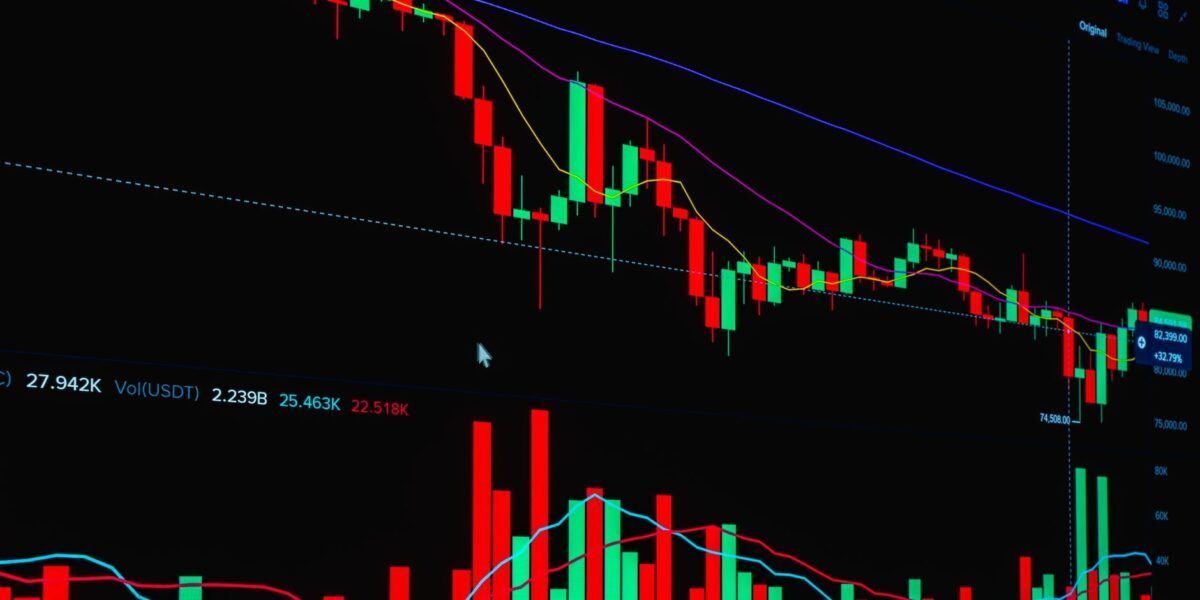
TL;DR: Moving average crossover strategies are a popular technical analysis tool for Indian stock traders, using the intersection of two moving averages to signal potential trend changes and entry/exit points for NSE and BSE stocks.
Key Stats at a Glance:
- Nifty 50 has historically shown average annual returns of approximately 12-15% over the long term.
- Over 5,000 stocks are listed across NSE and BSE combined.
- Moving averages can smooth out price action by 15-30% on average, revealing underlying trends.
- A 50-day SMA crossing above a 200-day SMA (Golden Cross) has historically preceded significant bull runs in many markets.
- The average retail investor in India often participates in trading with capital ranging from ₹10,000 to ₹1,00,000.
What is a Moving Average Crossover Strategy?
A moving average crossover strategy is a trading system that generates buy or sell signals when a shorter-term moving average crosses above or below a longer-term moving average, indicating a potential shift in market momentum.
This is one of the most widely adopted technical analysis techniques among Indian retail traders and investors, primarily because it’s relatively simple to understand and implement. At its core, it aims to capture the essence of a trend by smoothing out price fluctuations. The intersection of two moving averages – typically one with a shorter period (e.g., 20-day, 50-day) and another with a longer period (e.g., 50-day, 200-day) – serves as the primary signal generator. When the faster (shorter-term) average crosses above the slower (longer-term) average, it’s often interpreted as a bullish signal, suggesting the price momentum is strengthening and a potential uptrend is beginning. Conversely, when the faster average crosses below the slower average, it’s seen as a bearish signal, indicating weakening momentum and a potential downtrend. These signals can help traders identify potential entry and exit points for their trades on Indian exchanges like the NSE and BSE.
The effectiveness of these strategies can vary depending on the chosen moving average periods, the specific stock or index being traded, and overall market conditions. Finovatives.com’s proprietary Trend Traders Tool, for instance, leverages advanced algorithms to enhance the reliability of such signals.
How Do Moving Average Crossovers Work in Indian Markets?
Moving average crossovers work by using the price-smoothing effect of moving averages to identify potential trend reversals or continuations in Indian stocks listed on the NSE and BSE.
The principle is straightforward: a shorter-term moving average reacts more quickly to recent price changes, while a longer-term moving average reflects the broader, more established trend. When the shorter-term average, representing current sentiment, moves to cross the longer-term average, which represents historical sentiment, it signals a potential shift. A bullish crossover, where the short-term MA rises above the long-term MA, suggests that recent buying pressure is strong enough to overcome the prevailing longer-term trend, potentially initiating an uptrend. A bearish crossover, where the short-term MA falls below the long-term MA, implies that recent selling pressure is dominant, potentially leading to a downtrend. These signals are crucial for traders looking to time their entries and exits effectively in the dynamic Indian stock market.

Simple Moving Average (SMA) vs. Exponential Moving Average (EMA)
While both SMA and EMA are used in crossover strategies, EMAs give more weight to recent prices, making them more responsive to current market movements, whereas SMAs give equal weight to all data points in the period.
Understanding SMA
The Simple Moving Average (SMA) is calculated by summing up the closing prices of a security over a specific number of periods and then dividing by the number of periods. For example, a 20-day SMA is the average closing price of the last 20 days. It provides a smoothed representation of price action but can lag behind significant price changes.
Understanding EMA
The Exponential Moving Average (EMA) is also a type of moving average that places a greater emphasis on recent price data. It is calculated using a smoothing factor that reduces the weight of older data points. This makes the EMA more sensitive to recent price fluctuations compared to the SMA, potentially generating earlier signals but also possibly more false signals in choppy markets.
Choosing Between SMA and EMA
The choice between SMA and EMA for crossover strategies often depends on a trader’s style and the market conditions. Traders seeking earlier signals, especially in fast-moving markets, might prefer EMA crossovers. Those who prefer a smoother, more confirmed trend signal and are willing to accept slightly later entry points might opt for SMA crossovers. Many successful traders experiment with both on platforms like TradingView, often using indicators available through Finovatives.com, to see which performs best for their chosen assets.
Popular Moving Average Crossover Pairs
Commonly used pairs in moving average crossover strategies involve combinations of short-term and long-term averages, with the 50-day and 200-day averages being particularly significant for identifying major trend shifts.
The selection of moving average periods is critical. While there’s no universally “best” combination, several pairs have gained popularity due to their historical effectiveness in various market conditions on Indian exchanges. The most discussed pair is the 50-day SMA and the 200-day SMA. A crossover where the 50-day SMA moves above the 200-day SMA is known as the ‘Golden Cross’ and is widely considered a strong bullish signal, often preceding significant upward price movements. Conversely, when the 50-day SMA crosses below the 200-day SMA, it’s termed the ‘Death Cross’ and is viewed as a strong bearish signal, potentially indicating the start of a substantial decline.
Other popular combinations include:
- Short-term crossovers: 5-day EMA and 20-day EMA, or 10-day SMA and 30-day SMA. These are used for capturing shorter-term trends and are often employed by more active traders.
- Medium-term crossovers: 20-day SMA and 50-day SMA, or 30-day EMA and 90-day EMA. These strike a balance between responsiveness and trend confirmation, suitable for swing traders.
The effectiveness of these pairs can be amplified when used in conjunction with other technical indicators, providing a more robust trading strategy.
The Significance of the Golden Cross and Death Cross
The Golden Cross occurs when a shorter-term moving average crosses above a longer-term moving average, signalling a potential uptrend and is historically a strong bullish indicator.
The Death Cross, conversely, happens when a shorter-term moving average crosses below a longer-term moving average, signalling a potential downtrend and is considered a bearish indicator.
What is a Golden Cross?
A Golden Cross is a bullish technical signal indicating that a significant upward price movement may be forthcoming. It is typically identified when the 50-day SMA moves above the 200-day SMA on a stock’s price chart. This pattern is seen as a confirmation of a strengthening uptrend and is often a trigger for long entry positions.
What is a Death Cross?
A Death Cross is a bearish technical signal suggesting that a significant downward price movement may be imminent. It occurs when the 50-day SMA crosses below the 200-day SMA. This signal is interpreted as a confirmation of a weakening trend or the start of a new downtrend, often prompting traders to consider selling or shorting.
Developing a Moving Average Crossover Trading Plan
A well-defined trading plan incorporating moving average crossovers involves selecting appropriate moving average periods, defining entry and exit rules, setting stop-loss levels, and managing risk effectively for trades in Indian stocks.
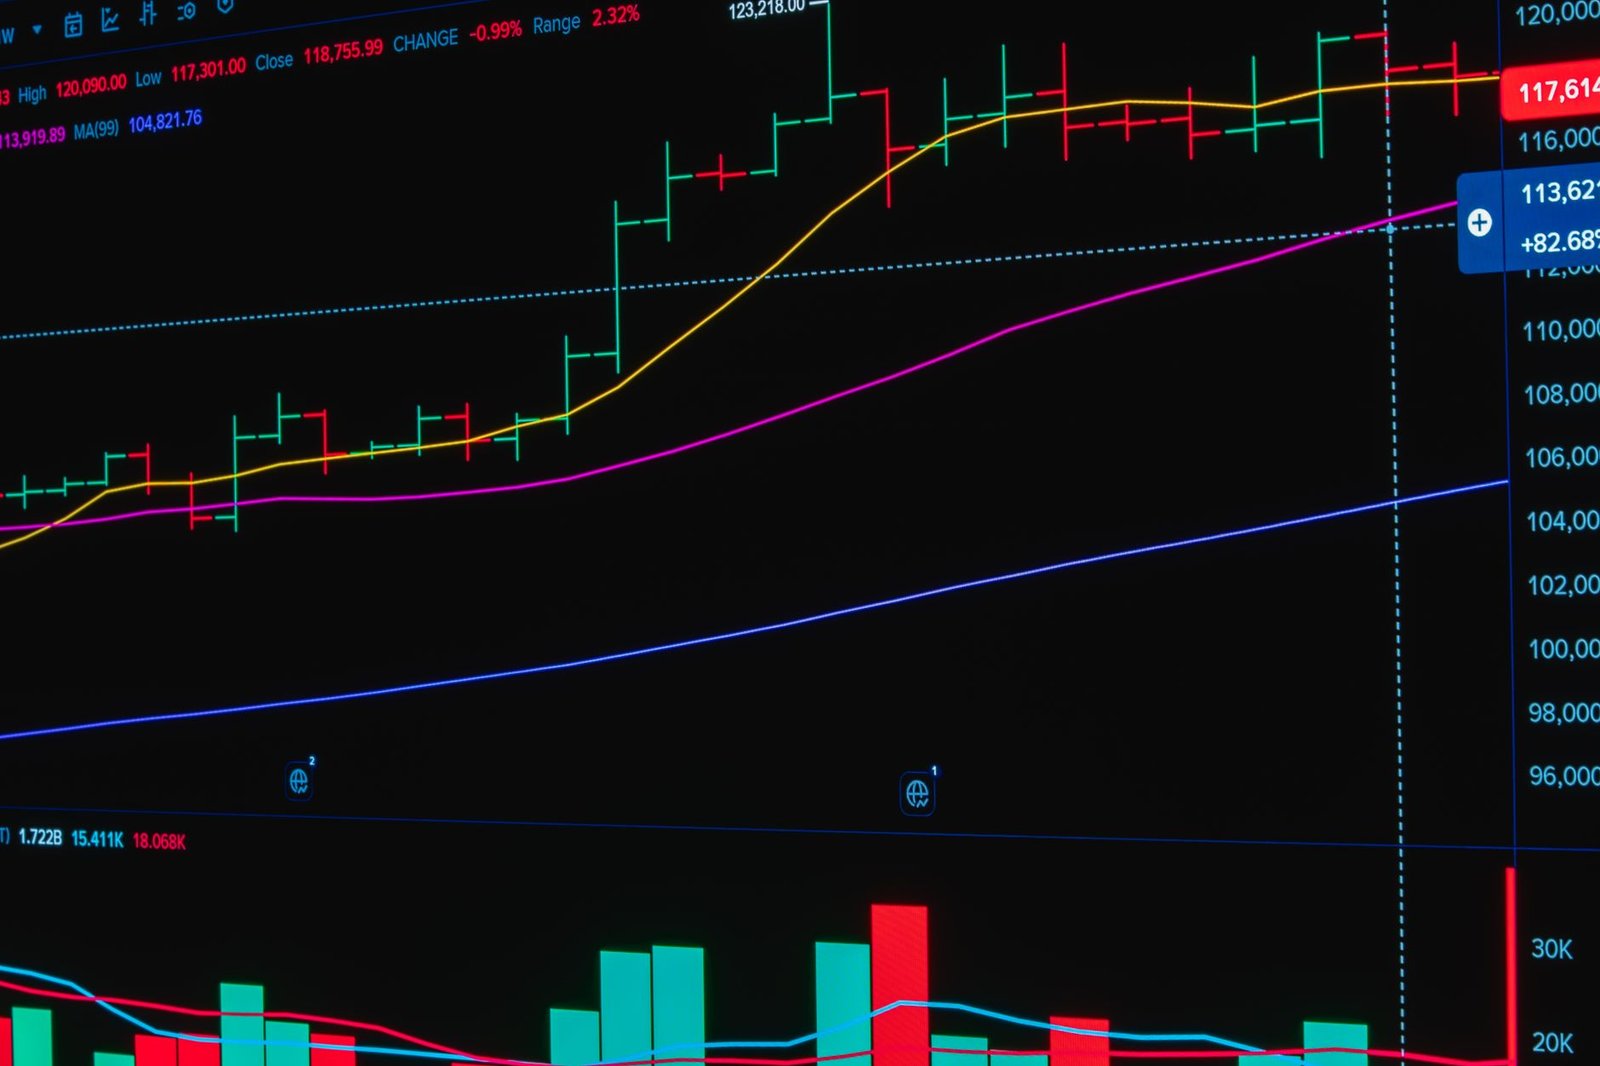
Simply observing a crossover is rarely sufficient for a profitable trading strategy. A robust plan is essential. This begins with selecting the moving average periods that best suit your trading style and the specific asset you are trading. Shorter periods offer more frequent signals but can lead to more false positives, while longer periods provide fewer signals but are generally more reliable for confirming major trends. Backtesting these combinations on historical data is crucial. For instance, testing a 20-day/50-day EMA crossover on a specific Nifty 50 stock over the past five years can reveal its historical performance.
Next, establish clear entry and exit criteria. For a bullish crossover, an entry might be confirmed only after the price closes above the longer-term moving average for a specific period. For exits, a predetermined profit target or a trailing stop-loss based on a certain percentage or a moving average itself can be used. Stop-loss orders are non-negotiable for risk management; they limit potential losses if the trade moves against you. A common practice is to place a stop-loss a certain percentage below the entry price or below a key support level indicated by the moving averages.
How to Implement a Moving Average Crossover Strategy
- Choose Your Moving Averages: Select the periods for your short-term and long-term moving averages (e.g., 20-day EMA and 50-day SMA).
- Identify Crossover Signals: Monitor price charts for instances where the shorter-term average crosses the longer-term average.
- Confirm Bullish Signals: For a buy signal (short MA crosses above long MA), wait for a confirmation, such as the price closing above the longer MA or a subsequent bullish candlestick pattern.
- Confirm Bearish Signals: For a sell signal (short MA crosses below long MA), look for confirmation like the price closing below the longer MA or a bearish candlestick pattern.
- Define Entry Point: Enter a long position after a confirmed bullish crossover or a short position after a confirmed bearish crossover.
- Set Stop-Loss: Place a stop-loss order below a recent swing low for long positions or above a recent swing high for short positions to limit potential losses.
- Determine Exit Strategy: Decide on your exit criteria, such as reaching a profit target, a trailing stop-loss, or a reverse crossover signal.
- Review and Adjust: Regularly review your trading performance and adjust parameters or rules as needed based on market conditions.
Advantages and Disadvantages of Crossover Strategies
Moving average crossover strategies offer a systematic, trend-following approach that can be beneficial for identifying potential trading opportunities, but they are also prone to generating false signals in sideways markets and lagging behind sharp price movements.
The primary advantage is their simplicity and objectivity. They provide clear entry and exit signals, reducing the emotional aspect of trading. As trend-following indicators, they can be highly effective in trending markets, allowing traders to capture significant portions of a move. They are also versatile and can be applied to any time frame or asset class, from individual stocks on the NSE and BSE to indices like the Nifty 50.
However, the main drawback is their lagging nature. Moving averages are calculated based on past prices, meaning they cannot predict future movements with certainty. In non-trending, or sideways (ranging) markets, moving averages tend to cross back and forth frequently, generating numerous false signals that can lead to losses. Additionally, a significant price gap or a sudden sharp reversal can cause the crossover signal to appear after the optimal entry or exit point has already passed. This is where tools that offer real-time alerts and predictive analytics, like those provided by Finovatives.com, can offer an edge.

When Do Crossovers Work Best?
Crossover strategies tend to perform best in clearly trending markets, whether upward or downward, where price movements are sustained and directional.
When Do Crossovers Fail?
Crossovers often fail or produce poor results in choppy, range-bound, or sideways markets where prices fluctuate without establishing a clear directional trend.
Frequently Asked Questions
What are the best moving average periods for Indian stocks?
There is no single ‘best’ combination. Common effective pairs for Indian stocks include 20/50, 50/200 for SMAs or EMAs. Shorter periods like 9/21 are used for short-term trading, while longer periods like 50/200 are for longer-term trends. Experimentation and backtesting are key.
Can moving average crossovers be used on all timeframes?
Yes, moving average crossovers can be applied to any timeframe, from intraday charts (e.g., 5-minute, 15-minute) to daily, weekly, or even monthly charts. The choice of timeframe depends on the trader’s strategy and objectives.
How do I avoid false signals with moving average crossovers?
False signals are common in ranging markets. To mitigate them, traders often use confirmation from other indicators (like RSI or MACD), wait for price action confirmation after the crossover, or use longer-term moving averages which are less prone to whipsaws.
Are moving average crossovers profitable on their own?
While profitable, moving average crossovers are rarely used in isolation. They are most effective when combined with other technical analysis tools, risk management techniques, and a well-defined trading plan to improve accuracy and profitability.
What is a triple moving average strategy?
A triple moving average strategy uses three moving averages (e.g., short, medium, and long-term) to generate signals. For example, a buy signal might be generated only when the short-term MA is above the medium-term MA, and the medium-term MA is above the long-term MA, providing stronger trend confirmation.
Key Takeaways
- Moving average crossovers are a popular technical analysis tool for identifying potential trend changes in Indian stock trading.
- The intersection of a shorter-term moving average with a longer-term moving average generates bullish (buy) or bearish (sell) signals.
- Common pairs include 50/200-day SMAs (Golden Cross/Death Cross), but other combinations like 20/50 are also widely used.
- Moving averages are lagging indicators and work best in trending markets; they can produce false signals in sideways markets.
- Developing a comprehensive trading plan with clear entry/exit rules, stop-losses, and risk management is crucial for success.
- Combining crossover signals with other indicators and price action analysis can enhance trading strategy effectiveness.
Trading in securities, including equities, commodities, and derivatives, involves significant risk and is not suitable for all investors. Past performance is not indicative of future results. Invest wisely after consulting with your financial advisor and conducting your own thorough research.





 Finovatives