TL;DR: A breakout trading strategy for Nifty and Bank Nifty focuses on identifying and capitalizing on decisive price movements beyond established support or resistance levels, aiming to capture the subsequent trend with robust risk management.
Key Stats at a Glance:
- Nifty 50 Average Daily Range (ADR): ~120-150 points (as of early 2024)
- Bank Nifty Average Daily Range (ADR): ~300-400 points (as of early 2024)
- NSE Futures & Options Segment: Over 1.5 million average daily turnover
- Historical Volatility: Bank Nifty often exhibits 1.5x-2x the volatility of Nifty 50
- Successful Breakouts: Historically, roughly 30-40% of price breakouts lead to sustained trends
What is Breakout Trading?
Breakout trading is a strategy where traders aim to profit from the significant price movement that occurs when a stock or index moves beyond a defined price level, such as support, resistance, or a chart pattern.
This strategy is predicated on the idea that when a price breaks through a significant barrier, it signals a shift in market sentiment and the potential for a sustained directional move. Traders using this method look for confirmation signals to validate the breakout, aiming to enter positions just as the new trend begins, thereby maximizing their potential profit while managing risk.
The Psychology Behind Breakouts
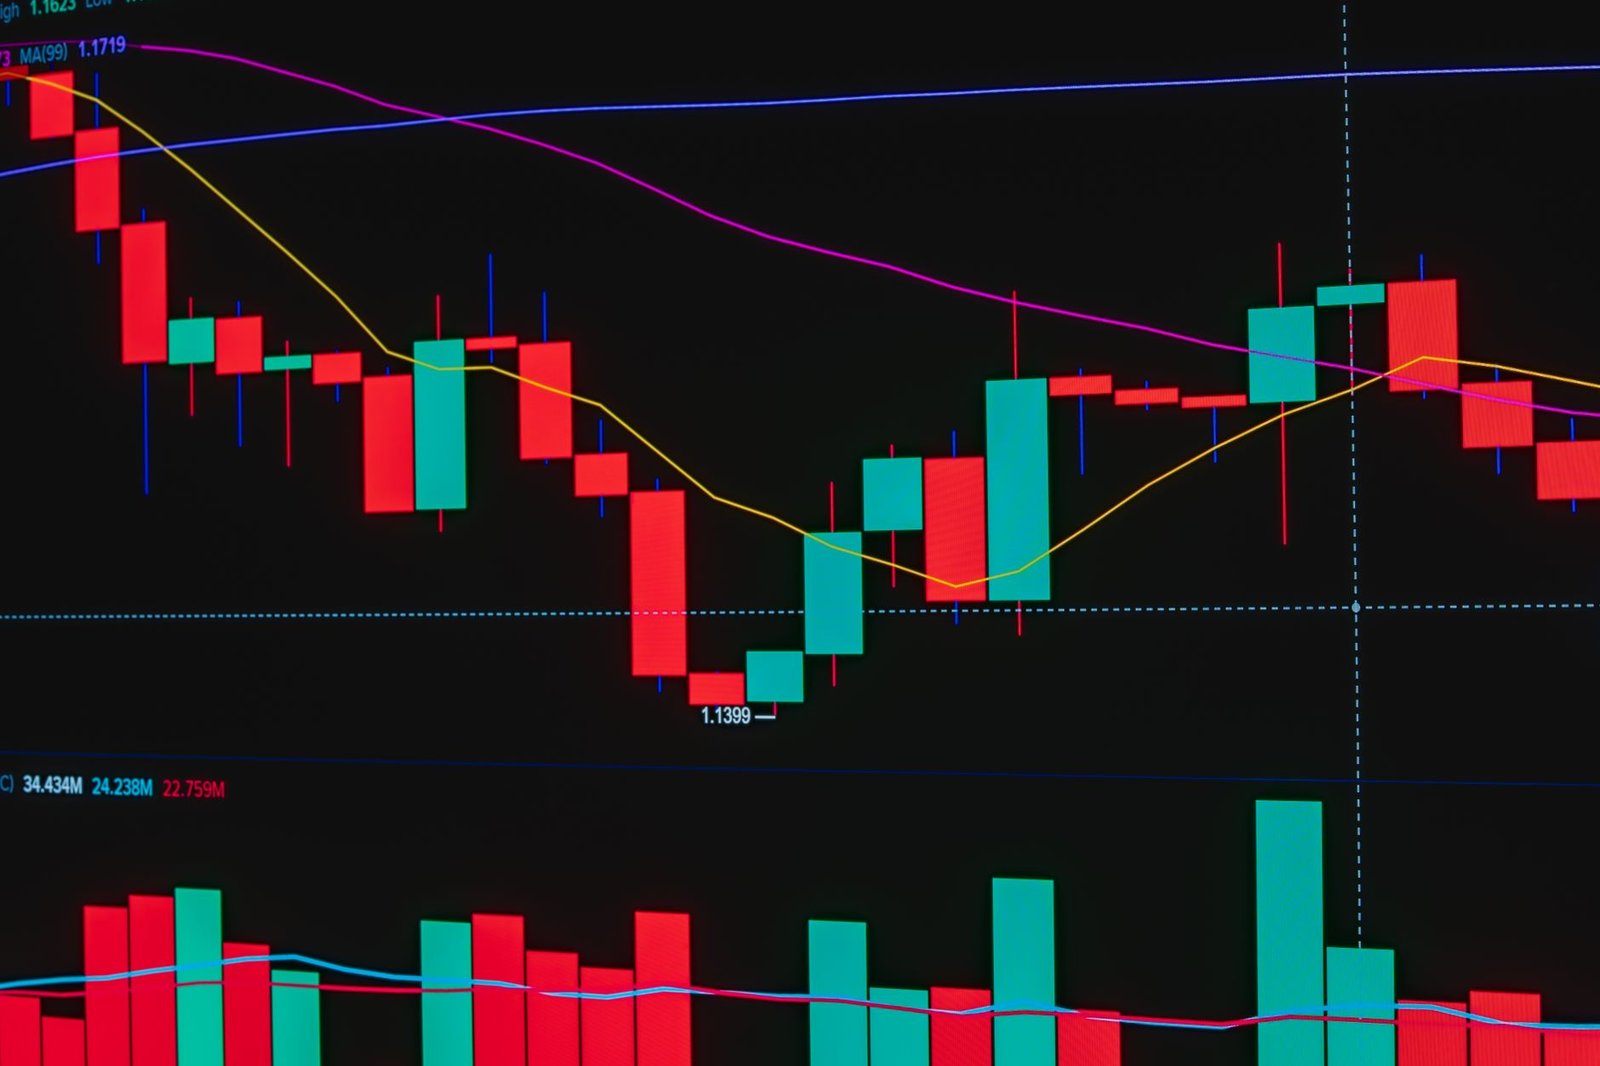
Breakouts often occur when a large number of traders have been positioned on one side of a trading range, and a sudden surge in volume or news catalyst forces them to exit their positions. This forced exit, or ‘short covering’/’long liquidation’, can create a snowball effect, driving the price rapidly in the direction of the breakout. Understanding this underlying psychology helps traders anticipate and react to potential breakout scenarios.
Types of Breakouts
Breakouts can be categorized based on the price pattern they emerge from. Common patterns include:
- Range Breakouts: Price moving decisively above resistance or below support after consolidating within a defined horizontal channel.
- Chart Pattern Breakouts: Price breaking out of classic technical patterns like triangles (symmetrical, ascending, descending), flags, pennants, wedges, head and shoulders, and double tops/bottoms.
- Moving Average Breakouts: Price closing decisively above or below a key moving average (e.g., 50-day, 200-day) that has previously acted as dynamic support or resistance.
False Breakouts (Fakeouts)
A significant challenge in breakout trading is the occurrence of ‘false breakouts’ or ‘fakeouts’, where the price briefly moves beyond the breakout level but quickly reverses, trapping breakout traders. These often occur on lower volume or are driven by algorithmic trading that is quickly unwound. Identifying fakeouts requires careful analysis of volume and subsequent price action.
Why Trade Breakouts in Nifty and Bank Nifty?
Nifty and Bank Nifty, being the flagship indices of the Indian stock market, offer significant opportunities for breakout traders due to their high liquidity, volatility, and the availability of robust technical data. Their movements often set the tone for the broader market, making them prime candidates for strategies that aim to capture strong directional trends.
The sheer volume and participation in Nifty and Bank Nifty futures and options segments mean that breakouts can be swift and substantial, offering ample profit potential. Furthermore, the well-defined support and resistance levels, coupled with readily available charting tools like those on TradingView, make it easier to spot potential breakout setups.
Liquidity and Volume Advantages
The high trading volumes in Nifty and Bank Nifty ensure that orders can be executed quickly and efficiently at desired prices, minimizing slippage. This is crucial for breakout traders who need to enter and exit positions rapidly to capitalize on the momentum. High volume also lends more credibility to a breakout signal.
Volatility for Profit Potential
While volatility can increase risk, it also creates opportunities. Bank Nifty, in particular, is known for its sharp price swings, often driven by news related to the banking sector. This inherent volatility can lead to explosive price movements once a breakout occurs, allowing traders to achieve their profit targets more quickly.
Influence on the Broader Market
The price action in Nifty and Bank Nifty influences investor sentiment and the movement of many individual stocks. Successfully trading breakouts in these indices can provide not only direct profits but also insights into the overall market direction, which can inform trading decisions in other securities.
Key Indicators for Breakout Trading
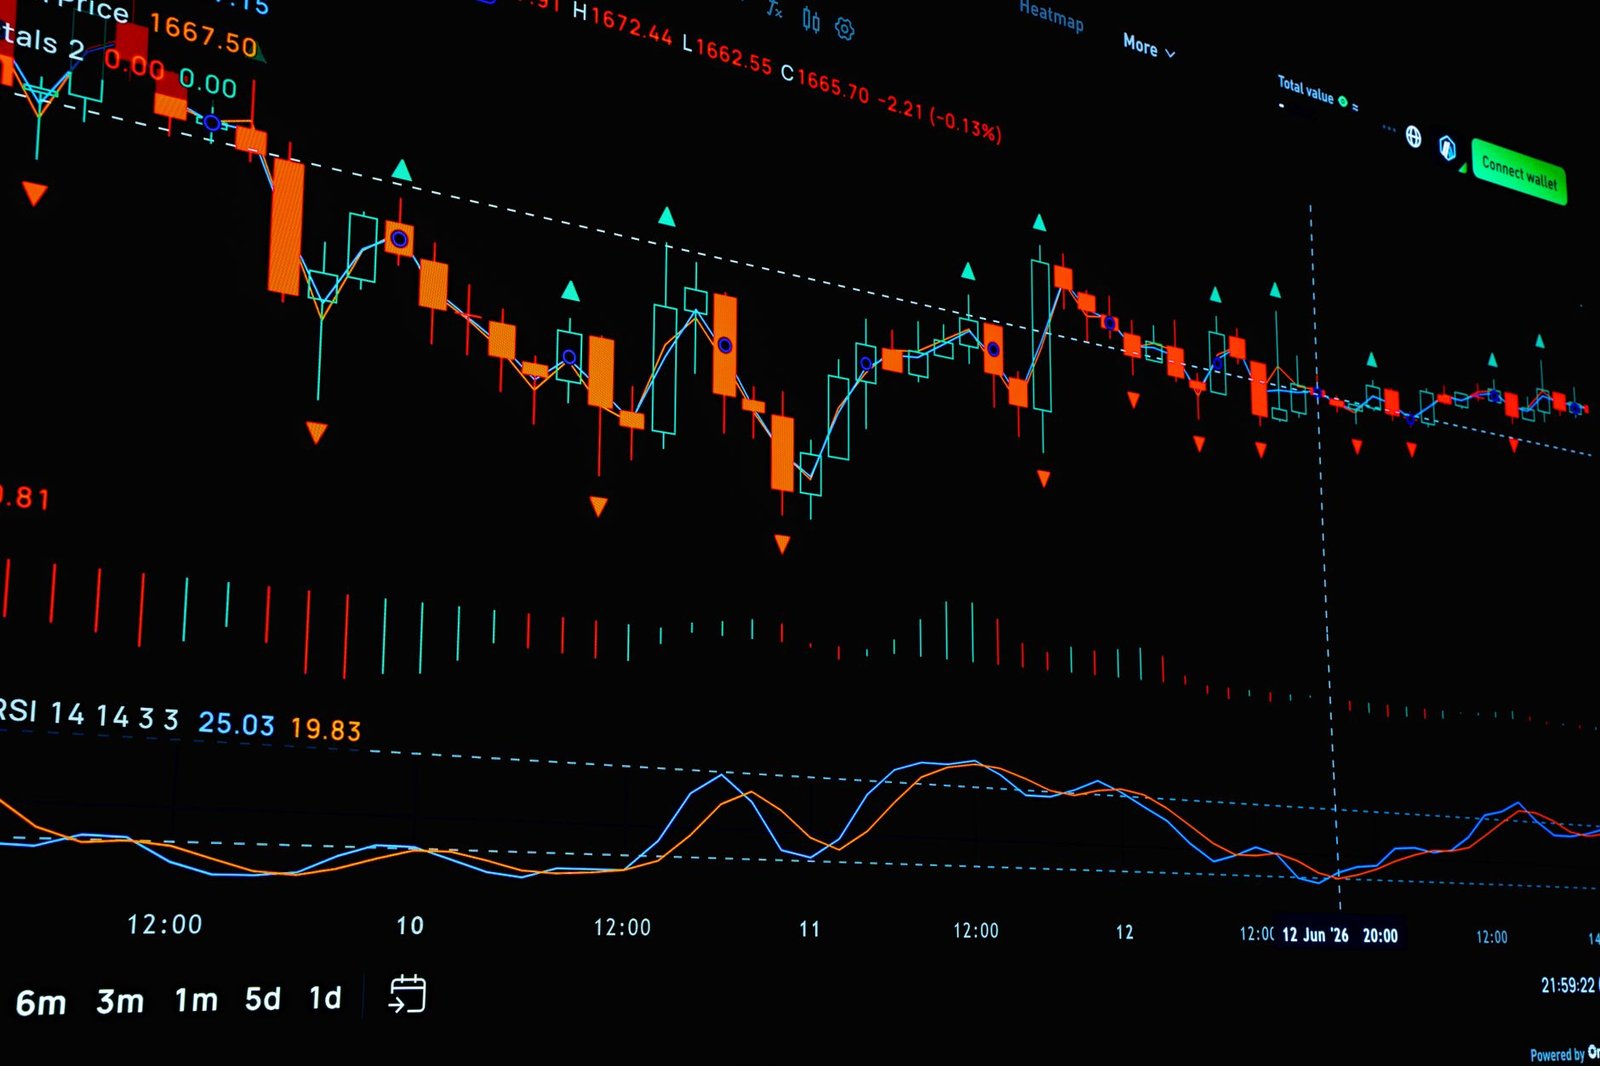
While price action and volume are primary, several technical indicators can help confirm breakout signals and improve trade timing and probability.
These indicators help traders gauge momentum, confirm volume, and identify potential reversals or continuation patterns, thereby adding layers of confirmation to a pure price-based breakout strategy.
Volume Analysis
Volume is arguably the most crucial indicator for confirming breakouts. A breakout accompanied by a significant surge in trading volume suggests strong conviction behind the move. Conversely, a breakout on low volume is often suspect and may signal a fakeout.
Relative Strength Index (RSI)
RSI is a momentum oscillator that measures the speed and change of price movements. During a bullish breakout, RSI typically moves above 60 and ideally stays above 50. For a bearish breakout, it moves below 40 and stays below 50. Divergences between RSI and price can also warn of potential reversals.
Moving Average Convergence Divergence (MACD)
MACD is a trend-following momentum indicator. A bullish signal often occurs when the MACD line crosses above the signal line, and both are above the zero line, especially during an upward breakout. For a bearish breakout, the opposite holds true, with the MACD crossing below the signal line and both lines below zero.
Average True Range (ATR)
ATR measures market volatility. While not a direct breakout confirmation tool, it helps in setting appropriate stop-loss levels. A widening ATR can indicate increasing momentum post-breakout, while a narrowing ATR might suggest consolidation or a potential stall.
Bollinger Bands
Bollinger Bands consist of a middle band (a simple moving average) and two outer bands plotted at standard deviation levels. Breakouts often occur when the price moves decisively outside the upper or lower band, especially after a period of low volatility (the ‘squeeze’).
How to Implement a Breakout Trading Strategy
Implementing a breakout strategy requires a systematic approach, from identifying potential breakouts to managing risk and exiting trades. Here’s a step-by-step guide:
- Identify Consolidation Zones: Look for periods where Nifty or Bank Nifty price is trading within a defined range, forming clear support and resistance levels. This could be a horizontal channel, a triangle, or another chart pattern.
- Monitor Volume: Keep a close eye on trading volume during consolidation. A significant increase in volume as the price approaches the breakout level is a positive sign.
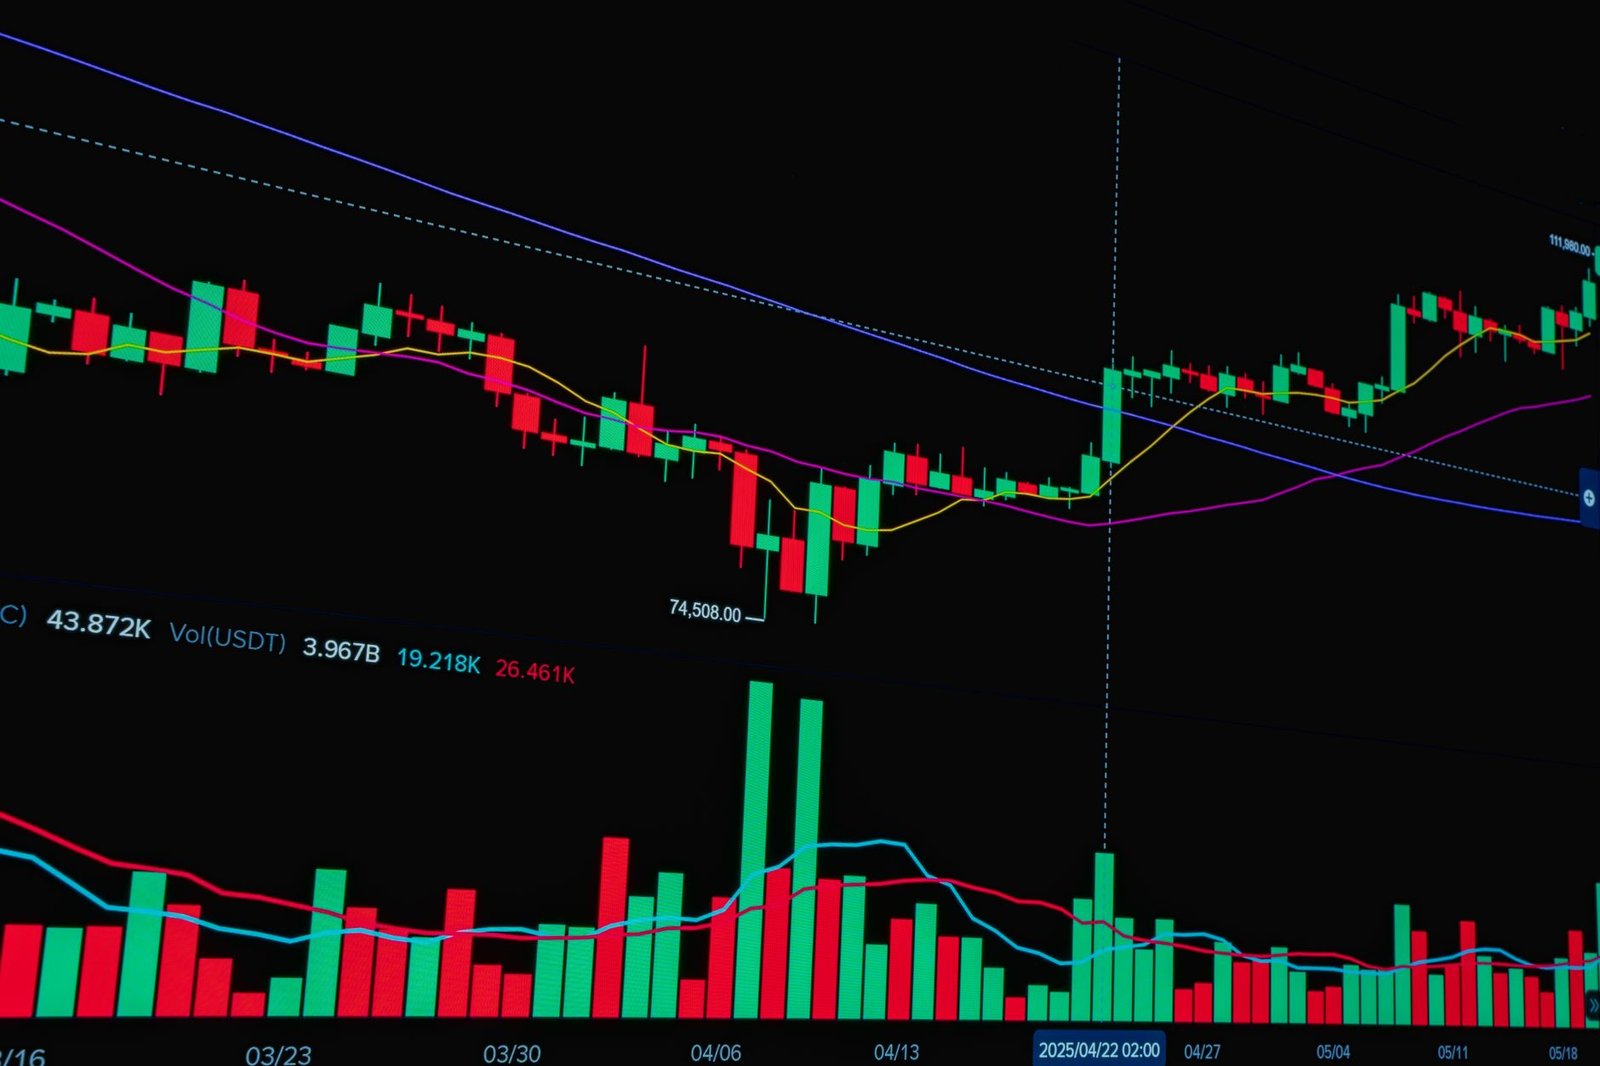
- Wait for Decisive Breakout: Do not anticipate the breakout. Wait for the price to close decisively beyond the support or resistance level on a higher-than-average volume. For intraday, a few minutes’ candle closing beyond the level might suffice; for longer-term, a daily candle close is preferred.
- Entry Point: Enter a long position when the price breaks above resistance, or a short position when it breaks below support. A common entry is on the retest of the broken level, which now acts as support (for long) or resistance (for short).
- Set Stop-Loss: Place a stop-loss order just below the breakout level (for long trades) or just above the breakout level (for short trades). Alternatively, use the ATR multiple or the other side of the breakout pattern.
- Profit Targets: Set realistic profit targets. These can be determined using chart pattern projections, previous significant price levels, or by trailing your stop-loss to lock in profits as the trend progresses.
- Risk Management: Never risk more than 1-2% of your trading capital on a single trade. Ensure your stop-loss is set before entering the trade.
- Review and Adjust: After the trade, review the outcome. Did the breakout succeed or fail? What indicators were present? Use these learnings to refine your strategy for future trades.
Risk Management in Breakout Trading
Breakout trading, while potentially lucrative, carries inherent risks, primarily the risk of false breakouts and the rapid price reversals that can follow. Effective risk management is therefore paramount to preserving capital and ensuring long-term profitability.
Implementing strict risk controls is non-negotiable for surviving and thriving in the volatile markets of Nifty and Bank Nifty breakouts, preventing a single losing trade from derailing your entire trading journey.
The Importance of Stop-Loss Orders
A stop-loss order is a fundamental tool for managing risk in breakout trading. It automatically closes your position if the price moves against you by a predetermined amount, limiting your potential losses. For breakout trades, the stop-loss should typically be placed just beyond the breakout level or a key moving average, allowing some room for minor fluctuations without being stopped out prematurely.
Position Sizing
Position sizing ensures that you do not risk an excessive amount of your capital on any single trade. The amount of capital risked per trade should be a small, fixed percentage of your total trading capital (e.g., 1-2%). This means adjusting the number of lots you trade based on the distance to your stop-loss. A tighter stop-loss allows for a larger position size, while a wider stop-loss necessitates a smaller one.
Understanding Reward-to-Risk Ratio
Before entering a breakout trade, always assess the potential reward relative to the potential risk. Aim for trades where the potential profit (target price minus entry price) is at least 2 or 3 times the potential loss (entry price minus stop-loss price). This 2:1 or 3:1 reward-to-risk ratio helps ensure that your winning trades are sufficiently profitable to cover losses from unsuccessful ones.
Avoiding Over-Trading and Emotional Decisions
The allure of quick profits in breakout trading can lead to over-trading or making impulsive decisions based on fear or greed. Stick to your trading plan, only take high-probability setups, and avoid chasing trades. Patience and discipline are key virtues for successful breakout traders.
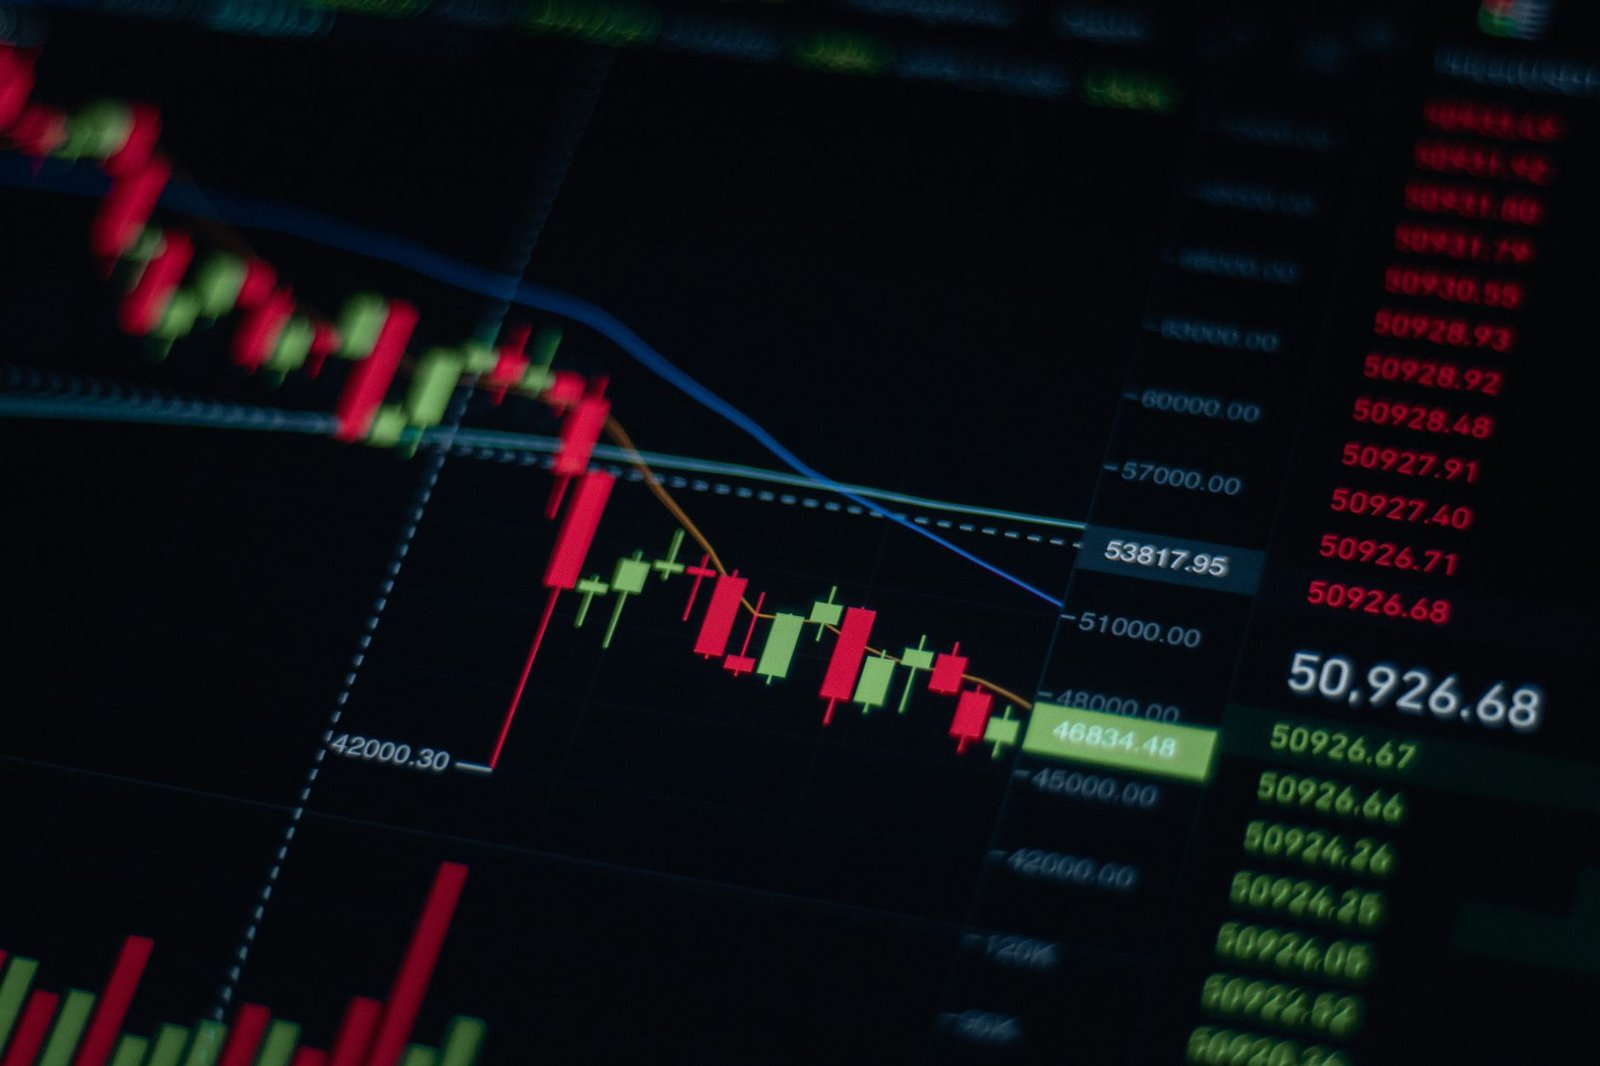
Monitoring Post-Breakout Price Action
Once a breakout occurs and you are in a trade, continued monitoring is essential. Watch for signs of weakness or strength. If the price begins to stall or show reversal patterns after the breakout, consider tightening your stop-loss or taking partial profits. The use of a Finovatives TradingView indicator can often provide real-time alerts for such developments.
Frequently Asked Questions
What is the best time of day to trade Nifty/Bank Nifty breakouts?
The first 60-90 minutes after the market opens (9:15 AM – 10:45 AM IST) often exhibits higher volatility and can present significant breakout opportunities due to initial reactions to overnight news and order flow.
How do I confirm a breakout is genuine and not a fakeout?
Look for a decisive price close beyond the level on significantly increased volume. Subsequent price action should show continuation rather than an immediate reversal. Check multiple timeframes for confirmation.
What is a reasonable profit target for a breakout trade?
Profit targets can be set using chart pattern measurement techniques, previous support/resistance levels, or by employing trailing stop-losses. A minimum target of 1.5x to 2x the initial risk is often considered reasonable.
Can I use breakout strategies on lower timeframes like 5-minute charts?
Yes, breakout strategies can be applied to lower timeframes, but they tend to generate more false signals. Robust risk management and stricter entry/exit criteria are crucial for success on such volatile intraday charts.
What role does news play in Nifty/Bank Nifty breakouts?
Major economic data releases, central bank announcements (like RBI policy), or significant global events can trigger sharp, high-volume breakouts. Traders should be aware of upcoming news events that might impact the market.
When should I exit a breakout trade if it fails?
Exit immediately if the price closes back inside the breakout level, especially on increased volume, or if your predefined stop-loss level is hit. Don’t hesitate; cut losses quickly.
Key Takeaways
- Breakout trading capitalizes on decisive price movements beyond support or resistance levels, aiming to capture ensuing trends.
- Nifty and Bank Nifty offer high liquidity and volatility, making them prime instruments for breakout strategies.
- Volume is the most critical confirmation indicator for a genuine breakout; spikes in volume are essential.
- Tools like RSI, MACD, and Bollinger Bands can supplement price action and volume analysis.
- Strict risk management, including stop-loss orders and proper position sizing, is crucial due to the risk of false breakouts.
- A well-defined strategy with clear entry, exit, and risk parameters is vital for consistent profitability.
- Patience and discipline are key to avoiding emotional decisions and over-trading.
Trading in the stock market involves risks, including the potential loss of principal. Past performance is not indicative of future results. Always conduct your own research or consult a financial advisor before making any investment decisions.




 Finovatives