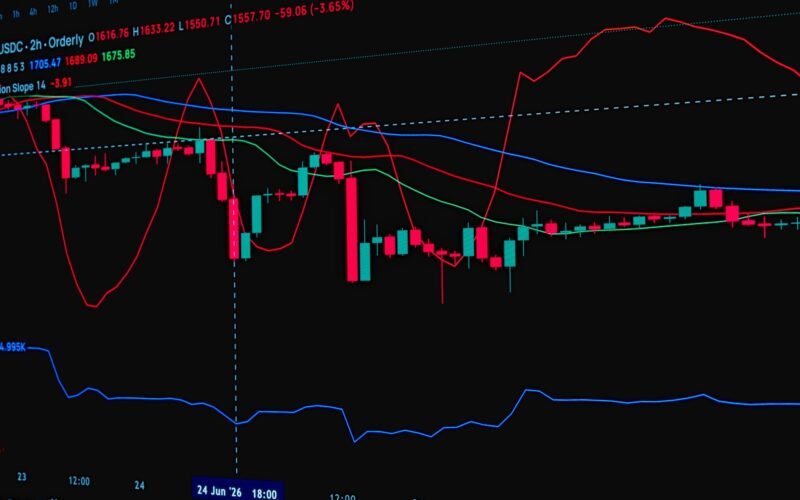
TL;DR: The RSI indicator helps identify potential trade entry points by signalling overbought or oversold conditions and trend strength, with common strategies involving overbought/oversold crossovers, divergence, and trendline breaks.
Key Stats at a Glance:
- RSI indicator ranges from 0 to 100.
- Readings above 70 typically indicate overbought conditions.
- Readings below 30 typically indicate oversold conditions.
- Standard RSI period setting is 14.
- Divergence can signal a trend reversal with up to 80% accuracy in certain conditions.
What is the RSI Indicator?
The Relative Strength Index (RSI) is a widely used momentum oscillator in technical analysis, developed by J. Welles Wilder Jr., designed to measure the speed and magnitude of recent price changes to evaluate whether a market is in overbought or oversold territory.
Introduced in his 1978 book ‘New Concepts in Technical Trading Systems’, the RSI oscillates between 0 and 100. It is typically used to identify potential reversals in trading. A common rule of thumb is that an asset is often considered overbought when the RSI is above 70 and oversold when it is below 30. However, these levels can be adjusted based on market conditions and individual trading strategies. The core idea is that rapid price increases (pushing RSI up) might be unsustainable, and sharp declines (pushing RSI down) might also be temporary, signalling a potential buying or selling opportunity, respectively.

The RSI is calculated using a formula that considers the average gain and average loss over a specific period, most commonly 14 periods (days, hours, minutes, depending on the chart timeframe). The formula is: RSI = 100 – [100 / (1 + RS)], where RS (Relative Strength) = Average Gain / Average Loss. Understanding this calculation helps in appreciating why RSI reacts to price movements, but for practical trading, relying on charting platforms that display the RSI is sufficient.
How Can RSI Improve Trade Entries?
The RSI indicator can significantly improve trade entries by providing objective signals for potential reversals, trend continuations, and momentum shifts, thereby helping traders avoid entering trades at unfavorable times.
Traders use the RSI in various ways to pinpoint better entry points. The most straightforward method involves observing when the RSI crosses above the 30 level (suggesting an oversold condition is potentially ending, signalling a buy opportunity) or crosses below the 70 level (suggesting an overbought condition is potentially ending, signalling a sell opportunity). Beyond these simple crossovers, identifying ‘bullish’ and ‘bearish’ divergence between the RSI and the price chart is a more advanced but powerful technique. Bullish divergence occurs when the price makes a lower low, but the RSI makes a higher low, indicating weakening downward momentum and a potential upward reversal. Conversely, bearish divergence happens when the price makes a higher high, but the RSI makes a lower high, suggesting weakening upward momentum and a potential downward reversal. These signals, when confirmed by other indicators or chart patterns, can lead to much more precise and profitable trade entries.
RSI Overbought and Oversold Crossovers
A fundamental way to use the RSI is by monitoring its movement relative to the 30 and 70 levels. When the RSI dips below 30, it suggests that the asset has experienced significant selling pressure and might be oversold. A subsequent move back above 30 can be interpreted as a potential buy signal, indicating that buying momentum is starting to return. Conversely, when the RSI rises above 70, it signals that the asset may be overbought, with extensive buying pressure potentially leading to a price pullback. When the RSI then falls back below 70, it can be seen as a potential sell signal, suggesting that the upward momentum is waning.
It’s crucial to remember that in strong trending markets, the RSI can remain in overbought or oversold territory for extended periods. Therefore, relying solely on these crossovers without considering the overall market trend or other confirmation signals can lead to premature entries or false signals. For instance, during a strong uptrend, the RSI might repeatedly touch or exceed 70, and crossing back below 70 might not signal a reversal but merely a pause before further ascent. Similarly, in a strong downtrend, the RSI can hover below 30, with a cross back above 30 potentially indicating a temporary bounce rather than a sustained trend change.
Identifying RSI Divergence for Entry Timing
RSI divergence is a more sophisticated technique that can offer earlier and often more reliable entry signals than simple overbought/oversold crossovers. Bullish divergence occurs when the price of an asset makes a new low, but the RSI fails to make a new low, instead printing a higher low. This indicates that while the price is falling, the momentum behind the fall is decreasing, suggesting a potential reversal upwards. Traders often look for this signal to identify a buying opportunity, especially if it occurs near established support levels.
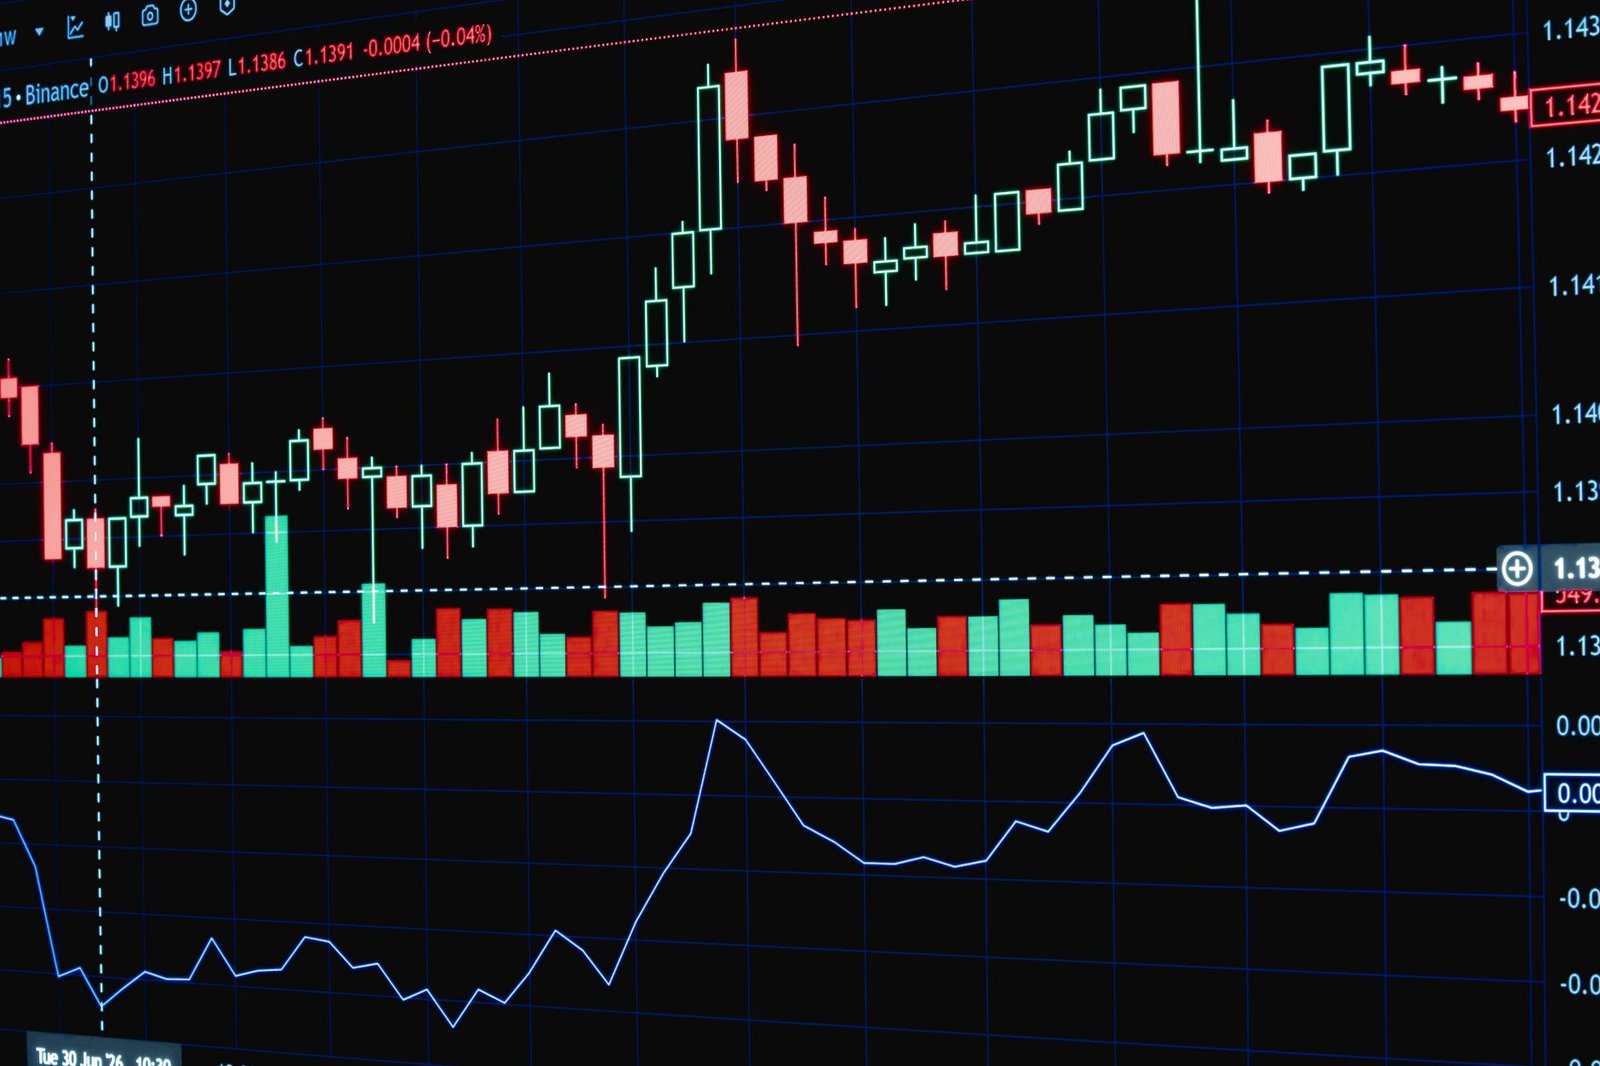
Conversely, bearish divergence is observed when the price makes a new high, but the RSI makes a lower high. This signifies that the upward momentum is weakening, even as the price pushes higher, signalling a potential top and a subsequent price decline. This can be a valuable signal for short-selling or exiting long positions. To increase the probability of success, traders typically wait for confirmation, such as the RSI breaking a short-term trendline or the price itself showing signs of reversal after divergence is spotted.
Using RSI with Trendlines and Support/Resistance
Combining the RSI indicator with other technical analysis tools like trendlines and support/resistance levels can significantly enhance its effectiveness for trade entries. When the RSI breaks above a downtrend line drawn on the RSI chart, it can signal strengthening momentum, especially if it coincides with the price breaking its own downtrend resistance. Similarly, if the RSI breaks below an uptrend line, it might precede a price decline.
Furthermore, observing the RSI’s behaviour at key support and resistance levels on the price chart can provide valuable insights. For example, if the price approaches a strong support level and the RSI shows bullish divergence or crosses up from the oversold zone, it strengthens the case for a potential long entry. Conversely, if the price nears a resistance level and the RSI exhibits bearish divergence or crosses down from the overbought zone, it can serve as a signal for a potential short entry or to exit existing long positions. This multi-faceted approach, integrating RSI signals with price action context, often leads to more robust trading decisions.
How to Use RSI for Entry Signals: A Step-by-Step Guide
Here’s a practical guide on how to incorporate the RSI indicator into your trading strategy for more precise entry points:
- Select Your Timeframe: Choose the trading timeframe that suits your strategy (e.g., 5-minute for day trading, daily for swing trading, weekly for long-term investing).
- Add RSI to Your Chart: On your TradingView platform or preferred charting software, add the RSI indicator to your price chart, typically with the standard 14-period setting.
- Identify Overbought/Oversold Conditions: Monitor when the RSI crosses above 30 (potential buy signal after oversold) or falls below 70 (potential sell signal after overbought).
- Look for Divergence: Scan the chart for bullish divergence (price makes lower lows, RSI makes higher lows) or bearish divergence (price makes higher highs, RSI makes lower highs).
- Confirm with Price Action: Wait for the price chart to confirm the RSI signal. For a buy signal, look for bullish candlestick patterns or a break of a resistance level. For a sell signal, look for bearish patterns or a break of a support level.
- Consider Trendlines and Levels: Integrate RSI signals with trendlines on the RSI itself, or with significant support and resistance levels on the price chart for added confirmation.
- Factor in Overall Trend: Always consider the broader market trend. RSI signals are generally more reliable when trading in the direction of the prevailing trend (e.g., look for buy signals in an uptrend).
- Use with Other Indicators: For increased confidence, combine RSI signals with other indicators like Moving Averages, MACD, or Volume. For instance, a buy signal from RSI is stronger if it aligns with a bullish crossover on your moving averages.

This systematic approach helps filter out weaker signals and increases the probability of entering trades at opportune moments. The free trial of our TradingView indicator suite can also help you visualise these concepts more effectively.
Common RSI Trading Strategies
Several popular strategies revolve around using the RSI indicator. While the overbought/oversold crossovers and divergence methods are fundamental, other approaches can also be fruitful. One such strategy involves using the 50-level midline. Crossing above 50 can be seen as a sign of bullish momentum gaining strength, while crossing below 50 indicates bearish momentum is taking over. Many traders use the 50 level as a filter: they only consider buy signals (like crossing above 30) if the RSI is already above 50, and sell signals (like crossing below 70) only if the RSI is below 50. This helps align trades with the prevailing medium-term trend.
Another strategy involves using RSI with failure swings. A bullish failure swing occurs when the RSI makes a bottom below 30, rallies, pulls back to hold above 30, and then moves to a new high above the previous rally peak. This often precedes a significant price increase. Conversely, a bearish failure swing occurs when the RSI peaks above 70, pulls back, rallies to stay below 70, and then falls to a new low below the previous bottom. These patterns, though less common than divergence, can be very potent signals for entering trades.
The 50-Level Midline Strategy
The RSI’s 50-level acts as a crucial dividing line between bullish and bearish momentum. When the RSI is consistently above 50, it suggests that the average gains are larger than the average losses, indicating an uptrend or bullish sentiment. Conversely, when the RSI stays below 50, it implies that average losses outweigh average gains, signalling a downtrend or bearish sentiment. Traders often use this to filter their trades. For example, a trader might only take long positions when the RSI is above 50 and generates a buy signal (e.g., crossing up from 30). Similarly, they might only consider short positions when the RSI is below 50 and generates a sell signal (e.g., crossing down from 70).
This strategy helps to avoid taking counter-trend trades that have a higher probability of failure. By ensuring that entry signals align with the direction indicated by the 50-level, traders can improve their risk-reward ratio. For instance, if the RSI is below 50, a crossover above 30 might be seen as a potential short-covering opportunity within a larger downtrend, rather than a signal for a sustained bullish reversal. Conversely, if the RSI is above 50, a dip to 40 and a subsequent rise back above 50 could be a strong buy signal.
RSI Failure Swings
RSI failure swings are patterns that can provide very strong signals for potential trend reversals. There are two types: bullish and bearish. A bullish failure swing develops when the RSI falls to a low (often below 30), then rallies to a high, pulls back to a level above the initial low, and finally moves to a new high that surpasses the previous rally high. This pattern suggests that selling pressure is exhausting and buying momentum is building, often preceding a significant price increase. Traders might look to enter a long position once the RSI breaks above the high point of the first rally within this pattern.

A bearish failure swing is the inverse. It occurs when the RSI reaches a high (often above 70), then falls to a low, rallies to a level below the previous high, and subsequently drops to a new low below the previous bottom. This pattern indicates that buying pressure is waning and selling momentum is increasing, often signalling a substantial price decline. A short entry might be considered once the RSI breaks below the low point of the first pullback within this pattern. These failure swings, though less frequently discussed than divergence, are considered by many experienced traders to be highly reliable indicators of future price movement.
Potential Pitfalls and How to Avoid Them
While the RSI is a powerful tool, traders must be aware of its limitations and potential pitfalls. One of the most common mistakes is taking RSI signals at face value without confirmation. As mentioned, in strong trends, the RSI can remain in overbought or oversold territory for extended periods, leading to premature entries. For example, exiting a long position just because the RSI crosses below 70 in a powerful bull market could mean missing out on substantial further gains.
Another pitfall is misinterpreting divergence. Divergence signals potential reversals, but they are not guarantees. A divergence might persist for some time before a reversal actually occurs, or the trend might simply continue. Over-reliance on a single indicator is another common error. The RSI is most effective when used in conjunction with other technical analysis tools and chart patterns. For example, using RSI signals only when they align with the broader market trend (e.g., using buy signals from RSI in an overall uptrend) can significantly improve performance. Always remember that past performance is not indicative of future results, and risk management, such as using stop-losses, is paramount.
Frequently Asked Questions
What are the standard RSI levels for overbought and oversold?
The standard levels considered overbought are above 70, and oversold are below 30. However, these can be adjusted by traders based on market volatility and their specific strategy, with levels like 80/20 or 60/40 sometimes used.
Can RSI be used on any timeframe?
Yes, the RSI indicator can be applied to any timeframe, from very short-term charts (like 1-minute) for day trading to longer-term charts (like weekly or monthly) for position trading and investing.
Is RSI divergence a guaranteed reversal signal?
No, RSI divergence is not a guaranteed reversal signal. It indicates a potential weakening of momentum and a possible reversal, but confirmation from price action or other indicators is always recommended.
What is the best period setting for RSI?
The most commonly used period setting for RSI is 14. However, shorter periods (e.g., 7 or 9) make the RSI more sensitive to price changes, while longer periods (e.g., 21 or 25) make it smoother and less prone to false signals.
How does RSI divergence differ from overbought/oversold signals?
Overbought/oversold signals (like crossing 70 or 30) indicate extreme price conditions that might lead to a reversal. Divergence compares the price action to the RSI movement, highlighting discrepancies in momentum that can signal an impending reversal, often before the RSI reaches extreme levels.
Should I use RSI alone for trading decisions?
It is generally not advisable to use the RSI indicator in isolation. Combining RSI signals with other technical analysis tools, chart patterns, and volume analysis, along with robust risk management, typically leads to more reliable trading outcomes.

Key Takeaways
- The RSI indicator measures the speed and change of price movements on a scale of 0 to 100.
- Readings above 70 often signal an overbought condition, while readings below 30 suggest an oversold condition.
- RSI divergence (bullish and bearish) can provide advanced signals for potential trend reversals.
- Combining RSI signals with trendlines, support/resistance levels, and other indicators improves signal reliability.
- The 50-level on the RSI acts as a crucial separator between bullish and bearish momentum.
- Always use RSI in conjunction with other analysis tools and implement strong risk management practices.
Investing in the stock market involves inherent risks. All trading decisions should be made after thorough research and consideration of your risk tolerance.






 Finovatives