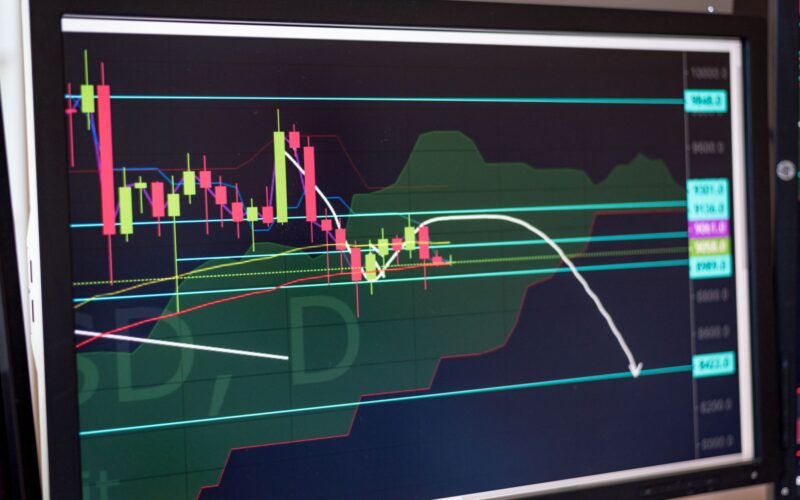



TL;DR: A breakout trading strategy for Nifty and Bank Nifty focuses on identifying and entering trades when prices decisively move beyond key support or resistance levels, aiming to capture the subsequent momentum for profitable trades.
Key Stats at a Glance:
- Nifty 50’s average daily trading volume: ₹15,000+ Crore (as of recent data)
- Bank Nifty’s volatility index (India VIX) often spikes during major breakouts.
- Historically, breakouts can lead to 2-5% intra-day or 2-day moves in Nifty and Bank Nifty.
- NSE hosts over 2,000 listed companies, providing a vast landscape for technical analysis.
What is a Breakout in Trading?
A breakout in trading occurs when an asset’s price moves decisively beyond a predefined price level, typically a resistance or support level, signalling a potential shift in market sentiment and momentum.
Identifying Breakout Levels
Breakouts are fundamentally about price action breaching established boundaries. These boundaries are usually formed by horizontal support and resistance levels, trendlines, or chart patterns like triangles, flags, and pennants. When the price pierces through these levels with conviction, accompanied by increased trading volume, it signals a potential breakout. For Nifty and Bank Nifty, these levels can be psychological figures (like 20,000 or 45,000), previous day’s highs/lows, or levels identified through technical analysis tools.
Types of Breakouts
Breakouts can be classified into a few key types, each with its own implications:
- True Breakouts: These are genuine moves where the price breaks a significant level and continues in the breakout direction, often supported by high volume.
- False Breakouts (or Fakeouts): Here, the price briefly moves beyond a level but quickly reverses, trapping traders who entered based on the initial breakout signal.
- Volume Confirmation: A crucial element, high trading volume accompanying a breakout significantly increases the probability of it being a true move.
- Pattern Breakouts: These occur when prices break out of established chart patterns, such as ascending triangles, descending triangles, symmetrical triangles, flags, and pennants.
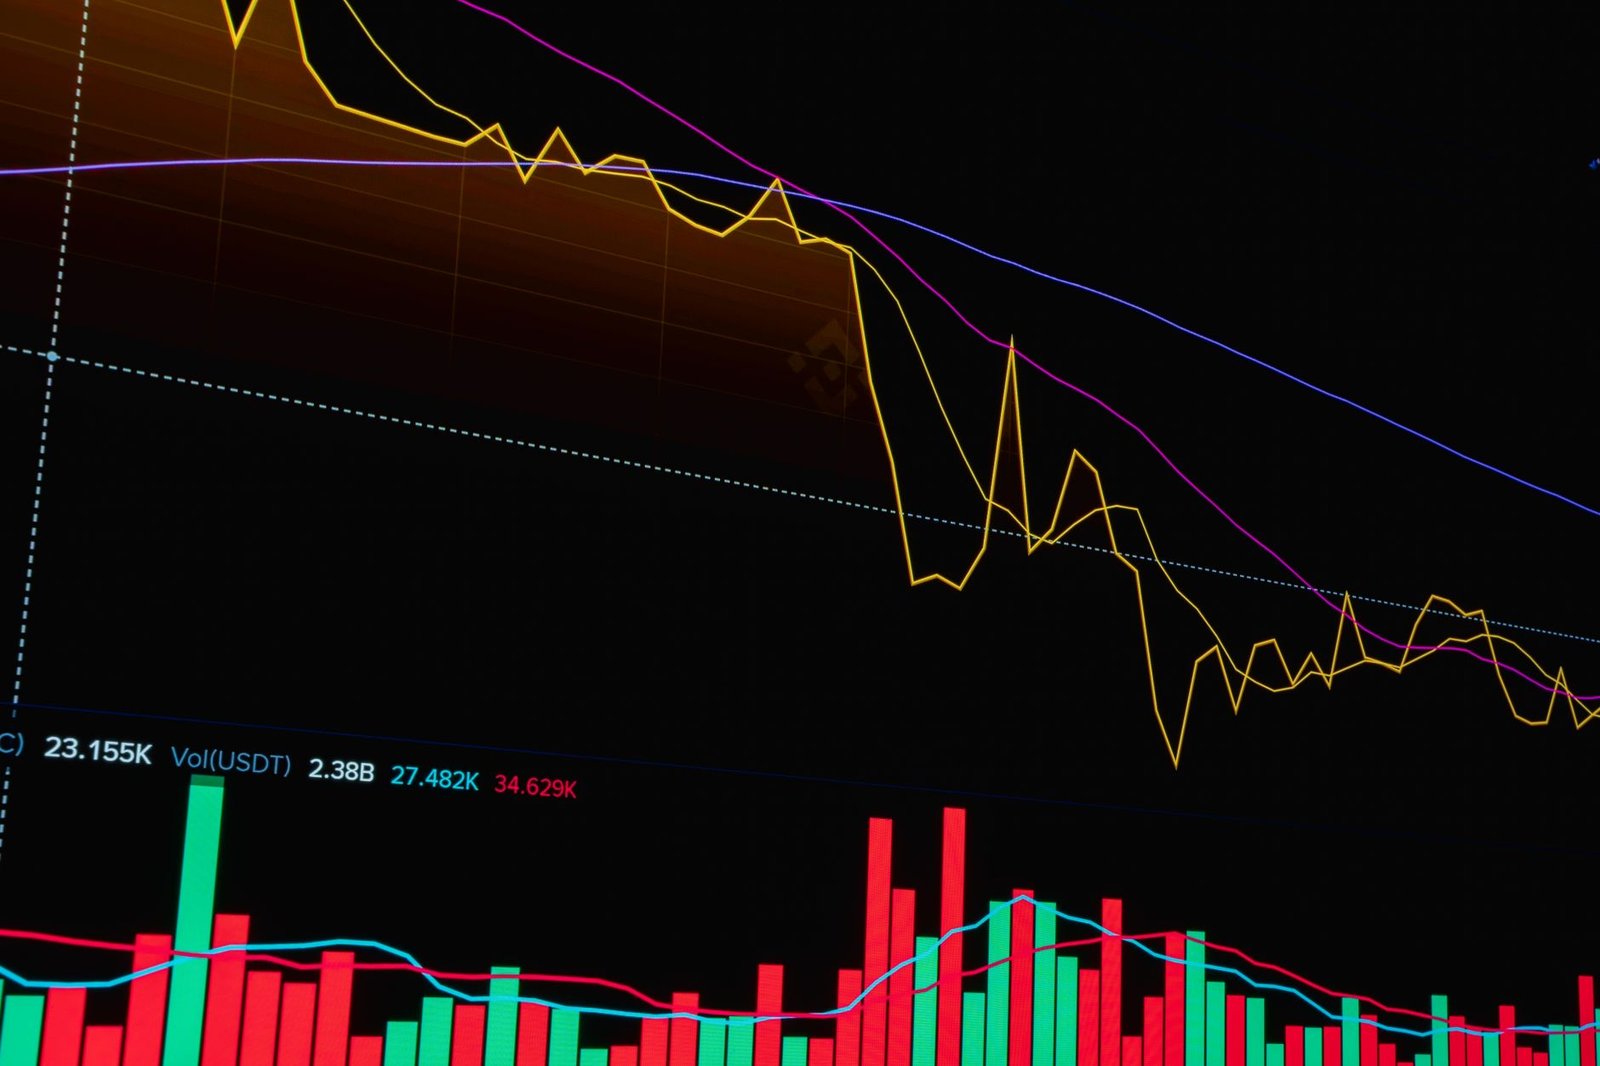
How to Develop a Breakout Trading Strategy for Nifty and Bank Nifty?
Developing a robust breakout trading strategy for Nifty and Bank Nifty requires a systematic approach, combining technical analysis with risk management principles.
The Core Components of a Breakout Strategy
A successful strategy hinges on several critical elements:
- Defining Entry and Exit Points: Clear rules for when to enter a trade (e.g., on a confirmed breakout candle close) and when to exit (e.g., at a profit target or stop-loss).
- Risk Management: Crucially, determining the stop-loss level (often just below the breakout level for long breakouts, or above for short breakouts) and position sizing to limit potential losses.
- Confirmation Signals: Using indicators like volume, Moving Averages (MAs), or the Relative Strength Index (RSI) to confirm the breakout’s validity.
- Market Conditions: Understanding whether the current market environment (trending vs. ranging) is conducive to breakout trading.
How to Implement a Breakout Strategy
- Identify Key Levels: Analyse charts (e.g., daily, hourly) to pinpoint significant support and resistance levels or chart patterns for Nifty and Bank Nifty.
- Wait for Confirmation: Do not chase the price. Wait for the price to decisively close beyond the identified level.
- Check Volume: Ensure that the breakout is accompanied by significantly higher-than-average trading volume.
- Enter the Trade: Enter a long position on a bullish breakout or a short position on a bearish breakout, typically on the close of the breakout candle or the next candle’s open.
- Set Stop-Loss: Place a stop-loss order just below the breakout level (for long trades) or just above (for short trades) to limit potential downside.
- Define Profit Targets: Set realistic profit targets based on previous price action, chart patterns, or risk-reward ratios (e.g., 1:2 or 1:3).
- Review and Adjust: Regularly review trade performance and adjust strategy parameters as needed based on market conditions.
For instance, a trader might use a Renko chart or a TradingView indicator to help spot these levels more clearly.
Key Indicators for Breakout Confirmation
While price action is primary, several indicators can bolster confidence in a breakout’s legitimacy.
Volume Analysis
Volume is often cited as the most important confirmation tool for breakouts. A significant surge in trading volume as the price breaks through a level indicates strong conviction from market participants. Low volume during a breakout suggests a lack of commitment and increases the likelihood of a false move.
Moving Averages (MAs)
Moving averages can act as dynamic support and resistance levels. A breakout above a significant MA (like the 200-day MA) or a crossover of shorter-term MAs above longer-term ones can signal strengthening momentum. For example, a price breaking above the 50-day MA with increased volume is a bullish sign.
Relative Strength Index (RSI)
The RSI, a momentum oscillator, can help confirm breakouts. A strong bullish breakout might be accompanied by the RSI moving above 60 or breaking through a resistance level on its own chart. Conversely, a bearish breakout could see the RSI falling below 40 or breaking a support level.

Nifty and Bank Nifty Specific Breakout Scenarios
Nifty and Bank Nifty, being highly liquid and popular indices, exhibit distinct breakout behaviours influenced by global cues, domestic news, and institutional activity.
Trading Range Breakouts
Both indices often consolidate within well-defined trading ranges for extended periods. A breakout above the upper boundary of such a range, especially after a prolonged period of consolidation, can lead to substantial upward momentum. Similarly, a breakdown below the lower boundary can trigger sharp declines. These are classic horizontal support/resistance breakouts.
Trendline Breakouts
During trending phases, Nifty and Bank Nifty frequently respect trendlines. A decisive break of an established uptrend line signals potential weakness and a possible trend reversal, while a break of a downtrend line can indicate the start of an uptrend. These are crucial for identifying shifts in market sentiment.
Chart Pattern Breakouts
Common chart patterns like symmetrical triangles, ascending triangles (bullish), descending triangles (bearish), and flags/pennants frequently appear in Nifty and Bank Nifty charts. A successful breakout from these patterns often leads to predictable price movements, offering clear entry and exit points.
Risk Management in Breakout Trading
Breakout trading, while potentially rewarding, carries inherent risks, primarily from false breakouts. Robust risk management is paramount.
Stop-Loss Placement
The most critical aspect is placing a stop-loss order. For a long breakout, the stop-loss should ideally be placed just below the breakout level or the previous swing low. For a short breakout, it should be just above the breakout level or the previous swing high. This ensures that if the breakout fails, losses are contained to a predetermined amount.
Position Sizing
Never risk more than a small percentage (e.g., 1-2%) of your trading capital on any single trade. Calculate your position size based on the distance between your entry price and your stop-loss level. This prevents a single losing trade from significantly impacting your overall capital.
Profit Targets
While not strictly risk management, setting realistic profit targets is crucial for locking in gains. Targets can be set using the measured move technique (where the height of a pattern is projected from the breakout point), previous resistance/support levels, or a fixed risk-reward ratio. Remember, sometimes letting profits run after a successful breakout is also a strategy, but it requires careful trailing stop management.

Common Mistakes to Avoid
Even experienced traders can fall prey to common errors when engaging in breakout trading.
Chasing Price
Entering a trade long after a breakout has occurred and the price has moved significantly is a common mistake. This often leads to entering at an unfavourable price, increasing the risk of being caught in a reversal or consolidation. Patience is key; wait for the breakout confirmation.
Ignoring Volume
Treating a breakout seriously without sufficient volume confirmation is risky. A price move on thin volume is suspect and more likely to be a fakeout. Always look for that volume surge.
Lack of Stop-Loss
Trading without a stop-loss order is akin to gambling. False breakouts are inevitable, and without a stop-loss, a single failed breakout can wipe out a significant portion of your capital.
Over-reliance on Single Indicator
While indicators are helpful, relying solely on one for breakout confirmation can be misleading. Combining multiple indicators and price action analysis provides a more robust view.
Frequently Asked Questions
What is a breakout trading strategy?
A breakout trading strategy involves identifying when an asset’s price moves significantly beyond a defined resistance or support level, entering a trade in the direction of the breakout to capture potential momentum.
How do I confirm a breakout?
Confirm a breakout by looking for increased trading volume, a decisive price close beyond the level, and potentially supportive signals from momentum indicators like RSI or MACD.
Is breakout trading risky?
Yes, breakout trading can be risky due to the possibility of false breakouts. Strict risk management, including stop-losses and position sizing, is essential to mitigate these risks.
What are the best chart patterns for breakouts?
Commonly used patterns include triangles (symmetrical, ascending, descending), flags, pennants, and rectangles. Breakouts from these patterns can offer clear trading opportunities.
How much capital should I risk per breakout trade?
It’s generally advised to risk no more than 1-2% of your total trading capital on any single breakout trade to manage potential losses effectively.
When should I exit a breakout trade?
Exit a breakout trade based on predefined profit targets, when a trailing stop-loss is hit, or if the price action indicates a reversal or loss of momentum against your position.
Key Takeaways
- Breakout trading aims to capitalize on the momentum following a price move beyond key support or resistance levels.
- Volume confirmation is crucial for validating a breakout and reducing the risk of false moves.
- Key indicators like MAs and RSI can supplement price action analysis for confirmation.
- Strict risk management, including stop-loss orders and proper position sizing, is non-negotiable.
- Avoid common pitfalls like chasing price, ignoring volume, and trading without stop-losses.
- Nifty and Bank Nifty often present clear breakout opportunities from consolidation ranges and chart patterns.
- Developing a consistent strategy and discipline is vital for long-term success in breakout trading.
Trading in securities is subject to market risks. Please read all related documents carefully before investing. Investment decisions should be based on your own research and risk assessment. Finovatives.com is not liable for any losses incurred.





 Finovatives