
TL;DR: Effective NSE swing trading strategies involve identifying stocks with potential for 5-15% price movements over days or weeks, using technical indicators like Moving Averages and RSI to time entry/exit, and employing strict stop-losses to manage risk.
Key Stats at a Glance:
- Nifty 50 Index: Represents 12 blue-chip companies listed on NSE.
- Average Daily Trading Volume on NSE: Over ₹80,000 crore in recent periods.
- Typical Swing Trade Holding Period: 2 days to 3 weeks.
- Target Profit per Swing Trade: Aiming for 5-15% gains.
- Stop-Loss Placement: Typically 1-2% below entry price.
What is Swing Trading in the Indian Context?
Swing trading on NSE involves capturing price ‘swings’ or trends that typically last a few days to a few weeks, aiming for short-to-medium term gains by capitalising on price movements between major highs and lows.
Swing trading is a popular strategy for Indian retail traders looking to benefit from market volatility without the high frequency of day trading or the long-term commitment of investing. It sits between investing and day trading, focusing on capturing price movements that occur over a period of days to weeks. Unlike day traders who close positions by the end of the day, swing traders hold positions overnight, anticipating that a stock’s price will move in a favourable direction. The key is to identify stocks that are exhibiting clear trends or are poised for a reversal, and then enter trades at opportune moments to capture these anticipated price swings. The NSE, with its vast array of liquid stocks across various sectors, offers ample opportunities for such strategies.
Key Swing Trading Strategies for NSE Stocks
Successful swing trading on NSE relies on a combination of technical analysis, pattern recognition, and disciplined risk management to profit from price fluctuations.
Several robust strategies can be employed by traders on the National Stock Exchange (NSE). These strategies are designed to identify potential entry and exit points based on price action and indicator signals. The goal is to capture a significant portion of a stock’s upward or downward movement within a short to medium-term timeframe.

1. Moving Average Crossover Strategy
This strategy uses two or more moving averages (MAs) of different periods to generate buy and sell signals. A common setup involves a shorter-period MA (e.g., 20-day) crossing above a longer-period MA (e.g., 50-day) as a buy signal, and crossing below as a sell signal.
2. Relative Strength Index (RSI) Divergence Strategy
RSI divergence occurs when the price of an asset is moving in one direction while the RSI is moving in the opposite direction. Bullish divergence (price makes lower lows, RSI makes higher lows) suggests a potential uptrend, while bearish divergence (price makes higher highs, RSI makes lower highs) indicates a potential downtrend.
3. Support and Resistance Breakout Strategy
This involves identifying key support and resistance levels on a stock’s price chart. A breakout occurs when the price moves decisively above a resistance level (buy signal) or below a support level (sell signal), suggesting the start of a new trend.
How to Identify Support and Resistance Levels
Support levels are price points where buying interest is strong enough to overcome selling pressure, causing the price to bounce back up. Resistance levels are price points where selling pressure overcomes buying interest, causing the price to stall or reverse downwards. Traders identify these levels by looking at historical price charts, noting where prices have repeatedly reversed in the past.
4. Candlestick Patterns
Certain candlestick patterns, such as Engulfing patterns, Hammers, and Doji stars, can signal potential trend reversals or continuations when they appear at critical price levels. For instance, a bullish engulfing pattern near a support level can be a strong buy signal for a swing trader.
5. Bollinger Bands Strategy
Bollinger Bands consist of a middle band (typically a 20-period simple moving average) and two outer bands plotted at a standard deviation away. Prices tend to revert to the middle band. Traders look for opportunities when prices touch the lower band (potential buy signal) and are expected to move towards the middle band, or when prices touch the upper band (potential sell signal).
How to Implement a Swing Trading Strategy on NSE
Implementing a successful swing trading strategy requires a systematic approach, from selecting stocks to managing trades and refining your techniques.

A structured approach is crucial for consistent profitability in swing trading. This involves not just picking the right strategy but also executing it with discipline and adapting to market conditions. The steps below provide a practical roadmap for Indian traders.
- Stock Selection: Identify liquid NSE stocks exhibiting potential for short-to-medium term price movements. Look for stocks with clear trends or those approaching significant support/resistance levels. Consider stocks with average daily trading volumes that ensure ease of entry and exit.
- Chart Analysis: Use technical charting tools to analyse the selected stocks. Apply your chosen strategy (e.g., Moving Averages, RSI, MACD) to identify potential entry and exit points. Look for confirmation signals from multiple indicators.
- Entry Signal: When your strategy generates a buy signal (e.g., bullish crossover, breakout above resistance), enter the trade. Ensure you have a clear justification for the trade based on your analysis.
- Set Stop-Loss: Immediately place a stop-loss order to limit potential losses. For swing trades, a stop-loss of 1-2% below the entry price is common, but this can vary based on stock volatility and the specific strategy.
- Set Profit Target: Define a realistic profit target based on previous price action, resistance levels, or a predefined risk-reward ratio (e.g., 1:2 or 1:3).
- Monitor the Trade: Keep an eye on the stock’s price movement and relevant market news. Adjust your stop-loss to a trailing stop-loss as the price moves in your favour to lock in profits.
- Exit Strategy: Exit the trade when either your profit target is hit or your stop-loss is triggered. Sometimes, exiting based on a weakening trend signal or a reversal pattern can also be a valid approach.
- Review and Refine: After each trade, review your performance. Analyse what worked and what didn’t, and use these insights to refine your strategy and improve future trading decisions.
Risk Management in Swing Trading
Effective risk management is paramount for swing traders to protect capital and ensure long-term survival in the volatile Indian stock market.

The inherent volatility of the stock market means that even the best strategies can result in losses. Therefore, implementing robust risk management protocols is not just advisable but essential. Swing trading on NSE demands a disciplined approach to minimise downside risk while maximising potential rewards. The SEBI guidelines also emphasise risk mitigation for investors.
Position Sizing
Determine the appropriate number of shares to trade based on your capital and the acceptable risk per trade (typically 1-2% of total trading capital). This prevents a single losing trade from significantly depleting your account.
Stop-Loss Orders
As mentioned in the implementation steps, consistently using stop-loss orders is non-negotiable. These orders automatically close your position if the price moves against you beyond a predetermined level, thereby capping your losses.
Diversification
While swing trading focuses on specific opportunities, diversifying across different stocks and sectors can help mitigate sector-specific risks. However, avoid over-diversification, which can dilute focus and potentially reduce returns from high-conviction trades.
Risk-Reward Ratio
Always aim for trades where the potential profit is significantly higher than the potential loss. A common target is a risk-reward ratio of 1:2 or 1:3, meaning you aim to make at least ₹2 or ₹3 for every ₹1 you risk.
Popular Indicators for NSE Swing Trading
Technical indicators provide valuable insights into market sentiment and potential price movements, aiding swing traders in making informed decisions on NSE.
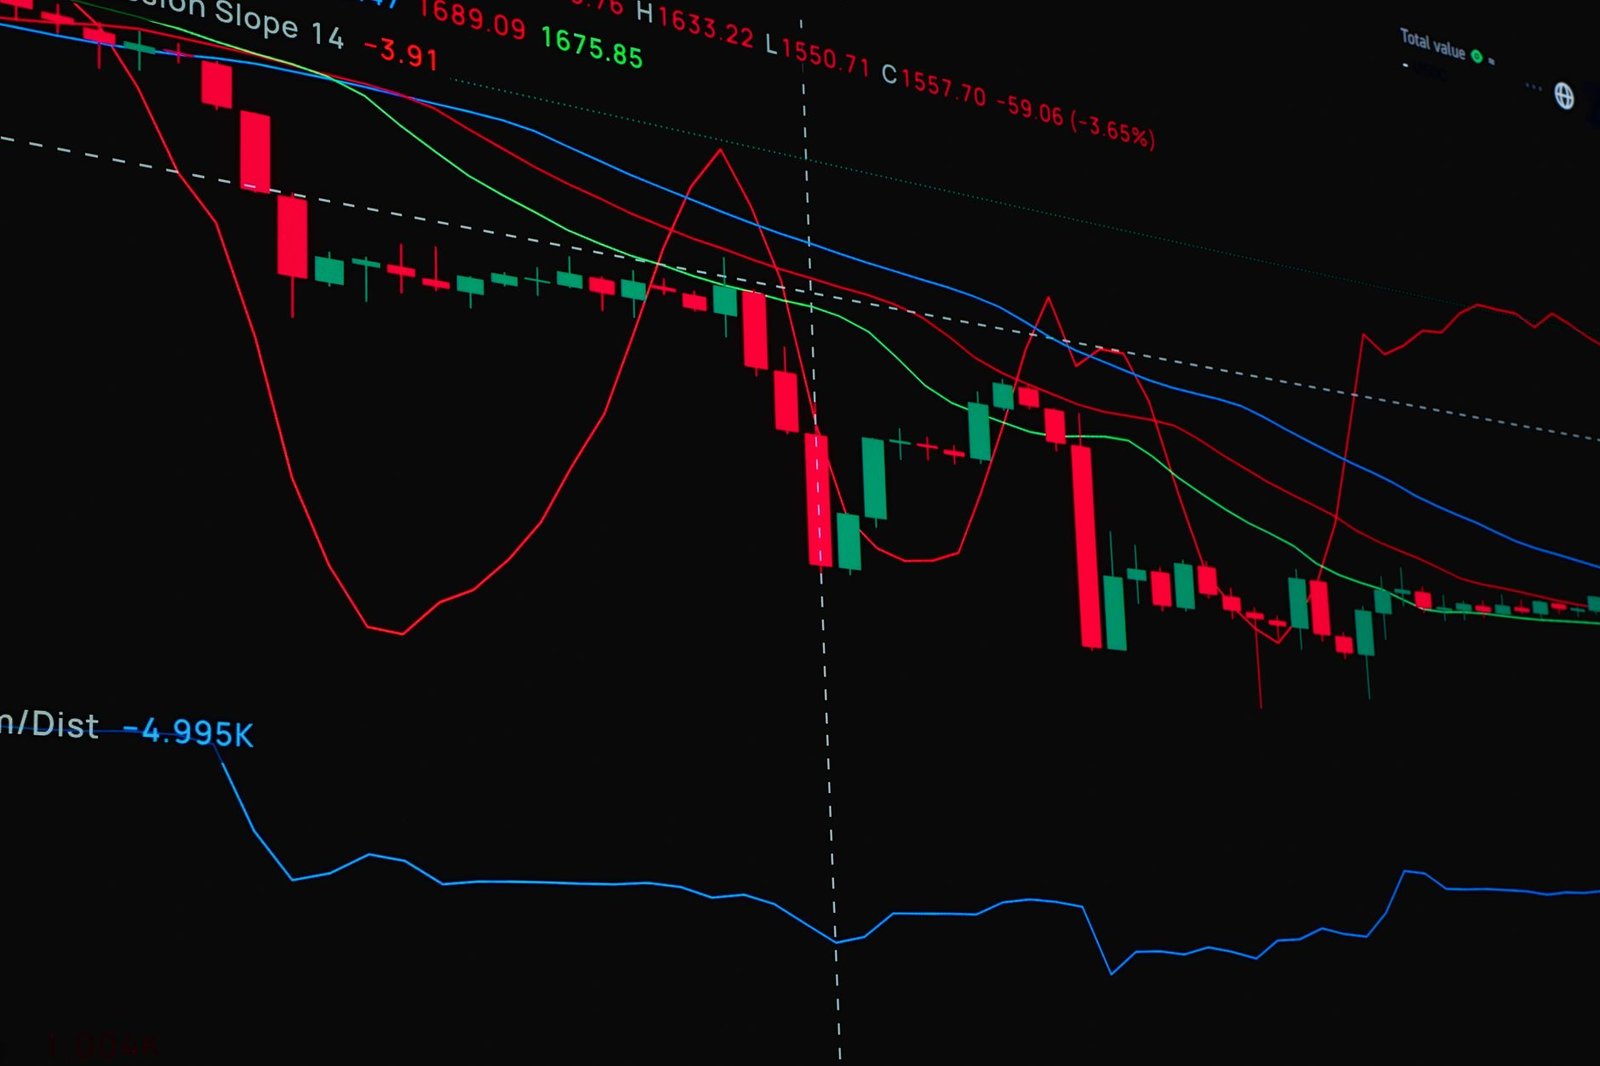
The NSE provides a dynamic environment where technical indicators can be powerful tools when used correctly. These indicators translate price and volume data into actionable signals, helping traders identify trends, momentum, and potential turning points. Understanding and applying a few key indicators can significantly enhance a swing trader’s decision-making process.
Moving Averages (MA)
Simple Moving Averages (SMA) and Exponential Moving Averages (EMA) smooth out price data to identify trends. Crossovers between short-term and long-term MAs are common signals.
Relative Strength Index (RSI)
This momentum oscillator measures the speed and change of price movements. It helps identify overbought (typically above 70) or oversold (typically below 30) conditions.
Moving Average Convergence Divergence (MACD)
MACD is a trend-following momentum indicator that shows the relationship between two moving averages of a security’s price. It can signal trend changes and momentum shifts.
Stochastic Oscillator
Similar to RSI, the Stochastic Oscillator is a momentum indicator that compares a particular closing price of a security to a range of its prices over a certain period. It’s useful for identifying overbought and oversold conditions.
Fibonacci Retracement
This tool uses mathematical relationships to identify potential support and resistance levels, based on the idea that markets retrace a predictable portion of a prior move before continuing in the original direction.
Common Pitfalls for Swing Traders on NSE
Avoiding common mistakes is as crucial as employing effective strategies for sustained success in swing trading the Indian stock market.

Many aspiring swing traders on NSE falter due to a few recurring errors. Recognizing these pitfalls and actively working to avoid them is a critical step towards becoming a consistently profitable trader. These mistakes often stem from emotional trading, lack of discipline, or inadequate preparation.
Over-trading
Entering too many trades, often driven by boredom or the fear of missing out (FOMO), leads to increased transaction costs and poor decision-making.
Ignoring Stop-Loss Orders
Failing to set or honour stop-loss orders can turn small potential losses into catastrophic ones, wiping out trading capital.
Lack of a Trading Plan
Trading without a clear plan, including entry/exit rules, risk management, and strategy, leads to impulsive and emotional decisions.
Chasing Favourable News
Entering trades solely based on news headlines without technical confirmation often results in buying at the top or selling at the bottom.
Impatience
Expecting immediate results or exiting profitable trades too early before they reach their potential can significantly limit gains.
Frequently Asked Questions
What is a good profit target for a swing trade on NSE?
A common target for swing trades on NSE is between 5% and 15% profit per trade. This range is achievable within the typical holding period and balances potential returns with realistic market movements.
How much capital is needed for swing trading?
While you can start with a smaller amount, a capital of ₹50,000 to ₹1,00,000 is often recommended for swing trading to allow for proper position sizing and to absorb potential losses effectively.
Can I use swing trading strategies for cryptocurrencies?
Yes, many swing trading principles and strategies, particularly those based on technical analysis like moving averages and RSI, can be applied to cryptocurrencies due to their price volatility.
What is the difference between swing trading and position trading?
Swing trading typically holds positions for days to weeks, focusing on capturing shorter-term price swings. Position trading holds positions for weeks to months, aiming to capture longer-term trends.
How often should I check my swing trades?
Swing trades typically require monitoring once or twice a day. Over-monitoring can lead to impulsive decisions, while under-monitoring can result in missed opportunities or larger-than-expected losses.
What are the best NSE stocks for swing trading?
Generally, large-cap and mid-cap stocks with high liquidity on NSE are best for swing trading. Stocks that exhibit clear trends and have a history of predictable price movements are also preferred.
Key Takeaways:
- Swing trading on NSE aims to capture short-to-medium term price movements (days to weeks).
- Strategies like Moving Average Crossovers, RSI Divergence, and Breakouts are effective.
- Strict risk management, including stop-loss orders and position sizing, is crucial.
- Technical indicators such as RSI, MACD, and Bollinger Bands aid in decision-making.
- Avoiding common pitfalls like over-trading and ignoring stop-losses is vital for success.
- A well-defined trading plan and consistent review are essential for refinement.
- Liquidity and clear trends are key characteristics when selecting NSE stocks for swing trading.
Disclaimer: Trading in the Indian stock market involves risks. Please consult a SEBI-registered investment advisor before making any investment decisions.





 Finovatives