
TL;DR: Effective swing trading strategies for NSE stocks involve identifying short-to-medium term trends using technical analysis, setting clear entry/exit points with stop-losses, and managing risk diligently. Key approaches include trend following, breakout trading, and pullback strategies, often enhanced by indicators like Moving Averages and RSI.
Key Stats at a Glance:
- Nifty 50’s average daily traded volume: Over ₹8,000 Crore (as of recent data)
- NSE lists over 2,000+ companies, offering ample swing trading opportunities.
- Typical swing trade duration: 2 days to 2 weeks.
- Average daily price movement (volatility) across NSE stocks: Varies, but often provides 1-5% opportunities for swing traders.
- SEBI mandates strict risk management rules for all trading activities.
What is Swing Trading?
Swing trading is a short-to-medium term trading strategy where traders aim to capture gains within a specific price ‘swing,’ typically lasting from a few days to several weeks. Unlike day traders who close positions daily, swing traders hold positions overnight, seeking to profit from the anticipated upward or downward movement of an asset’s price.
The Goal of Swing Trading
The primary objective of swing trading is to profit from price fluctuations that occur over a period longer than a single day but shorter than a long-term investment horizon. Swing traders identify potential trends and look for optimal entry and exit points to capitalize on these price movements, often seeking gains of 5-15% per trade.
Why Swing Trade NSE Stocks?
Swing trading is particularly well-suited for the Indian stock market (NSE) due to its inherent volatility and the availability of a wide range of liquid stocks. The NSE, being one of the world’s largest exchanges by number of listed companies (over 2,000), offers numerous opportunities for traders to spot price swings. The 2-week to 2-month trading cycle aligns well with the market’s natural fluctuations, allowing traders to capture these moves without the intense time commitment of day trading.
Volatility and Opportunity
The Indian stock market, while showing strong long-term growth, exhibits short-term price swings driven by news, economic data, and sector-specific developments. These movements create opportunities for swing traders to enter and exit positions profitably. SEBI’s regulations ensure a fair and transparent market, further supporting structured trading approaches.

[Image: A chart showing a stock price trend with entry and exit points highlighted, representing a swing trade opportunity on the NSE.]
Popular Swing Trading Strategies
Several popular and effective strategies can be employed by swing traders in the NSE. These strategies often rely on a combination of technical analysis tools and chart patterns to identify potential trade setups. The key is to find a strategy that aligns with your risk tolerance and trading style.
Trend Following Strategy
This strategy involves identifying an established uptrend or downtrend and trading in the direction of that trend. Traders look for stocks that are consistently making higher highs and higher lows (uptrend) or lower highs and lower lows (downtrend). Entry is typically made on pullbacks or consolidations within the trend, and exits occur when signs of trend reversal appear.
Using Moving Averages
Moving averages (like the 50-day and 200-day MA) are crucial tools for trend identification. An uptrend is confirmed when the price is above both MAs, and the shorter-term MA is above the longer-term MA. Traders might enter a long position when the price pulls back to a key MA and shows signs of resuming the trend. Conversely, in a downtrend, traders look for bounces to the MAs before entering short positions.
Breakout Trading Strategy
Breakout trading focuses on identifying periods of consolidation or price ranges and entering a trade when the price decisively moves beyond these levels. A bullish breakout occurs when the price moves above a resistance level, signalling a potential upward move. A bearish breakout happens when the price falls below a support level, suggesting a potential downward move. Confirmation is key – traders often wait for a clear break with increased volume.
Pullback Strategy
This strategy is often used in trending markets. Traders wait for a stock in an uptrend to experience a temporary price dip (a pullback) towards a support level or a moving average before re-entering the trade. The belief is that the underlying trend will continue after the brief correction. Stop-losses are typically placed below the support level or the recent swing low.

[Image: A candlestick chart illustrating a pullback strategy on an NSE stock, showing entry after a dip to a support line.]
Key Technical Indicators for Swing Trading
Technical indicators are mathematical calculations based on price and volume data that help traders identify potential trading opportunities and manage risk. For swing trading on the NSE, certain indicators are particularly useful for confirming trends, momentum, and potential reversal points.
Relative Strength Index (RSI)
The RSI is a momentum oscillator that measures the speed and change of price movements. It oscillates between 0 and 100. Readings above 70 are generally considered overbought, suggesting a potential price decline, while readings below 30 are considered oversold, indicating a potential price increase. Swing traders use RSI to identify overbought/oversold conditions and look for divergences (when price makes a new high/low, but RSI doesn’t).
Moving Average Convergence Divergence (MACD)
MACD is a trend-following momentum indicator that shows the relationship between two exponential moving averages of a security’s price. It consists of the MACD line, the signal line (an EMA of the MACD line), and a histogram. A bullish crossover occurs when the MACD line crosses above the signal line, suggesting upward momentum. A bearish crossover happens when the MACD line crosses below the signal line, indicating downward momentum. Traders often look for MACD to confirm trend direction and identify potential turning points.
Volume Analysis
Volume is a crucial indicator for confirming the strength of a price move. A breakout or trend continuation that occurs on high volume is generally considered more significant and sustainable than one occurring on low volume. Conversely, declining volume during a pullback might suggest that selling pressure is waning, and the trend is likely to resume. Observing volume patterns alongside price action provides a more robust trading signal.
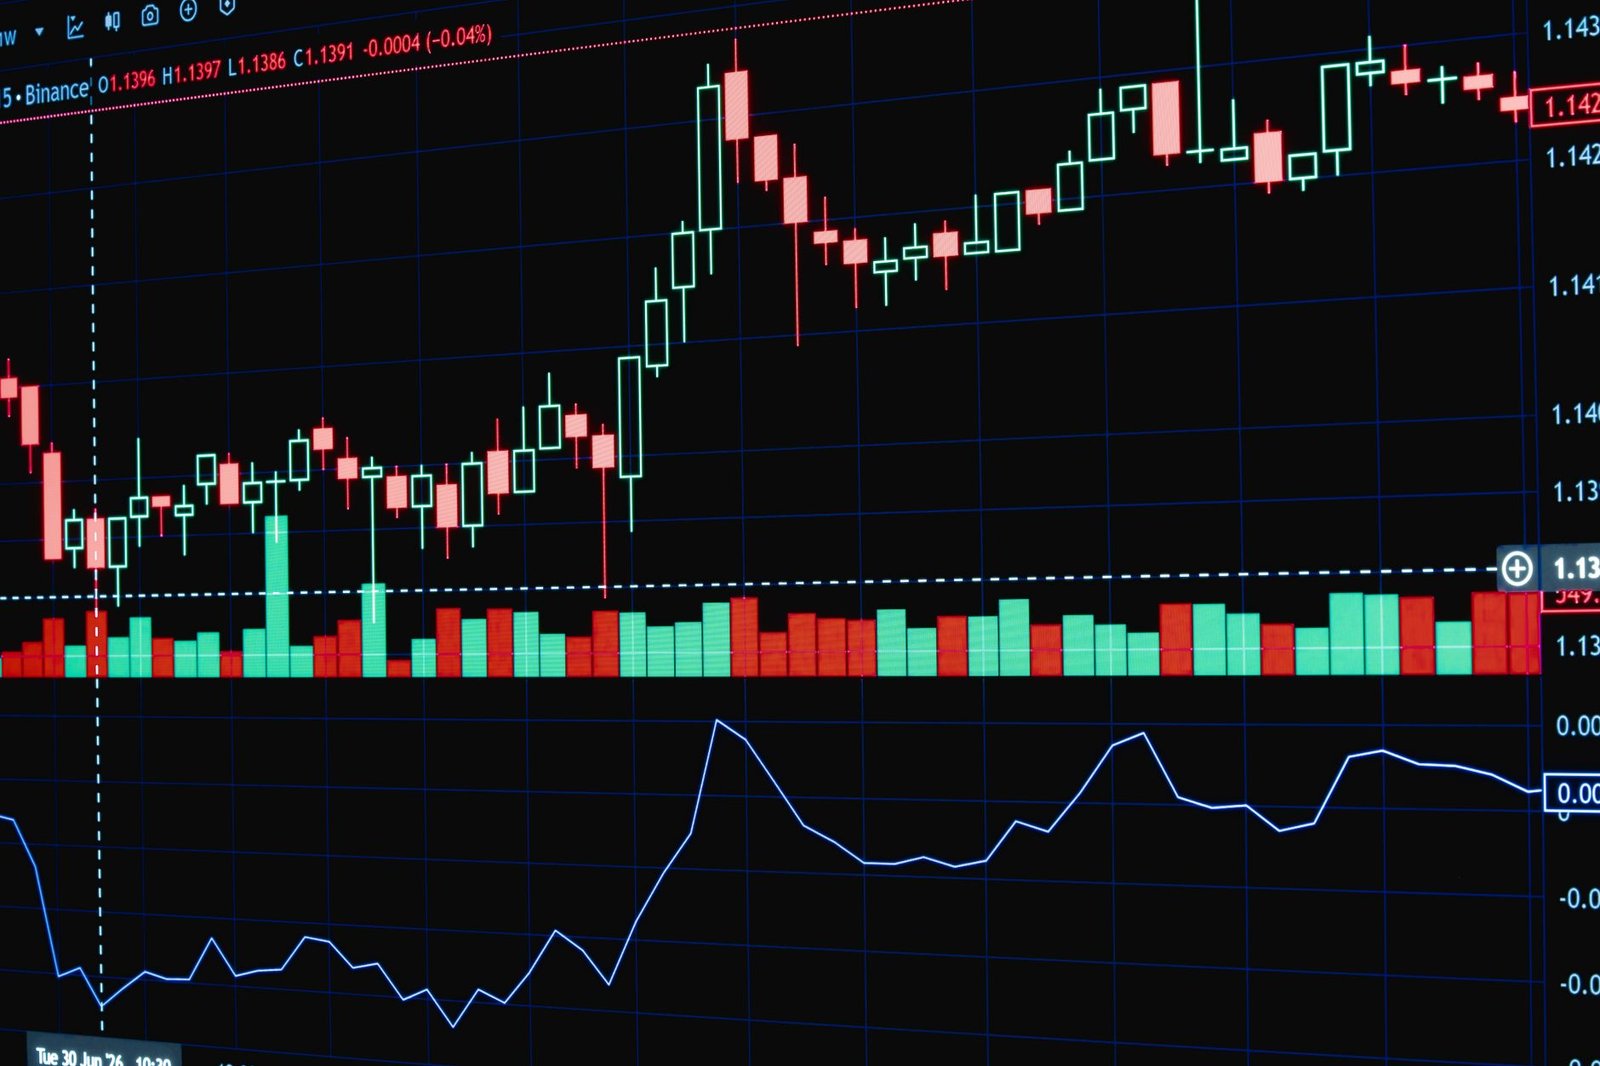
[Image: A stock chart showing MACD and RSI indicators below the price, illustrating their application in identifying trade signals.]
Risk Management in Swing Trading
Effective risk management is paramount for successful swing trading. Without it, even the best strategies can lead to significant losses. SEBI’s focus on investor protection underscores the importance of sound risk management practices.
Setting Stop-Loss Orders
A stop-loss order is an essential tool that automatically closes a trade when the price reaches a predetermined level, limiting potential losses. For swing traders, stop-losses are typically placed below key support levels for long positions or above key resistance levels for short positions. The placement should allow the trade some room to breathe without being too wide, which would increase the risk per trade.
Position Sizing
Position sizing determines how much capital to allocate to a single trade. A common rule is to risk no more than 1-2% of your total trading capital on any single trade. This means calculating the number of shares to buy or sell based on the distance to your stop-loss order and your predetermined risk percentage. For example, if you have ₹1,00,000 capital and decide to risk 1%, you can lose ₹1,000 per trade. If your stop-loss is ₹10 away from your entry, you can buy 100 shares (₹1,000 / ₹10 per share).
Trade Management
Once a trade is opened, active management is often required. This can involve moving the stop-loss to break-even once the trade moves in your favour, or using trailing stop-losses to lock in profits as the price advances. It also means having the discipline to exit the trade when your exit criteria are met, whether it’s hitting a profit target or a stop-loss.

[Image: A graphic illustrating the concept of position sizing in trading, showing how to calculate the number of shares based on capital and stop-loss.]
How to Start Swing Trading NSE Stocks
Embarking on swing trading requires a structured approach. Begin with education, practice, and a clear plan. Here’s a step-by-step guide:
- Educate Yourself: Thoroughly understand technical analysis, chart patterns, and the strategies mentioned above. Read books, follow reputable financial news sources, and consider resources from NSE India.
- Choose Your Stocks: Focus on liquid NSE stocks with sufficient volatility and trading volume. Look for stocks that exhibit clear trends or consolidation patterns.
- Develop a Trading Plan: Define your strategy, entry and exit rules, stop-loss levels, profit targets, and risk management parameters (e.g., risk per trade, position sizing).
- Backtest Your Strategy: Test your chosen strategy on historical data to see how it would have performed. This helps refine your rules and build confidence.
- Start with a Demo Account: Practice your strategy in a simulated trading environment. Many platforms offer paper trading or demo accounts, allowing you to trade with virtual money.
- Begin with Small Capital: Once you transition to live trading, start with a small amount of capital that you can afford to lose. This helps you manage emotions and gain real-world experience.
- Use Trading Tools: Leverage charting platforms and indicators. Tools like TradingView indicators can provide valuable insights. Consider using Finovatives’ Trend Traders Tool for enhanced analysis.
- Review and Adapt: Regularly review your trades, identify what worked and what didn’t, and adapt your strategy accordingly. Continuous learning and refinement are key.
Frequently Asked Questions
What is the ideal holding period for a swing trade?
A typical swing trade is held for a period ranging from a few days to several weeks, aiming to capture a significant portion of a price ‘swing’ without the commitment of long-term investing.
How much capital is needed to start swing trading?
While there’s no fixed minimum, it’s advisable to start with capital you can afford to lose. Begin with a small sum, and gradually increase it as you gain experience and profitability, adhering to risk management principles.
Which are the best indicators for swing trading NSE stocks?
Popular indicators include Moving Averages (50-day, 200-day), Relative Strength Index (RSI), MACD, and Volume analysis. These help identify trends, momentum, and potential entry/exit points.
Is swing trading suitable for beginners?
Yes, swing trading can be suitable for beginners willing to invest time in learning technical analysis and risk management. It requires less active monitoring than day trading but more strategy than long-term investing.
How important is risk management in swing trading?
Risk management is critical. It involves setting stop-losses, appropriate position sizing (risking 1-2% of capital per trade), and disciplined trade execution to protect capital and ensure long-term viability.
What are the main risks associated with swing trading?
Risks include overnight risk (gaps due to news), false breakouts, unexpected market volatility, and emotional decision-making. Strict adherence to a trading plan and risk management is essential.

[Image: A visual representation of a trader reviewing charts and market data on a laptop, signifying the analytical aspect of swing trading.]
Key Takeaways
- Swing trading aims to profit from short-to-medium term price movements (days to weeks) in NSE stocks.
- Effective strategies include trend following, breakout trading, and pullback methods.
- Technical indicators like Moving Averages, RSI, and MACD are vital for analysis.
- Volume analysis confirms the strength of price moves.
- Strict risk management, including stop-losses and position sizing, is crucial for success.
- A well-defined trading plan and continuous learning are essential for aspiring swing traders.
- Practice with demo accounts before trading live capital.
Trading in securities is subject to market risks. Please read all related documents carefully before investing. Investments in the stock market are subject to market risks; read all the scheme related documents carefully before investing.





 Finovatives