TL;DR: Market breadth indicators help gauge the overall participation of stocks in market movements, indicating the strength or weakness of a trend, and enabling traders to make more informed decisions by looking beyond individual stock prices.
Key Stats at a Glance:
- Advance/Decline Line: Over 20,000 data points analysed daily across NSE and BSE.
- Breadth Thrust Indicator: Historically, a reading above 70% suggests strong bullish momentum.
- New Highs/New Lows Ratio: Can reach extremes of 5:1 or 1:5 during strong trends.
- Volume Advance/Decline: Reflects the cumulative volume behind advancing vs. declining stocks.
- India VIX: Often inversely correlated with broad market strength; a low VIX suggests broad participation.
What are Market Breadth Indicators?
Market breadth indicators are technical analysis tools that measure the extent to which individual stocks are participating in a market’s overall movement, offering a broader perspective than price-based indicators alone.
Essentially, they look at the ‘number’ of stocks moving up versus the ‘number’ of stocks moving down, or the volume associated with those moves. This helps traders understand if a market index’s movement is supported by a wide base of stocks (indicating a healthy trend) or by a few large-cap stocks (which might signal a weaker, potentially unsustainable trend).
The Importance of Breadth in Indian Markets
In the dynamic Indian stock market, understanding breadth is particularly vital. The National Stock Exchange (NSE) and Bombay Stock Exchange (BSE) host a vast array of companies across various sectors. A rally in the Nifty 50 or Sensex might be driven by a handful of heavyweight stocks, while the majority of the market could be languishing or declining. Breadth indicators help identify these divergences, providing an early warning system for potential trend reversals or confirming the strength of an ongoing trend.
Advance/Decline Line (A/D Line)
The Advance/Decline Line is one of the most fundamental breadth indicators. It is calculated by taking the difference between the number of advancing stocks and declining stocks on an exchange (like the NSE) for a given period (usually a day) and cumulatively adding this difference to the previous day’s total. The formula is:
A/D Line = (Number of Advancing Stocks - Number of Declining Stocks) + Previous A/D Line Value
Interpreting the A/D Line
When the A/D Line moves in the same direction as the market index, it confirms the trend. If the index is making new highs but the A/D Line is not, it signals a divergence, suggesting weakening market participation and a potential reversal. Conversely, if the index is falling and the A/D Line is rising, it indicates that fewer stocks are participating in the decline, which could be a bullish sign.
How Can Market Breadth Indicators Improve Trading Decisions?
Market breadth indicators improve trading decisions by providing a reality check on the underlying strength of market trends, helping traders avoid premature entries or exits and identify potential turning points.
Confirming Trends
When an index like the Nifty 50 is trending upwards and the Advance/Decline Line is also making higher highs, it reinforces the bullish sentiment. This confirmation allows traders to be more confident in their long positions or to look for buying opportunities on pullbacks. Similarly, in a downtrend, a falling index accompanied by a falling A/D Line suggests strong selling pressure and reinforces the bearish outlook.
Identifying Divergences
Divergences are perhaps the most powerful signals generated by breadth indicators. For instance, if the Sensex reaches a new peak, but the A/D Line fails to surpass its previous high, it suggests that fewer stocks are contributing to the new high. This bearish divergence can be an early warning of an impending trend change, prompting traders to consider tightening their stop-losses or looking for shorting opportunities.
The Role of Volume
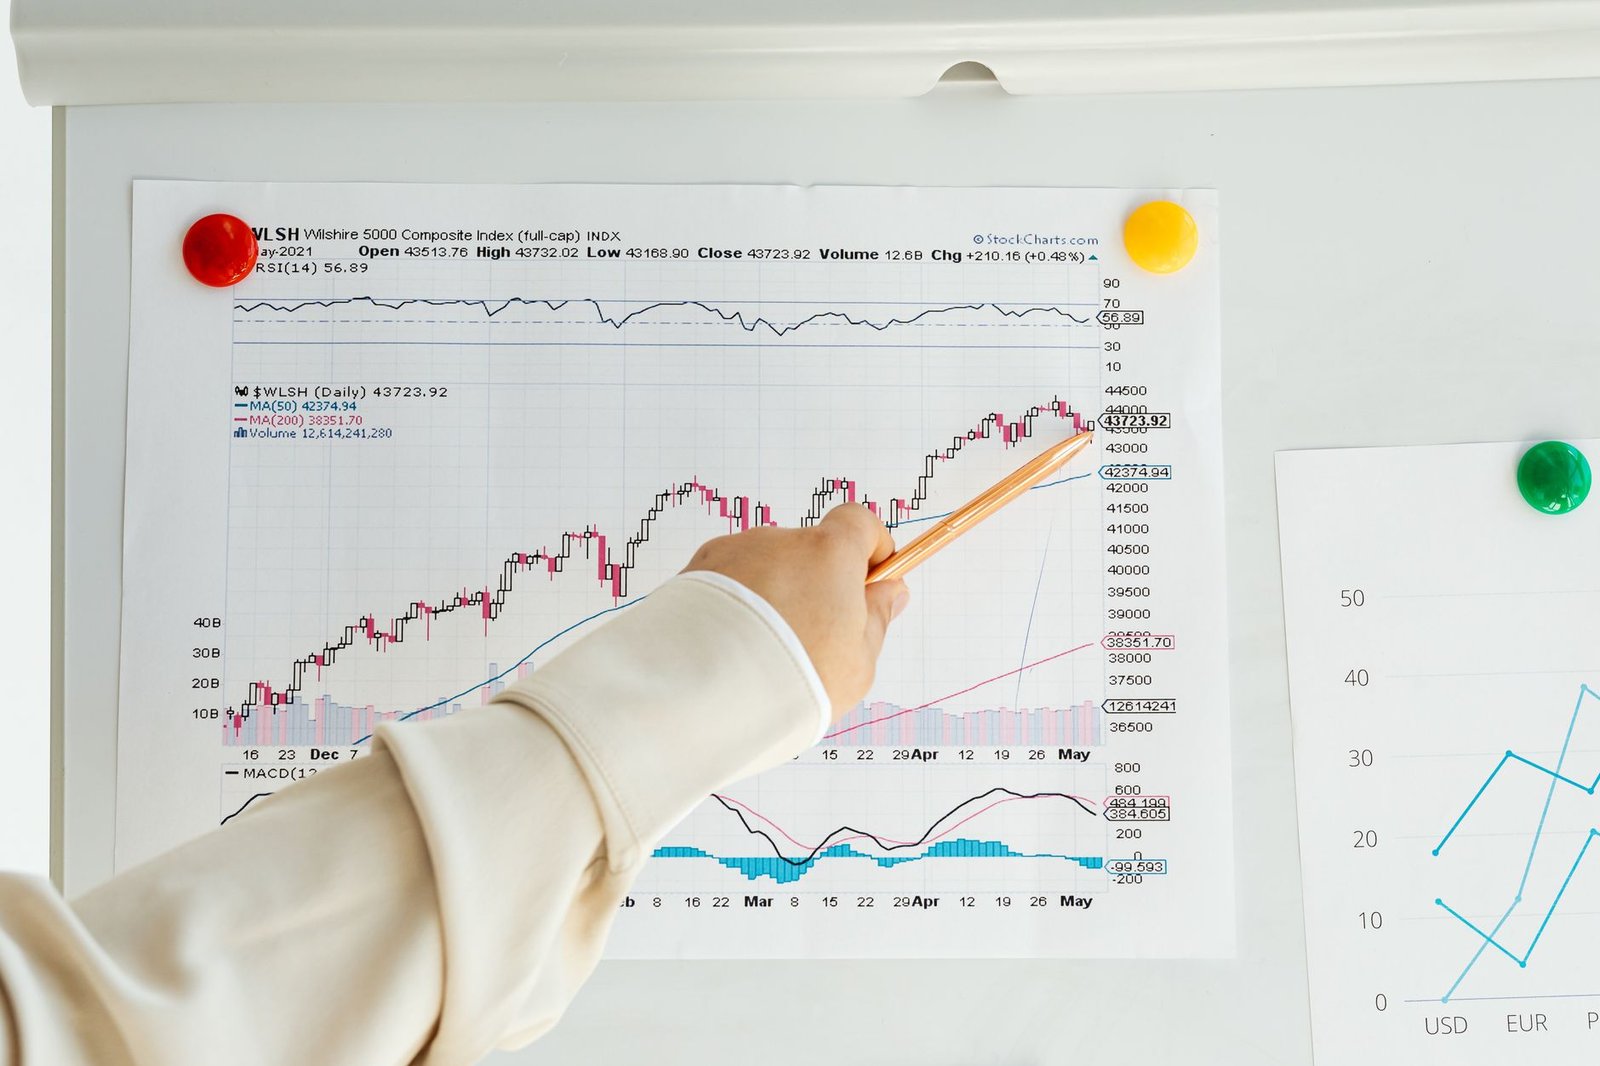
While the A/D Line focuses on the number of stocks, other indicators incorporate volume. The Volume Advance/Decline Line tracks the cumulative difference between the volume of advancing stocks and the volume of declining stocks. This provides insight into the conviction behind the price movements. A significant price move on low volume might be less reliable than the same move on high volume.
New Highs vs. New Lows
The New Highs/New Lows indicator compares the number of stocks reaching 52-week highs against those reaching 52-week lows. A high number of new highs relative to new lows indicates strong buying interest and a bullish market. A market dominated by new lows suggests widespread weakness and a bearish sentiment. Extreme readings can signal market tops or bottoms.
Breadth Thrust Indicator
The Breadth Thrust indicator, developed by Dr. Martin Zweig, measures the speed of money flow into the market. It’s calculated as the percentage of advancing stocks divided by the sum of advancing and declining stocks, typically over a 10-day period. A reading above 70% is considered bullish, indicating strong underlying demand, while a reading below 30% is bearish.
How to Use Market Breadth Indicators in Your Trading Strategy
Integrating market breadth indicators into your trading strategy requires a systematic approach. Here’s a step-by-step guide:
- Choose Your Indicators: Select 1-3 breadth indicators that resonate with your trading style, such as the A/D Line, New Highs/New Lows, or Volume A/D. Many charting platforms, including those offering TradingView indicators, provide these tools.
- Understand Market Context: Always analyse breadth indicators in conjunction with overall market trends and sentiment. Don’t rely on them in isolation.
- Look for Confirmations: Use breadth indicators to confirm the strength of trends identified through price action or other technical analysis methods.
- Identify Divergences: Actively search for divergences between price indices and breadth indicators. These are often strong signals of potential reversals.
- Consider Volume: When available, incorporate volume-based breadth indicators (like Volume A/D) to gauge the conviction behind price moves.
- Set Thresholds: Define your own ‘extreme’ levels or ‘buy/sell’ signals based on historical analysis of the indicator’s behaviour in the Indian market.
- Combine with Other Tools: Use breadth indicators alongside fundamental analysis, economic data, and other technical tools for a comprehensive view. Consider using a robust TradingView indicator like the Trend Traders Tool to synthesise multiple signals.
- Practice and Refine: Backtest your strategy using historical data and continuously refine your approach based on performance. A free trial can be a good way to test new tools.
Sectoral Breadth Analysis
Beyond the overall market, analysing breadth within specific sectors can be highly beneficial. For example, if the IT sector index is rising, but the breadth within the IT sector (number of IT stocks advancing vs. declining) is weak, it might suggest that the rally is concentrated in a few large IT companies, raising concerns about its sustainability.
Putting It All Together: A Practical Example
Imagine the Nifty 50 has been in an uptrend for several weeks. Price charts show higher highs and higher lows. However, upon checking the Advance/Decline Line, you notice it has failed to make a new high, plateauing instead. This divergence suggests that while the index is being pushed up, the underlying participation is waning. This might be a signal to become more cautious, perhaps reducing the size of new long positions or looking for signs of a trend reversal.
Common Mistakes to Avoid
Traders often make mistakes when using breadth indicators:
- Over-reliance: Treating breadth indicators as the sole decision-making tool.
- Ignoring Context: Using indicators without considering the broader market environment.
- Misinterpreting Divergences: Assuming every divergence will lead to an immediate reversal.
- Lack of Backtesting: Not testing strategies with historical data before deploying real capital.
- Chasing Extremes: Acting solely on extreme readings without confirmation.
Frequently Asked Questions
What is the most popular market breadth indicator in India?
While several are used, the Advance/Decline Line is a foundational and widely followed breadth indicator among Indian traders due to its simplicity and direct representation of market participation.
Can market breadth indicators predict exact turning points?
No, they are not precise timing tools. They provide probabilistic insights into trend strength and potential reversals, acting as confirmation or warning signals rather than definitive predictors.
How often should I check market breadth indicators?
For active traders, checking daily breadth data is recommended. Longer-term investors might find weekly or monthly analysis sufficient, depending on their investment horizon.
Are market breadth indicators useful for options trading?
Yes, especially for directional bets. Strong breadth can confirm a trend, increasing the probability of options expiring in the money. Weakening breadth might signal caution for bullish option strategies.
What is a ‘breadth thrust’?
A breadth thrust occurs when the market experiences a rapid and significant increase in the number of advancing stocks relative to declining stocks, often indicating the start of a new bull market or a strong resurgence in an existing one.
How does volume affect breadth indicators?
Volume-based breadth indicators (e.g., Volume A/D Line) provide a more robust signal by weighting the participation of stocks by their trading volume, indicating the conviction behind the price movements.
Key Takeaways
- Market breadth indicators measure the participation of stocks in market movements, offering insights into trend strength.
- The Advance/Decline Line and New Highs/New Lows are fundamental indicators for assessing breadth.
- Divergences between price indices and breadth indicators are crucial signals of potential trend changes.
- Volume-based breadth indicators add conviction to the analysis.
- Use breadth indicators in conjunction with other analysis tools, not in isolation.
- Consistent monitoring and backtesting are essential for effective application.
- Understanding sectoral breadth can reveal hidden market dynamics.
Trading in securities involves risks, and past performance is not indicative of future results. Always conduct your own research and consult with a SEBI-registered investment advisor before making any investment decisions.




 Finovatives