


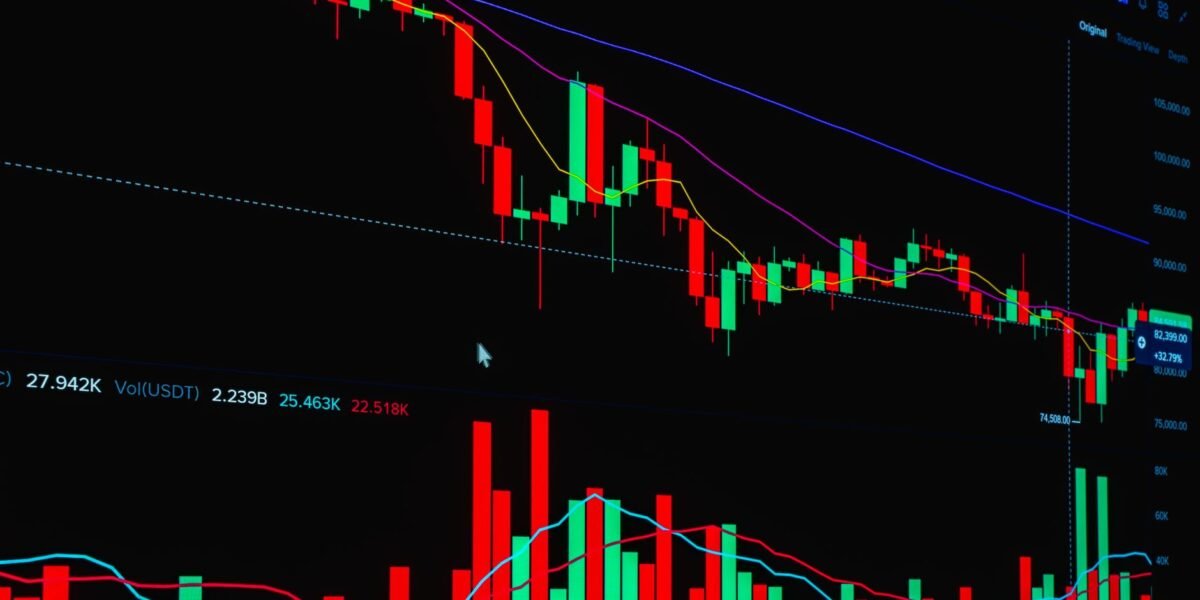
TL;DR: The RSI indicator helps identify potential trade entries by signalling overbought or oversold conditions, with common strategies involving divergences, centerline crossovers, and confirmation from other indicators for optimal timing.
Key Stats at a Glance:
- RSI standard period: 14
- Overbought threshold: Typically 70
- Oversold threshold: Typically 30
- NSE daily trading volume: Average ₹12,000 Crore+
- Number of actively traded stocks on BSE/NSE: Over 2,000
What is the RSI Indicator?
The Relative Strength Index (RSI) is a momentum oscillator that measures the speed and magnitude of recent price changes to evaluate overbought or oversold conditions in the price of a stock or other asset. Developed by J. Welles Wilder Jr., it oscillates between 0 and 100, providing traders with actionable insights into market sentiment and potential turning points.
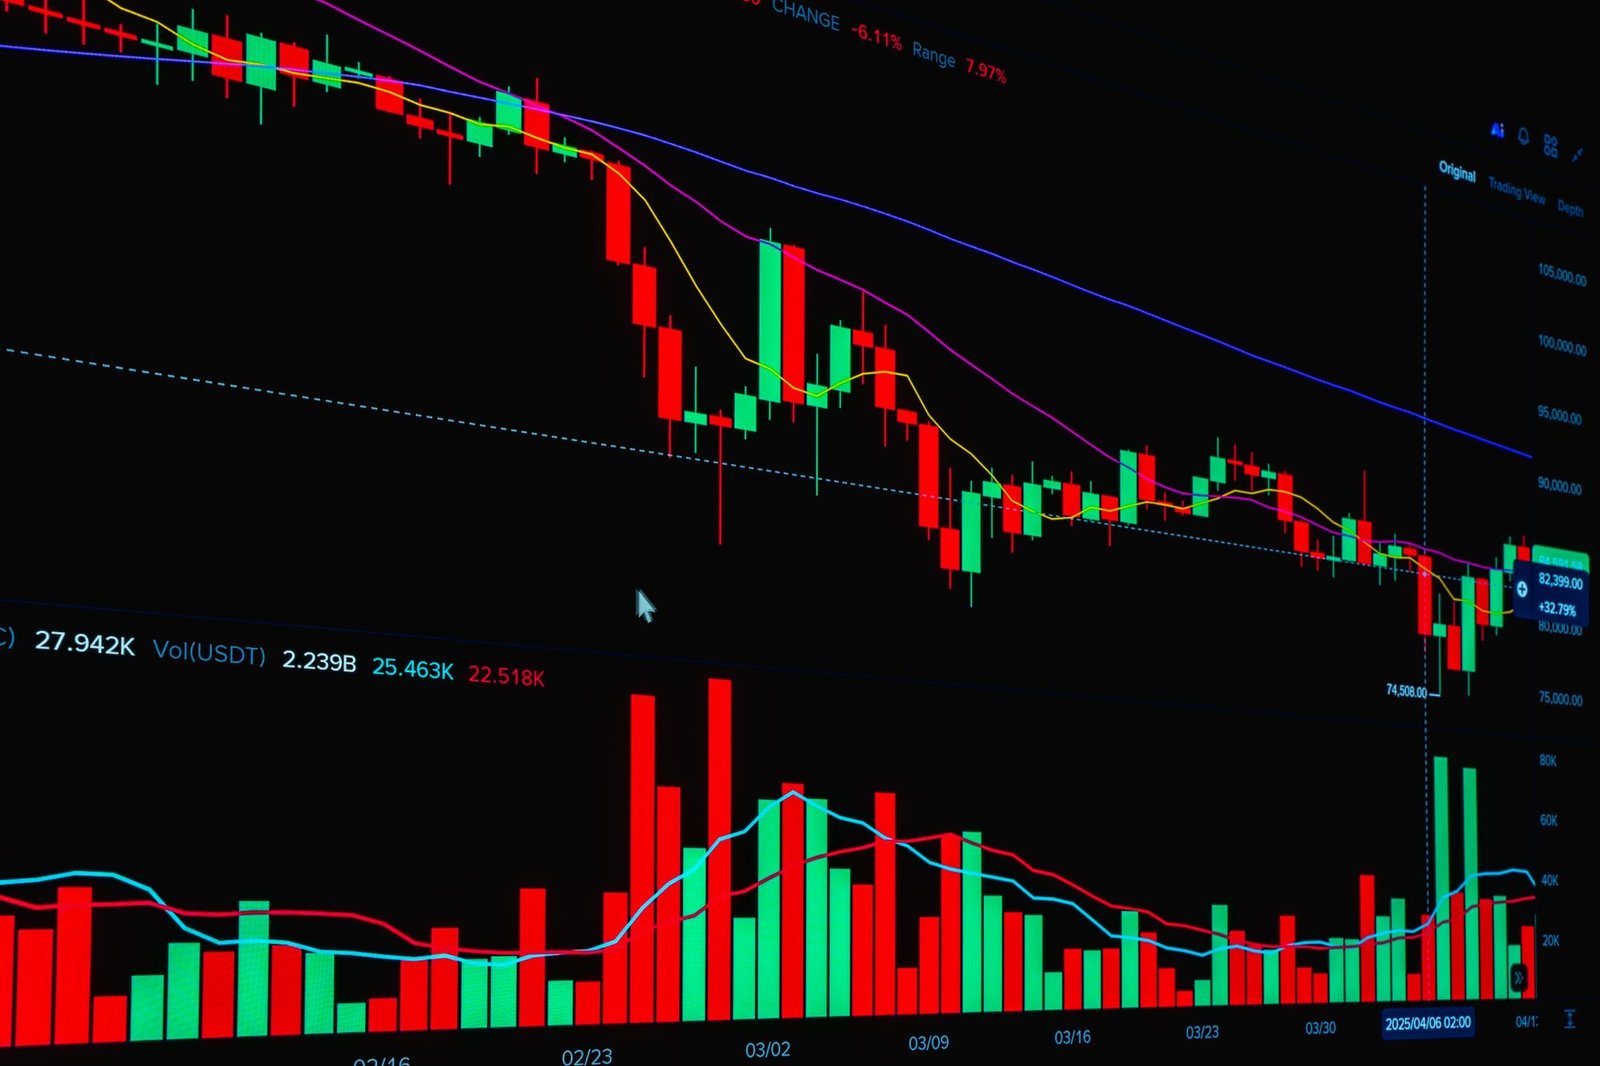
Its primary function is to help traders determine when an asset might be due for a price correction or reversal. By analysing the RSI, traders can gain a deeper understanding of the underlying momentum driving price action, which is crucial for making informed trading decisions on platforms like TradingView.
How Can the RSI Indicator Improve Trade Entries?
The RSI indicator can significantly enhance trade entry precision by highlighting potential market tops and bottoms, thereby allowing traders to enter positions at more favourable price levels. It helps filter out noise and focus on moments where momentum suggests a likely price shift, reducing the risk of entering trades against the prevailing trend’s exhaustion.
Identifying Overbought and Oversold Conditions
The most fundamental use of the RSI is to spot when an asset is potentially overbought or oversold. Readings above 70 generally indicate that an asset is overbought, suggesting that its price has risen too quickly and may be due for a pullback or reversal downwards. Conversely, readings below 30 suggest an oversold condition, implying that the price has fallen too rapidly and might be poised for a bounce or reversal upwards. These levels are not absolute buy/sell signals but rather indicators of extreme price movement that warrant further investigation.
Using RSI Divergences for Entry Signals
Divergences occur when the price action of an asset moves in one direction, while the RSI moves in the opposite direction. This is a powerful signal for potential trend reversals. A bullish divergence happens when the price makes a new low, but the RSI makes a higher low, suggesting that the selling momentum is waning and a price increase may be imminent. A bearish divergence occurs when the price makes a new high, but the RSI makes a lower high, indicating that the buying momentum is weakening and a price decline could follow. These divergences are often considered more reliable signals when they occur at or near the overbought/oversold extremes.
RSI Centerline Crossovers
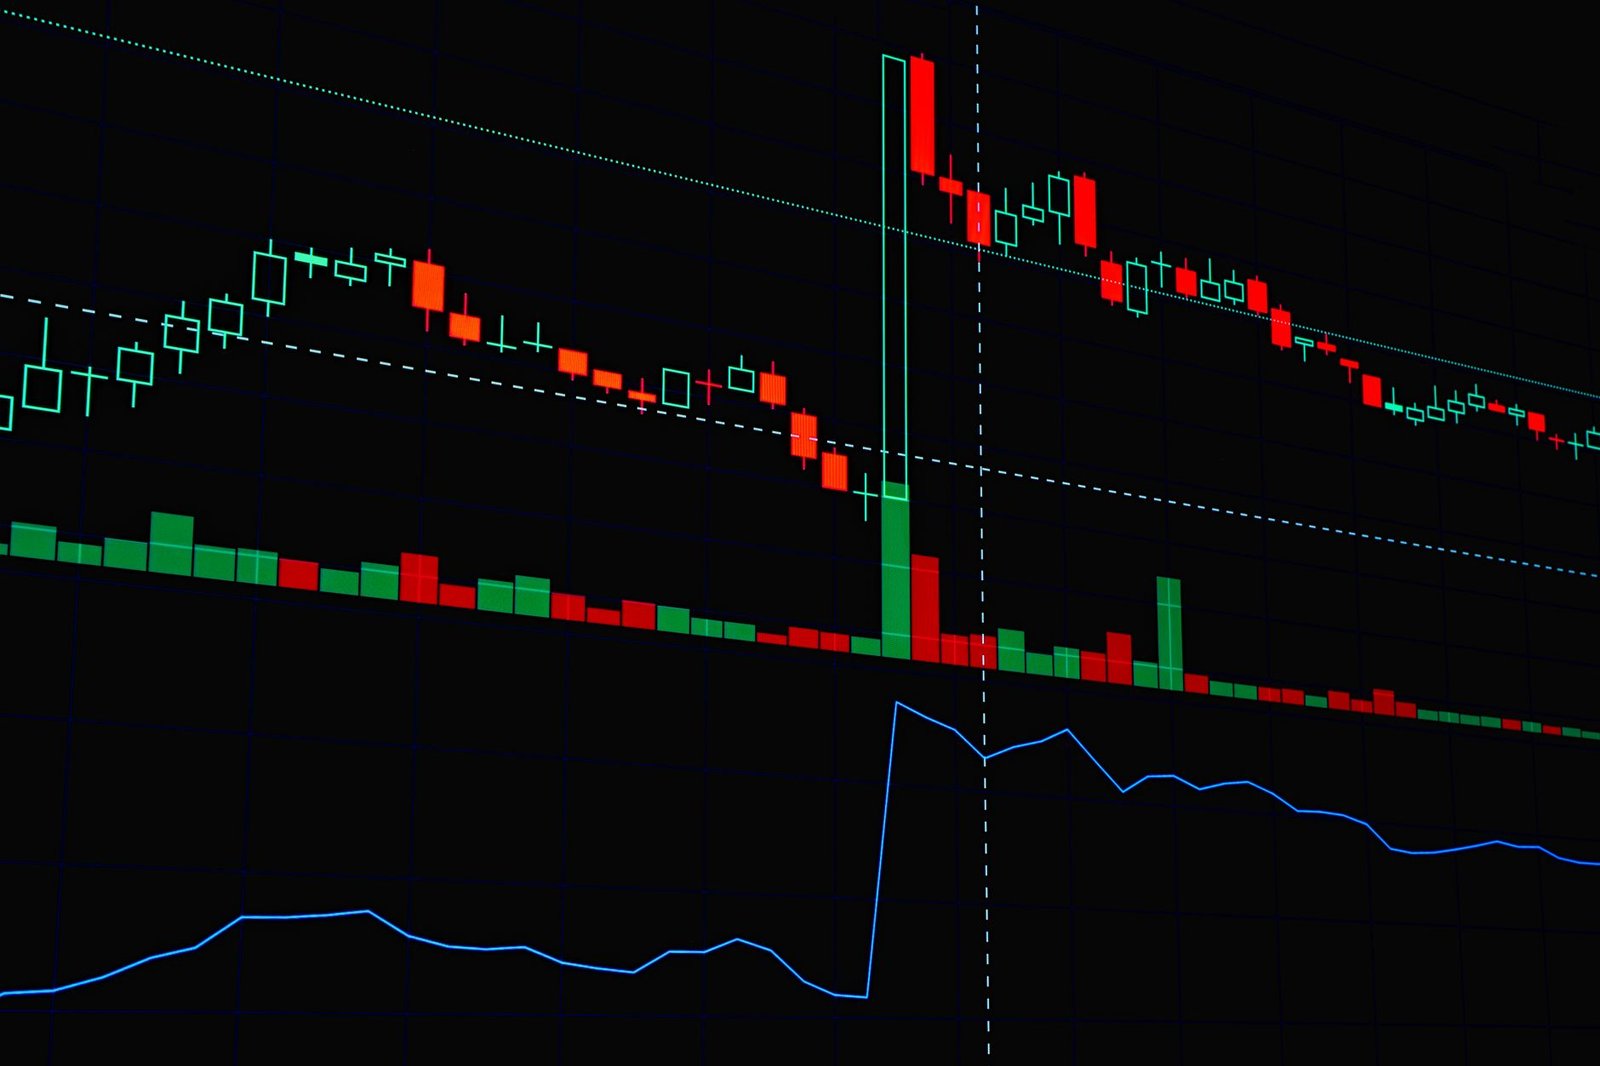
The centerline of the RSI, set at 50, can also provide valuable trading signals. A crossover above the 50 level can be interpreted as bullish momentum gaining strength, suggesting a potential uptrend. Traders might look for this signal as confirmation to enter a long position, especially if the price is also showing upward momentum. Conversely, a crossover below the 50 level is considered bearish, indicating that selling pressure is increasing and a downtrend may be starting. This can be a signal to consider entering a short position or exiting a long one.
Combining RSI with Other Indicators
While the RSI is a powerful tool on its own, its effectiveness is significantly amplified when used in conjunction with other technical analysis tools. For instance, a trader might wait for an RSI bullish divergence to occur near a support level identified by a moving average or Fibonacci retracement. Similarly, a bearish divergence confirmed by a resistance level or a bearish candlestick pattern can increase the probability of a successful short trade. This multi-indicator approach helps filter out false signals and confirms the validity of potential trade entries, aligning with robust strategies often discussed on Finovatives.
How to Use the RSI Indicator for Trade Entries
- Set up your charting platform: Access your preferred charting software or app (like TradingView) and add the RSI indicator to your price charts. Ensure the standard 14-period setting is applied initially.
- Identify Overbought/Oversold Levels: Observe the RSI line. If it moves above 70, consider potential selling opportunities or caution for new long entries. If it moves below 30, look for potential buying opportunities or caution for new short entries.
- Look for Divergences: Monitor the price action against the RSI. If prices are making new lows but the RSI is making higher lows (bullish divergence), it signals potential buying interest. If prices are making new highs but the RSI is making lower highs (bearish divergence), it signals potential selling interest.
- Check for Centerline Crossovers: Note when the RSI crosses above the 50 level (bullish signal) or below the 50 level (bearish signal). This confirms the underlying momentum direction.
- Confirm Signals with Price Action and Support/Resistance: Never trade solely on RSI signals. Wait for confirmation from candlestick patterns, price action breaking key levels, or clear support/resistance zones. For example, wait for a bullish divergence to be confirmed by a bullish candlestick pattern at a support level.
- Consider Trend Context: Use the RSI within the context of the larger trend. Bullish divergences are often more reliable in an uptrend, and bearish divergences in a downtrend.
- Manage Risk: Always use stop-loss orders to limit potential losses. The RSI can help identify entry points, but risk management is paramount for long-term success in trading.
- Backtest and Refine: Practice using the RSI on historical data or a paper trading account to understand its behaviour in different market conditions before risking real capital.
Understanding RSI Settings and Customisation
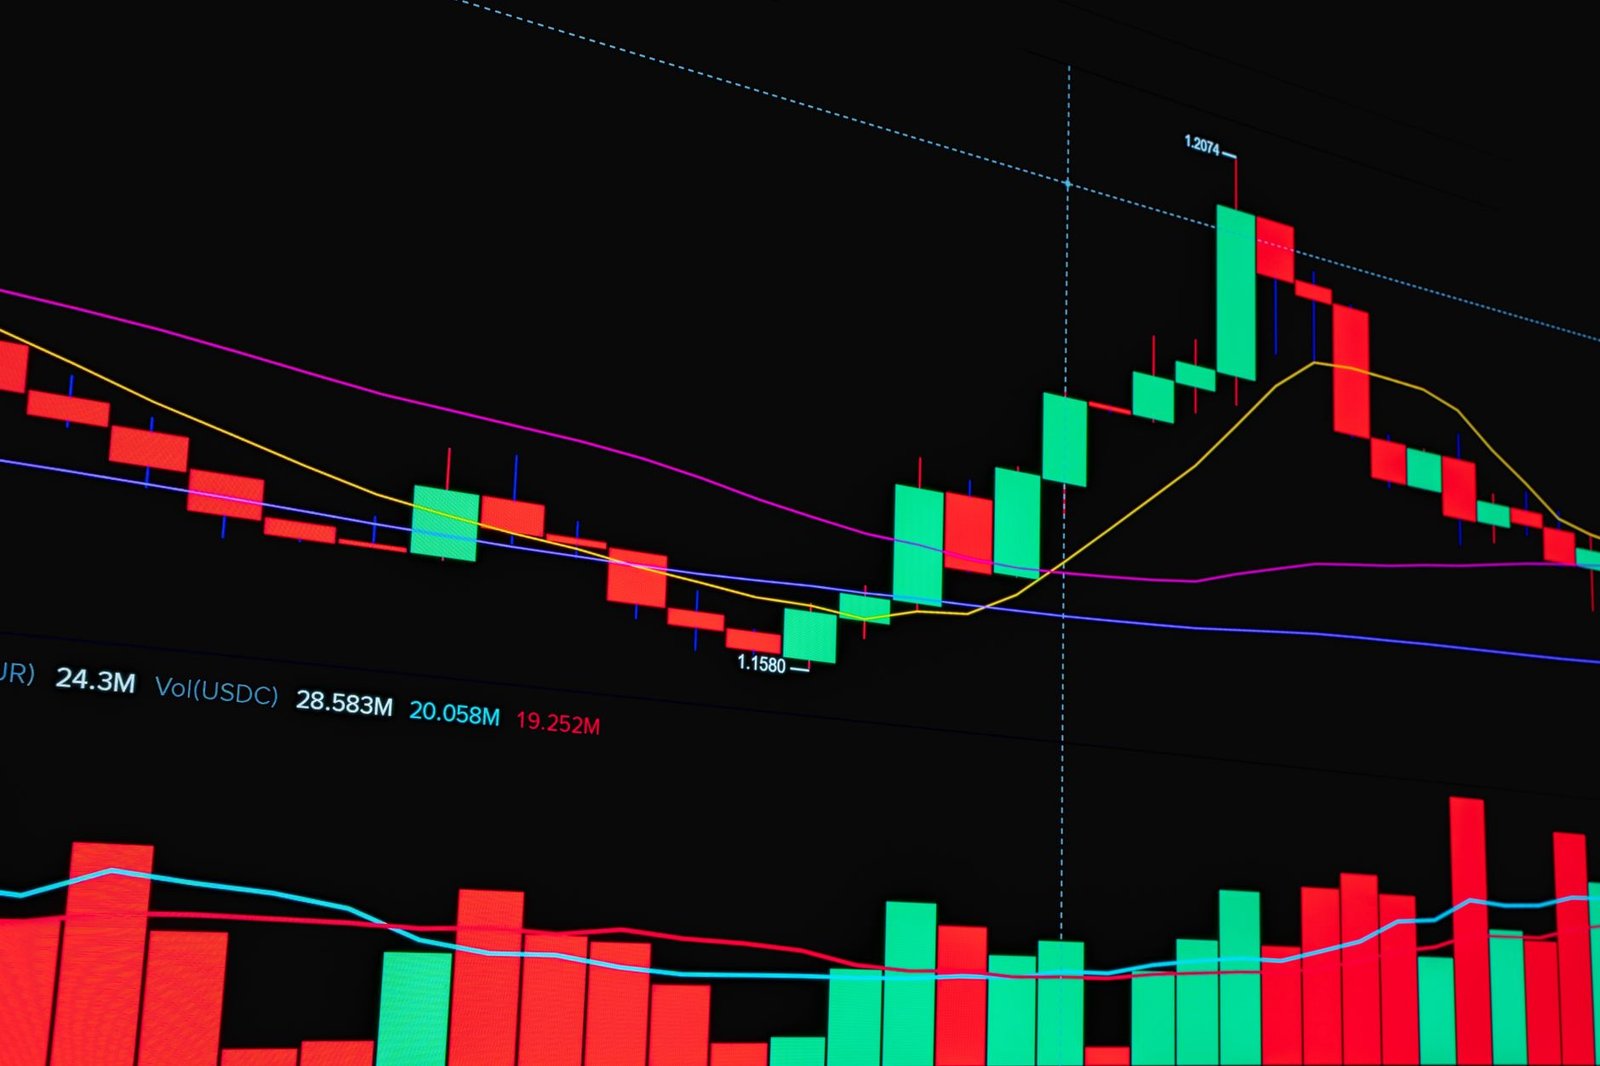
The standard RSI period is 14, which balances responsiveness with signal reliability. However, traders can adjust this period based on their trading style and the market’s volatility. A shorter period (e.g., 7 or 9) makes the RSI more sensitive to price changes, generating more frequent signals but also increasing the risk of false signals. A longer period (e.g., 21 or 25) smooths out the RSI, making it less sensitive and generating fewer, potentially more reliable signals, especially for longer-term trends. Some traders also experiment with different overbought/oversold levels, though 70/30 remain the most common starting points recommended by SEBI guidelines for risk awareness.
Common Pitfalls When Using RSI
One of the most significant pitfalls is treating overbought/oversold readings as direct buy/sell signals. An asset can remain overbought for extended periods during a strong uptrend, and oversold during a strong downtrend. Relying solely on RSI without considering the broader market trend or other confirming indicators can lead to premature entries or exits. Another common mistake is ignoring divergences or treating them as guaranteed reversals; they are probabilities, not certainties. Furthermore, traders often fail to implement proper risk management, leading to substantial losses when RSI signals don’t pan out as expected.
The Role of RSI in Different Market Conditions
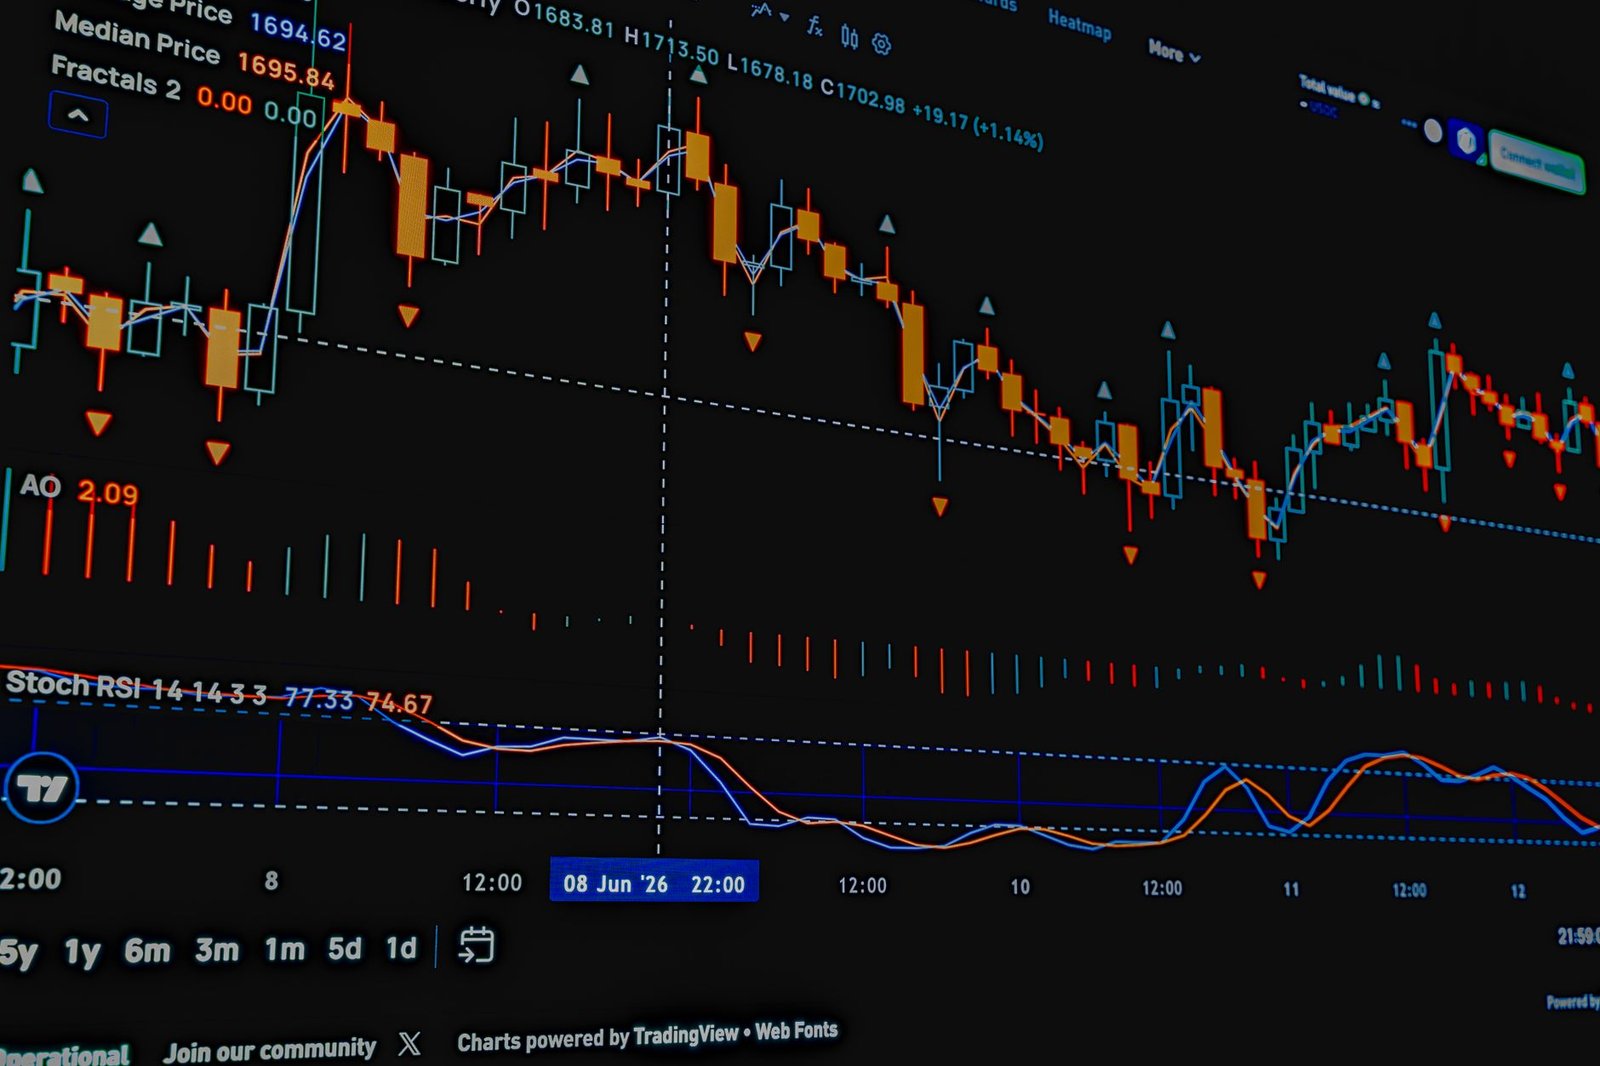
In trending markets, the RSI can be used to identify pullbacks to potentially enter in the direction of the trend. For example, in a strong uptrend, traders might wait for the RSI to dip towards the 40-50 area before looking for buy signals. Conversely, in a downtrend, they might wait for the RSI to rally towards the 50-60 area before looking for sell signals. In choppy or range-bound markets, the RSI is more effective at identifying true overbought and oversold levels, as prices tend to oscillate between defined support and resistance zones, making the 70/30 levels more predictive of reversals.
Frequently Asked Questions
What is the most common RSI setting?
The most common setting for the RSI indicator is a 14-period lookback. This setting is widely used by traders as it provides a good balance between responsiveness to price changes and signal filtering, making it suitable for various trading styles.
Can RSI predict exact price tops and bottoms?
No, the RSI cannot predict exact price tops and bottoms. It indicates potential overbought or oversold conditions and momentum shifts, which can precede reversals, but it does not provide precise timing for the absolute peak or trough.
When should I consider RSI divergences as strong signals?
RSI divergences are generally considered stronger signals when they occur at extreme levels (near overbought or oversold zones) and are confirmed by other technical factors like support/resistance levels or candlestick patterns.
Is RSI effective in all market conditions?
The RSI is most effective in trending markets for identifying pullbacks and in range-bound markets for spotting overbought/oversold extremes. Its effectiveness can diminish in highly volatile, choppy markets where signals may be less reliable.
How often should I check my RSI indicator?
The frequency of checking your RSI indicator depends on your trading timeframe. Intraday traders might check it every few minutes or hours, while swing or position traders might review it daily or weekly, aligning with their overall strategy.
Can I use RSI for cryptocurrency trading?
Yes, the RSI indicator is widely used and effective for trading cryptocurrencies, just as it is for stocks and forex. Its momentum-measuring capabilities apply to any asset with fluctuating prices.
Key Takeaways
- The RSI is a momentum oscillator measuring the speed and change of price movements, ranging from 0 to 100.
- Readings above 70 suggest overbought conditions, while readings below 30 suggest oversold conditions.
- RSI divergences (bullish and bearish) can signal potential trend reversals and are powerful entry/exit indicators.
- Centerline crossovers (above or below 50) provide insights into momentum shifts.
- Combining RSI with other technical tools and price action confirmation enhances its reliability.
- The standard 14-period setting is common, but adjustments can be made based on trading style and market conditions.
- Always use stop-loss orders and practice risk management when trading based on RSI signals.
Trading in the Indian stock market involves risks. Ensure you understand these risks before investing.






 Finovatives