

TL;DR: The RSI indicator helps traders identify overbought and oversold conditions by measuring the magnitude of recent price changes, allowing for more strategic entry and exit points in the Indian stock market.
Key Stats at a Glance:
- Nifty 50 has seen an average of 15-20% intra-day volatility in recent years.
- The RSI indicator oscillates between 0 and 100.
- A reading above 70 typically signals overbought conditions.
- A reading below 30 typically signals oversold conditions.
- Over 500,000 active traders use TradingView in India.
What is the RSI Indicator?
The Relative Strength Index (RSI) is a powerful momentum oscillator developed by J. Welles Wilder Jr. that measures the speed and magnitude of a stock’s or index’s recent price fluctuations to evaluate whether it is overbought or oversold.
Developed by J. Welles Wilder Jr., the RSI is a technical indicator that plots the speed and change of price movements. It’s designed to help traders identify potential turning points in the market by signalling when an asset might be overextended. The RSI oscillates between 0 and 100, making it a versatile tool for both short-term and long-term trading strategies across NSE, BSE, and MCX markets.
Understanding RSI Fundamentals
The core idea behind RSI is simple: when prices rise rapidly, the RSI goes up, and when prices fall rapidly, it goes down. It’s not about the direction of the price, but the *rate* of change. A standard RSI calculation uses a 14-period lookback, meaning it averages the gains and losses over the last 14 trading sessions to determine the current RSI value. This period can be adjusted by traders to suit their strategy, with shorter periods offering more sensitivity and longer periods providing smoother signals.
The RSI Calculation Explained
The RSI is calculated using the following formula:
RSI = 100 – [100 / (1 + Average Gain / Average Loss)]
Where:
- Average Gain: The average of positive price changes over a specific period (typically 14 days).
- Average Loss: The average of negative price changes over the same period.
Initially, the average gain and average loss are simple averages. For subsequent periods, a smoothed average is used, giving more weight to recent data. This calculation transforms raw price data into a momentum indicator that is easy to interpret against its 0-100 scale.
How Does RSI Help Identify Trade Entries?
The RSI indicator primarily helps identify trade entries by signalling overbought or oversold conditions, as well as by revealing bullish or bearish divergences, which often precede significant price movements.
The most common application of RSI for trade entries is identifying when an asset is in an extreme state. Readings above 70 are conventionally considered ‘overbought,’ suggesting the asset’s price may have risen too far, too fast, and could be due for a correction or reversal downwards. Conversely, readings below 30 are considered ‘oversold,’ indicating the price may have fallen too sharply and could be poised for a rebound. These levels are not absolute buy/sell signals but zones where traders look for confirmation before entering a trade.
Identifying Overbought and Oversold Levels
When the RSI moves above 70, it suggests that buying pressure has been exceptionally strong, potentially leading to a short-term peak. Traders might consider this a signal to look for shorting opportunities or to exit long positions. Conversely, when the RSI drops below 30, it indicates strong selling pressure, suggesting that the asset might be undervalued and could be a good time to consider a long entry. It’s crucial to remember that in strong trending markets, an asset can remain overbought or oversold for extended periods, so these levels should be used in conjunction with other indicators.
Recognizing Divergences for Entry Signals
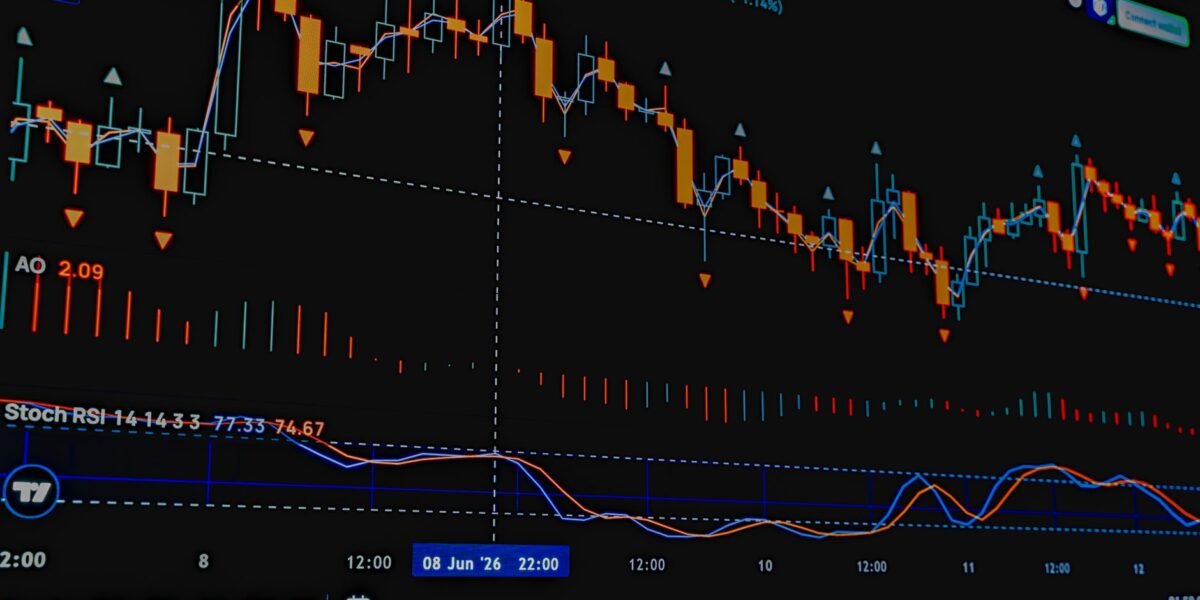
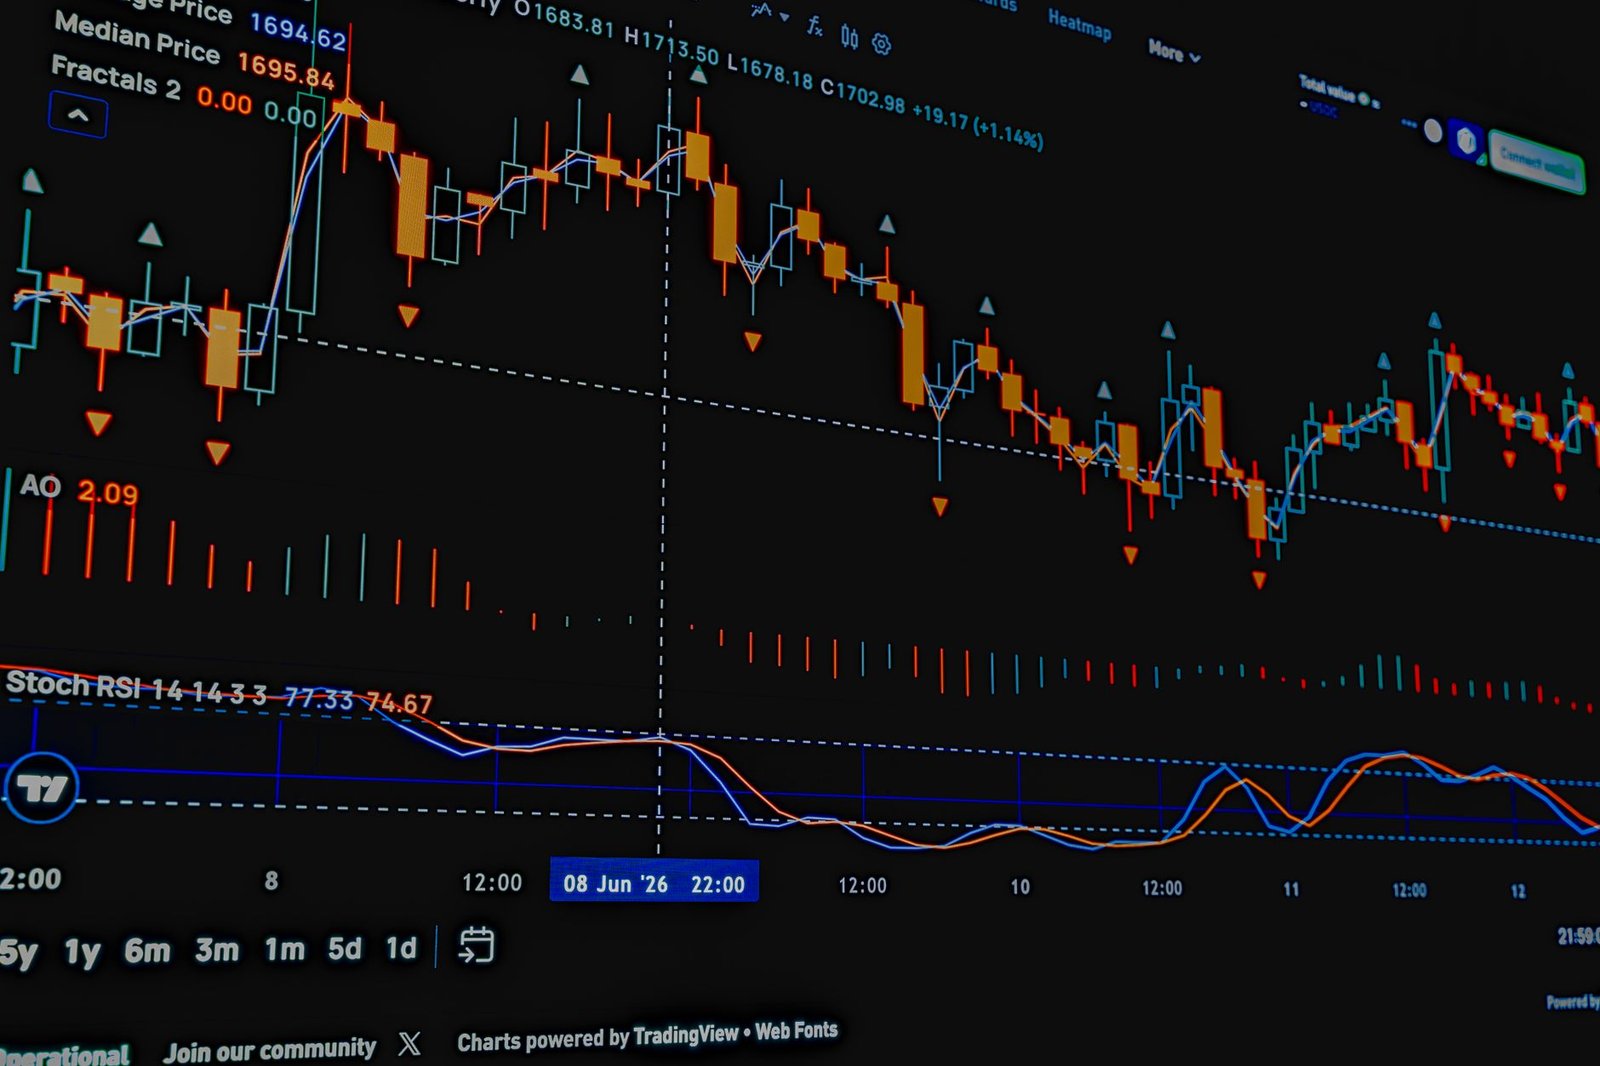
Perhaps the most potent use of RSI for entries lies in spotting divergences. A bullish divergence occurs when the price makes a new low, but the RSI makes a higher low. This suggests that the selling momentum is weakening, and a potential price reversal to the upside could be imminent. A bearish divergence happens when the price makes a new high, but the RSI makes a lower high, indicating that upward momentum is fading and a downward reversal might be approaching.
Using RSI in Different Market Conditions
The effectiveness of RSI can vary depending on the market trend. In a strong uptrend, the RSI might frequently stay above 50 and often hover in the 40-70 range for extended periods, only dipping below 50 temporarily. In such cases, using the 30-70 overbought/oversold levels for reversal signals can lead to missed opportunities or premature entries. Traders often adapt their strategy, perhaps looking for pullbacks to the 50 level as potential buy signals in an uptrend, or using the 70 level as a resistance indicator for short entries in a downtrend.
RSI in Trending Markets
In a strong uptrend, traders often look for the RSI to pull back towards the 40-50 level and then bounce higher as a confirmation of continued upward momentum. This offers a more conservative entry point than waiting for the RSI to exit an oversold condition. Similarly, in a strong downtrend, traders might wait for the RSI to rally towards the 50-60 level and then turn lower as confirmation of further downside. This approach helps avoid trying to catch a falling knife.
RSI in Sideways Markets
In a range-bound or sideways market, the traditional overbought (above 70) and oversold (below 30) levels become more reliable for identifying potential turning points. When the RSI reaches these extremes in a non-trending market, the probability of a reversal increases significantly. Traders might enter long positions when the RSI moves up from below 30, and short positions when it moves down from above 70.
How to Use RSI for Better Trade Entries
To effectively use the RSI indicator for better trade entries, traders should combine its signals with other technical analysis tools and confirm potential setups before committing capital.
Integrating RSI into your trading strategy requires a systematic approach. Simply relying on RSI alone can be misleading. The goal is to use RSI to enhance your decision-making process, not to replace it entirely. This involves understanding its nuances and confirming its signals with price action, support/resistance levels, or other indicators. For instance, a bullish divergence on the RSI is a stronger signal when it occurs at a significant support level on the price chart.
- Identify the Trend: Determine the overall market trend using price action, moving averages, or other trend-following indicators. This helps decide whether to look for bullish or bearish signals from the RSI.
- Locate Overbought/Oversold Conditions: Observe the RSI reading. If the price is in an uptrend, look for RSI dips towards or near the 40-50 zone. If in a downtrend, watch for RSI rallies towards or near the 50-60 zone. In a range-bound market, monitor for RSI touching or exceeding 70 (overbought) or falling below 30 (oversold).
- Look for Divergences: Actively scan for bullish divergences (price makes lower low, RSI makes higher low) or bearish divergences (price makes higher high, RSI makes lower high). These often precede trend changes.
- Seek Confirmation: Never enter a trade solely based on an RSI signal. Wait for price action confirmation. For example, after a bullish divergence and an RSI move up from below 30, wait for the price to break a short-term resistance level or show a bullish candlestick pattern.
- Consider Other Indicators: Use RSI in conjunction with other tools like Moving Averages, MACD, or Fibonacci levels. For instance, a buy signal from RSI combined with a crossover on your moving averages can be a powerful confirmation. Consider using a sophisticated TradingView indicator for multi-timeframe analysis.
- Manage Risk: Always use stop-loss orders to limit potential losses. Place your stop-loss below the recent low for a long trade or above the recent high for a short trade, especially when entering on a divergence signal.
- Backtest and Refine: Test your RSI strategy on historical data or a demo account to understand its performance and make necessary adjustments. Resources like Finovatives.com offer tools and insights for effective backtesting.
Combining RSI with Price Action
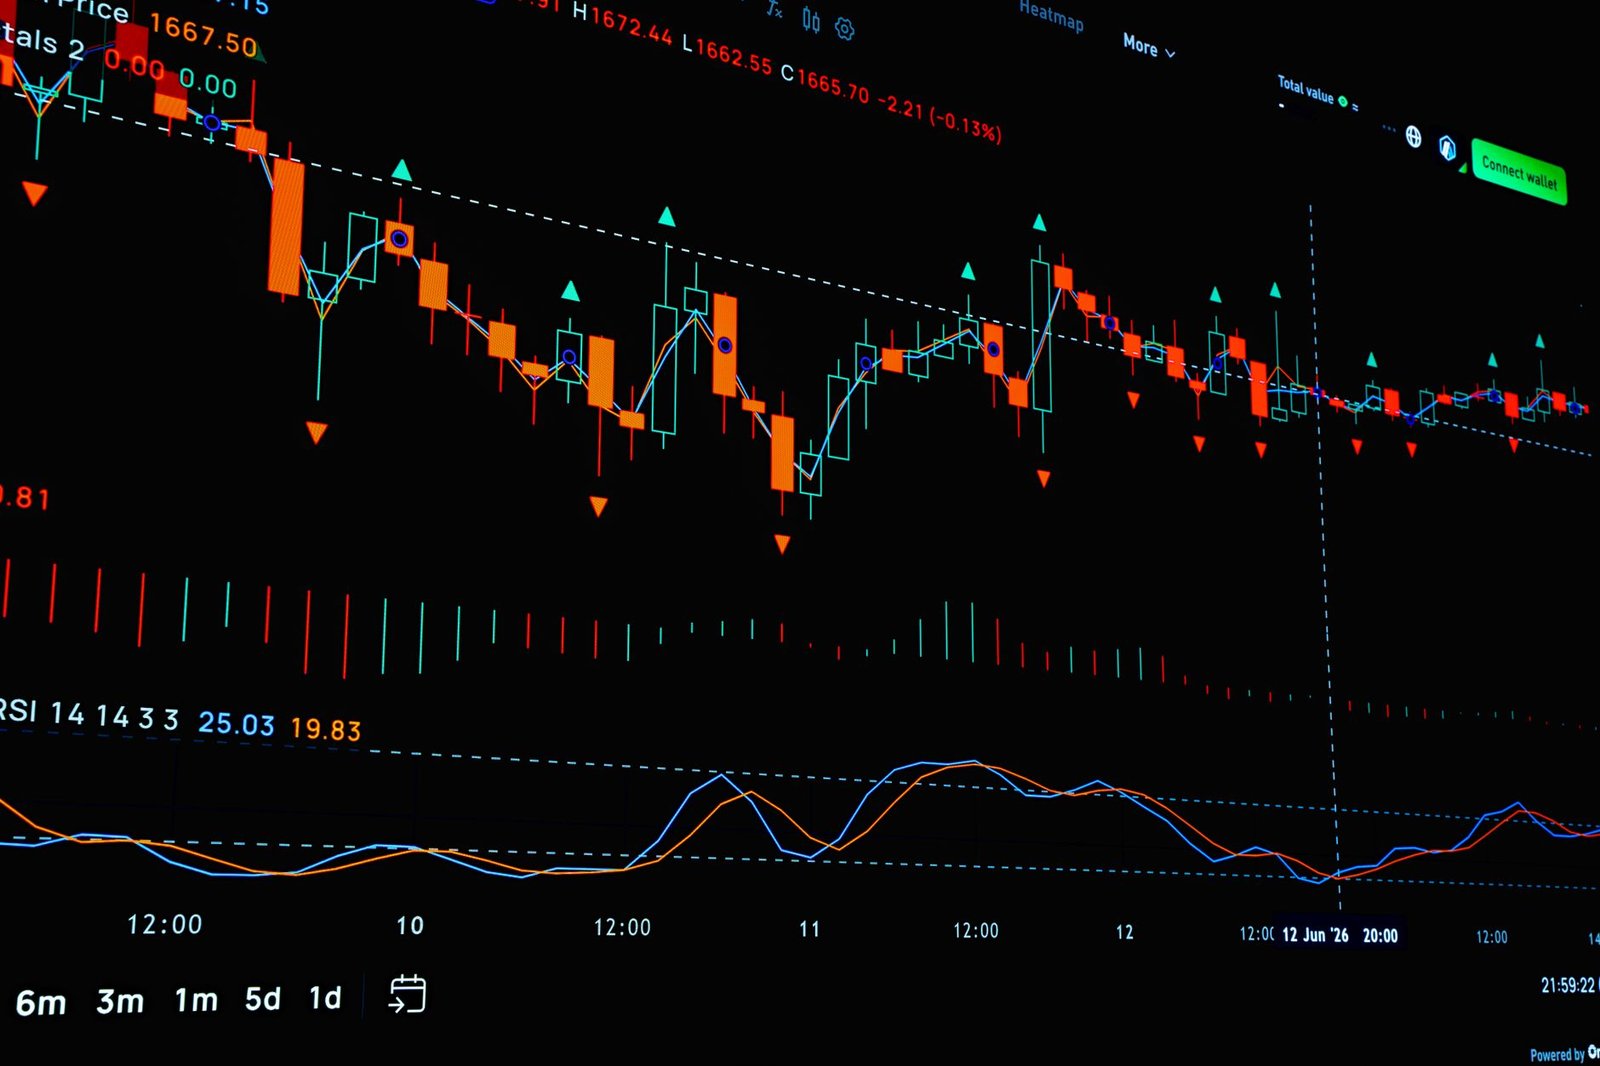
Price action is king. RSI signals are most reliable when they align with what the price chart is showing. A bullish RSI divergence is much more powerful if it occurs near a well-defined support level. Likewise, a bearish RSI signal gains credibility when it happens at a resistance level or after a failed breakout attempt. Observing candlestick patterns – such as engulfing candles, hammers, or shooting stars – at these RSI-indicated turning points provides strong confirmation for entries.
Using RSI with Moving Averages
Moving averages help define the trend. When the price is trading above a significant moving average (like the 50-day or 200-day MA), it’s generally considered an uptrend. In this scenario, a bullish RSI signal (e.g., RSI exiting oversold territory or showing a bullish divergence) could be a signal to enter a long position, anticipating the trend’s continuation. Conversely, if the price is below the moving average, a bearish RSI signal might suggest a good entry for a short trade.
Using RSI with Volume Analysis
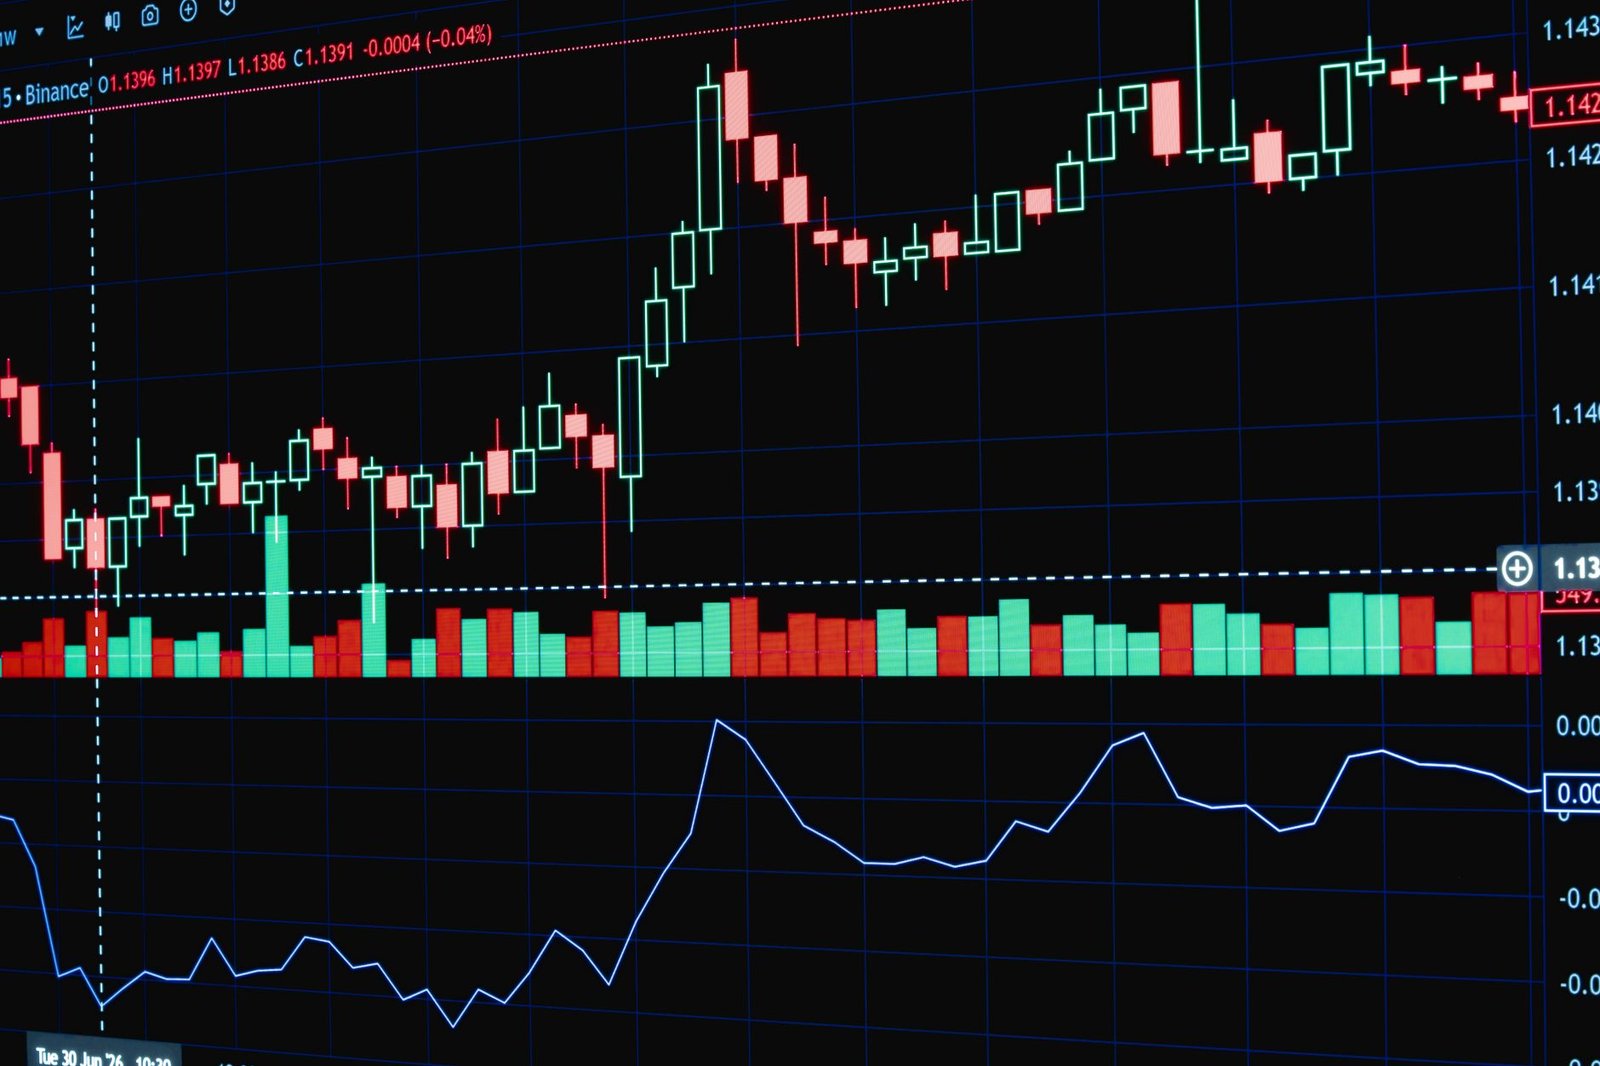
Volume is a crucial component for confirming price moves. A bullish divergence on the RSI coupled with increasing volume as the price starts to move up can be a strong buy signal. This indicates that not only is momentum shifting, but there’s also conviction from traders behind the upward move. Similarly, a bearish divergence on the RSI accompanied by rising volume during a price decline can confirm the strength of the selling pressure.
Frequently Asked Questions
What is the ideal RSI level for a trade entry?
There isn’t a single ideal RSI level; it depends on market conditions. Generally, readings below 30 suggest oversold conditions (potential buy), above 70 suggest overbought (potential sell), and divergences often occur around these extremes or the 50 level.
Can RSI be used for stop-loss placement?
While RSI itself doesn’t directly set stop-losses, its signals can inform placement. For instance, if entering on a bullish divergence, a stop-loss might be placed below the low the price made before the divergence formed.
How does RSI behave in a strong trending market?
In a strong uptrend, RSI can stay above 70 for prolonged periods, and in a strong downtrend, it can remain below 30. In these cases, traditional overbought/oversold signals are less reliable; traders might look for pullbacks to the 40-50 level as entry points.
Is RSI better for stocks or Forex?
RSI is a versatile indicator effective across various markets, including Indian stocks (NSE/BSE), commodities (MCX), and Forex. Its momentum-measuring capability is universally applicable.
What are the limitations of the RSI indicator?
RSI can generate false signals, especially in choppy or non-trending markets. It is also a lagging indicator and should always be used with other forms of analysis for confirmation.
How often should I check the RSI for different timeframes?
The frequency depends on your trading style. Day traders might use 5-minute or 15-minute charts with RSI, while swing traders might prefer hourly or daily charts. Always ensure your RSI timeframe aligns with your overall trading strategy.
Key Takeaways
- The RSI indicator measures the speed and change of price movements, helping identify overbought (above 70) and oversold (below 30) conditions.
- Bullish and bearish divergences between price action and RSI are potent signals for potential trend reversals.
- In trending markets, look for RSI pullbacks to the 40-50 zone (uptrend) or 50-60 zone (downtrend) for entries, rather than just extreme levels.
- Always confirm RSI signals with price action, support/resistance levels, volume, or other technical indicators.
- RSI is a valuable tool for traders on NSE, BSE, MCX, and Forex markets when used judiciously.
- Proper risk management, including stop-loss orders, is essential when trading based on RSI signals.
- Consider using advanced tools like a proprietary TradingView indicator to enhance your analysis.
Disclaimer: Trading in the Indian securities market involves risks. Investors are advised to exercise caution and consult with a SEBI-registered investment advisor before making any investment decisions.





 Finovatives